Geo-Spatial Analysis of Caesarean Section in India
Vijay Kumar Mishra*
Research Scientist, Public Health Foundation of India, India
Submission: October 04,2019; Published: October 22,2019
*Corresponding author:Vijay Kumar Mishra, Research Scientist, Public Health Foundation of India, Haryana, India
How to cite this article: Vijay Kumar Mishra. Geo-Spatial Analysis of Caesarean Section in India. OAJ Gerontol & Geriatric Med. 2019; 5(2): 555658. DOI: 10.19080/OAJGGM.2019.05.555658
Abstract
European citizens become happy old, when they live in resilient societies.
Background: This study focuses on the current scenario of caesarean section delivery in India and its states. Study shows an association between caesarean section and other related variables like institutional delivery and women literacy.
Methods: Study uses data of 3rd and 4th rounds of National Family Health Surveys (NFHS 3 & 4, 2005-06, 2015-16). Spatial analyses have been done to know the cluster of C-section deliveries in different states of India.
Results:This study shows that C-section deliveries are very high in southern states than other parts of India. Correlates between caesarean section and women who have completed 10 years of their schooling reveal that higher the literacy level in the states, higher the C-section deliveries. So, literacy plays a very prominent role in C-section deliveries. Main cause of the high C-section deliveries is increasing institutional deliveries and women literacy across some of the states of India.
Conclusion: It is concluded from the study that C-section deliveries have increased rapidly over a period of ten years. Caesarean section deliveries are very high in urban areas than rural areas. This is because of awareness and accessibility in Urban areas. Lifestyle also plays a very important role in C-section delivery
Keywords: Institutional Birth; Cesarean Section; Lisa Cluster Map
Abbrevations: NFHS: National Family Health Surveys; DHS: Demographic and Health Survey; IIPS: International Institute for Population Sciences; EAG: Empowered Action Group
Introduction
Caesarean Section delivery is a surgical procedure in which a fetus is delivered through an incision in the mother’s abdomen and uterus. C-Section deliveries more 15 percent is regarded as a serious public health concern. Many of the developing countries like Bangladesh, China etc. have seen increment in caesarean section in the past two decades. In developing countries like China, one important reason of growing rate of cesarean section can be attributed to the increase of institutional births. As far as the cost concern, we know that caesarean section delivery costs more than normal delivery. Also, recovery through C-section takes more time than normal delivery. Cesarean section delivery should be according to the needs of the pregnancy based on doctor’s prescription. But, nowadays practices of caesarean section deliveries are very easy-going tasks that are increasing day by day. There is no doubt in this fact that credits go to doctors. Lifestyle of women plays a very important role. In the absence of physical work, people are getting overweight. In India, women are not replacing their physical activities. According to world health report [1] countries with caesarean section rate less than 10 percent were considered to show underuse, while countries with rates above 15 percent were considered to show overuse. Several studies have shown an inverse association between caesarean section rates and maternal and infant mortality at population level in low income countries where large sectors of the population lack access to basic obstetric care. C-Section rates above a central limit have not shown additional benefit for the maternal or child benefit, and some studies have even shown that high caesarean section rates could be linked to negative consequence in the maternal and child health.
According to [2], international healthcare community has considered the ideal rate for caesarean section to be between 10 to 15 percent. Since then, CS rates have become increasingly common in both developed and developing countries. When medically justified, a caesarean section can effectively prevent maternal and perinatal mortality and morbidity. However, there is no evidence showing the benefits of caesarean delivery for women or infants who do not require the procedure. As with any surgery, caesarean sections are associated with short and long-term risk which can extend many years beyond the current delivery and affect the health of the woman, her child and future pregnancies. These risks are higher in women with limited access to comprehensive obstetric care.
There is currently no internationally accepted classification system for CS that would allow meaningful and relevant comparisons of CS rates across different facilities, regions or cities. Among the existing systems used to classify caesarean sections, the 10-group classification (Robson classification) has in recent years become widely used in many countries. Mothers with high standard of living are usually inclined to utilize health Betran and her colleagues estimated that at the beginning of twenty first century the average caesarean section was 3.5 percent in Africa, 14.9 per cent in Oceania and in all other continents, it was above the 15 per cent mark. In the United States of America, the proportion of caesarean section to total births increased from 20.7 percent in 1996 to 3.11 percent in 2006. Joshua Vogel and colleague analyzed data from 287 facilities in 21 countries that were included in both the WHO Global Survey of Maternal and Perinatal Health (2004-08) and the WHO Multi- Country survey of Maternal and Newborn Health (2010-11). The results show not only the large increase in the caesarean section rate as country move from lower to higher Human Development Index (HDI) categories but also rates are consistently rising even within these categories.
Delivery by Caesarean Section Access to caesarean section (C-section) can reduce maternal and neonatal mortality and complications such as obstetric fistula. However, a caesarean section without a medical need can put a woman at risk of short and long-term health problems. [3] WHO advises that caesarean sections should only be done when medically necessary, and does not recommend a target rate for countries to achieve at the population level? The 2015-16, NFHS-4 found that 17 percent of live births in the five years before the survey were delivered by caesarean section. Forty-five percent of the C-sections were decided on after the onset of labour pains, compared with 55 percent that were decided on before the onset of labour pains (NFHS-4, Report, 2015-16). According to NFHS -3 (2005-06) cesarean section in India was 8.5 per cent while National Family Health Survey (NFHS-4) conducted by IIPS, it has increased 17.2 percent. So, almost 9 per cent has increased over a period of 10 years (NFHS-4 Report, 2015-16).
Objectives of the Study
Reagents
a) To study the geo-spatial distribution of cesarean section in India.
b) To understand the relationship between women with 10 or more years of schooling, institutional births and caesarean section.
Rationale of the Study
Cesarean section is a public health concern in India. This study is needed to know the possible causes of high cesarean section rates in India. Evidences have shown the pervasiveness of socioeconomic inequalities in health both between and within counties at any stage of development. This clearly shows the seriousness of the emerging socioeconomic dividend in the levels of demographic and socio-economic development, especially in country like India that is struggling to dent the vicious cycle of malnutrition which has not yet received the public attention it deserves. In India, there has been quite wide differences across the geographies, religion, caste, and other socio-economic characteristics. We know that infant mortality rate is regarded as the public health indicator of any country. Higher the infant mortality, lower the public health status. It is evident from the previous studies done on caesarean section that education, awareness and accessibility play a very important role in higher C- section deliveries. This study also tries to understand the relationship between high literacy and cesarean section.
Methods and Materials
Data
The data used for this study is the compilation of fourth round of National Family Health Survey (NFHS, 2015-16) factsheets. The NFHS is Indian version of Demographic and Health Survey (DHS) [4] which is a standardized survey over 90 countries with over 300 surveys worldwide. The NFHS-IV is coordinated by the International Institute for Population Sciences (IIPS) with financial support of the Ministry of Health and Family Welfare, Government of India. It provides information on important indicators of maternal and child health, fertility and mortality. NFHS-4 fieldwork for India was conducted from January 2015 to December 2016 by 14 Field Agencies and gathered information from 601,509 households, 699,686 women, and 103,525 men using multi-stage probability proportionate sampling. NFHS- 4 covered all the 29 states and 7 union territories and for the first time provides information on district-level (all 640 districts in India as per census 2011) estimates for many important indicators. The details of sampling procedure and data collection protocol can be found elsewhere (IIPS, 2017). The information from all state level factsheets were brought together in excelsheet. The relevant indicators of nutrition and other socioeconomic variables were used for the analysis. Data were properly filtered and cleaned before used for analysis
Outcome variable
Caesarean section, caesarean section in private health facility and caesarean section in public health facility have been used as outcome variables.
Predictor variable
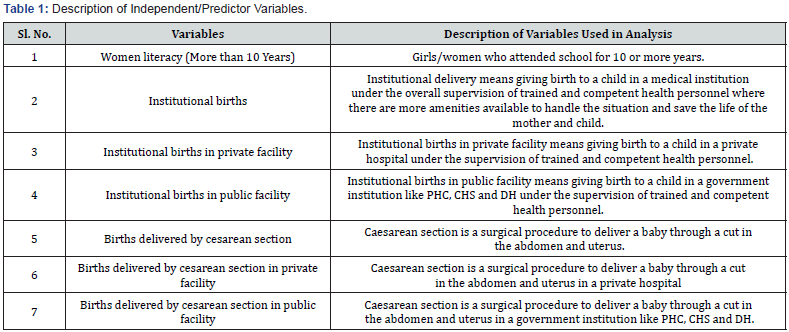
This study uses women literacy, institutional births, institutional births in public facility, institutional births in private facility as independent variables (Table 1).
Methods
Software used:
STATA (version-13.0) for mapping and GeoDa(version-1.12) for geo-spatial analyses, i. e., Moran plot & LISA cluster maps. Scatter diagrams with exponential line- fit have been created using excel.
Geo-spatial analysis
Spatial maps have been created with standard categorization suggested by World Health Organization (WHO) for C-section deliveries [5]. Moran-I and LISA statistics were calculated using Geo-Da software. Moran-I has been used to measure the overall spatial autocorrelation at state level which is an indicator of spatial association to show auto-correlation between spatially lagged variables. The LISA statistic gives an indicator of an extent of significant spatial clustering of similar or dissimilar around a spatial feature. Four types of spatial associations can be derived from LISA with HH(High-High), LL(Low-Low), LH(Low-High) and HL(High-Low). Above table shows the literacy and marital status of women in Indian states. Almost sixty-eight percent of women are literate in India and 36 per cent women have completed 10 or more years of their schooling. Literacy status of women living in southern parts of India is much better than north and north-eastern states (Table 2).

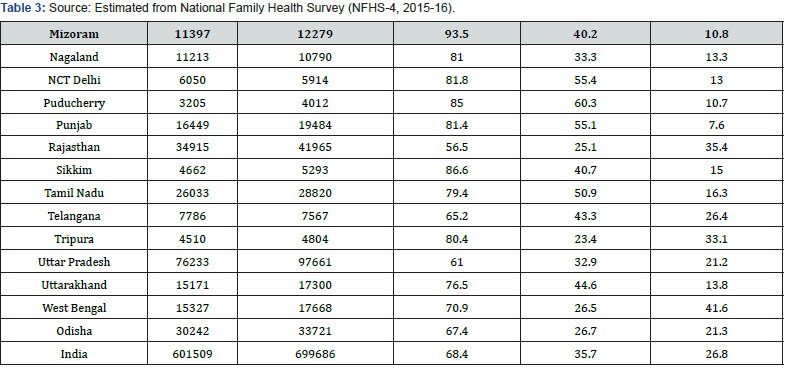
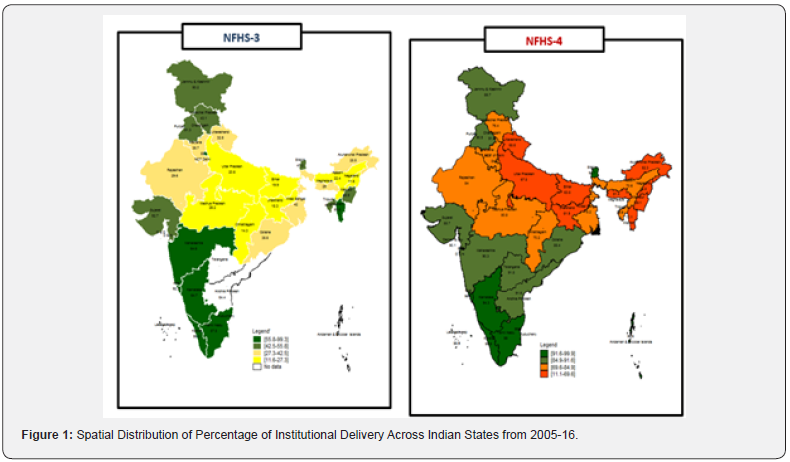
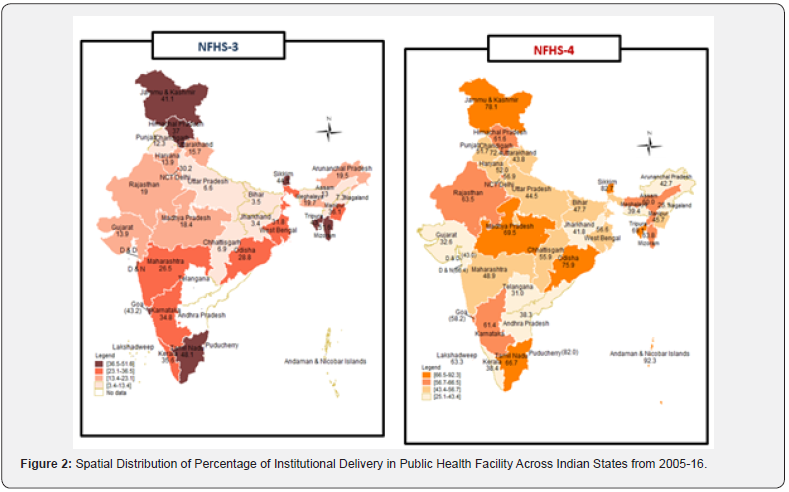
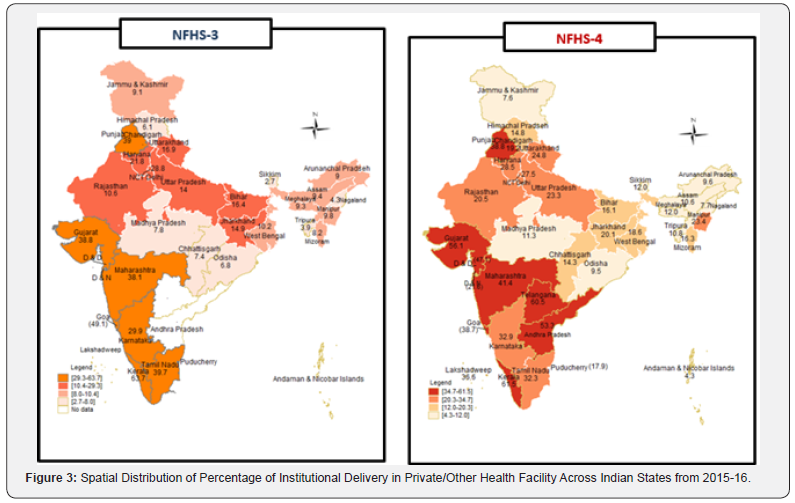
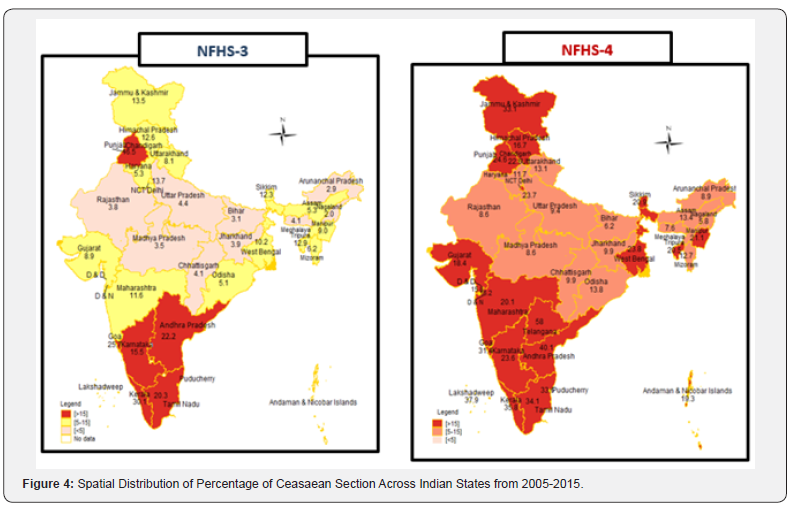
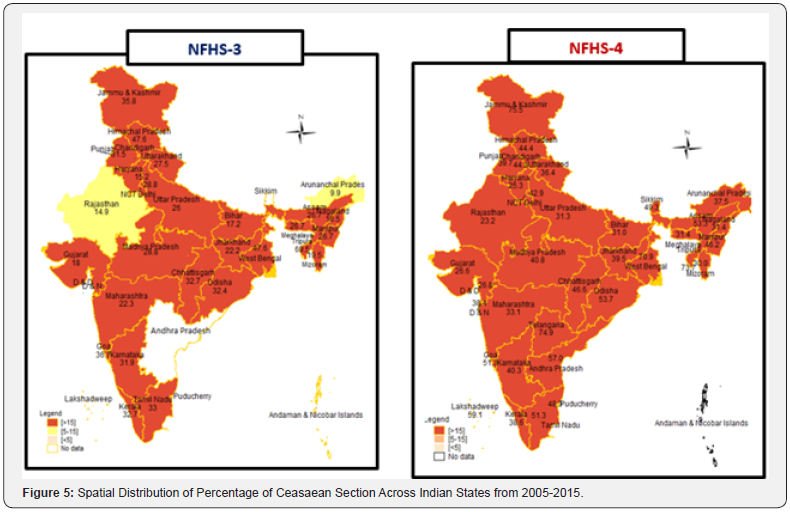
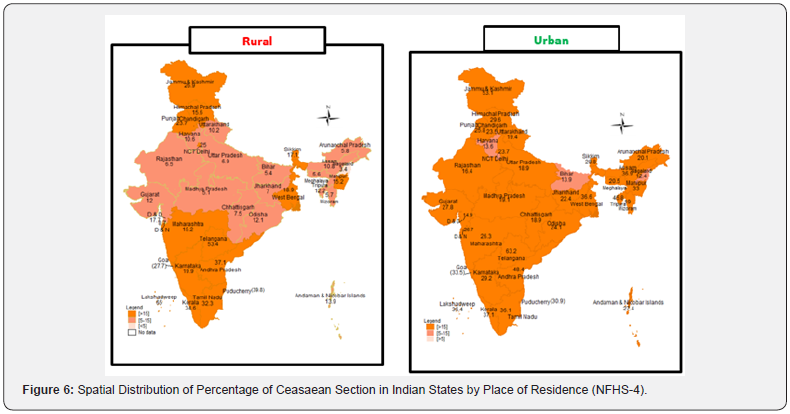
(Table 3) More women are married before 18 years in the states belonging to Empowered Action Group (EAG States). Most of women in southern parts of India complete 10 or more years of schooling while EAG states lag in literacy (Figure 1). Above figures reveal that institutional deliveries have increased from 2005 to 2016 [6]. Spatial distribution shows that EAG states like Rajasthan, Madhya Pradesh, Uttar Pradesh show a very high variation in institutional deliveries from 2005 to 2016. Lower institutional deliveries can be seen in north-eastern states like Mizoram, Manipur, Nagaland and Arunachal Pradesh [7]. Out of all the southern states of India, Kerala and TamilNadu show the highest institutional delivery (Figure 2). It is clear from the above figures that deliveries have increased in public health care facilities over a period of 10 years. Among EAG States, Rajasthan and Madhya Pradesh show more cases of deliveries in public health facilities. Lower deliveries in public sector can be seen in north-eastern states like Mizoram, Manipur, Nagaland and Arunachal Pradesh [8] (Figure 3). Out of the southern states of India, Telangana and Andhra Above figures reveal that deliveries in private health facilities have increased from 2005 to 2016 [9]. Spatial distribution shows that EAG states like Odisha and Madhya Pradesh show a very low cases of deliveries in private health facilities. Also, low percentage can be seen in northeastern states like Mizoram, Nagaland and Arunachal Pradesh. Out of southern states of India, Kerala and Telangana show the highest deliveries in private health facilities [10] (Figure 4). It is clear from the above maps that cesarean sections have increased from 2005-2016.More than half of the Indian states show high caesarean section rates (NFHS-4, 2015-16). Above map reveals that caesarean section scenario has changed drastically over a period of ten years (Figure 5). Above figures clearly reveal that C-section deliveries are performed in private facilities. Spatial distribution of caesarean section clearly reveals that caesarean section deliveries in private health care facilities have been increased over a period of ten years in all the states of India (Figure 6).
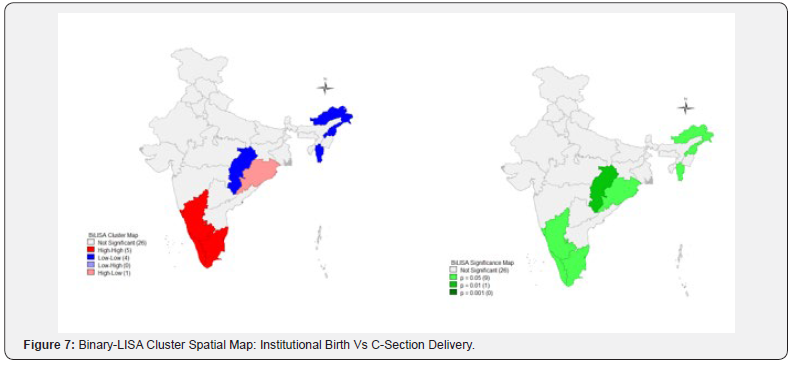
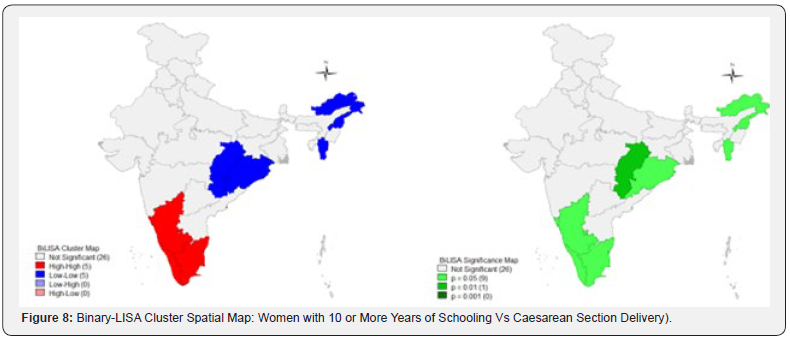
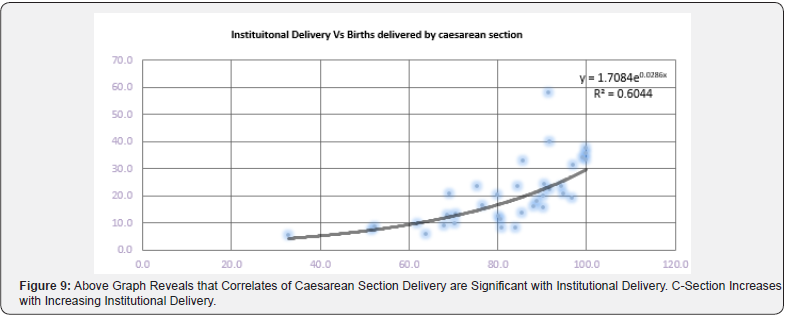
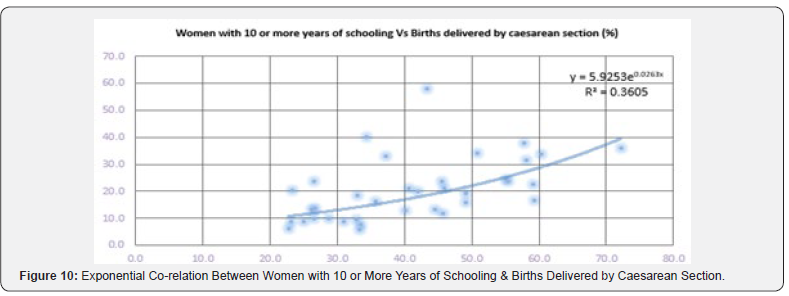
Above figures clearly show that caesarean section deliveries are very high in urban area than rural. C-section deliveries are higher in southern states of India [11]. Telangana shows the highest caesarean section deliveries than other states of India. Caesarean section deliveries are less in empowered action group states like Rajasthan (16.4%), Bihar (13.9%), Uttar Pradesh (18.9%) etc (Figure 7). Above map clearly shows the high clustering in the southern states and low clustering in northeastern parts of India. Southern states should be prioritized for caesarean section deliveries because of high C-section [12]. This map clearly shows that higher the institutional delivery, higher the caesarean section in the states (Figure 8). Above binary LISA cluster map shows the significant status of caesarean section delivery with the women who have completed 10 or more years of their schooling. Most of the C-section deliveries are performed in the Southern states which are regarded as highly literate states of India. LISA cluster map clearly show that literacy plays a very important role in C-section deliveries [13] (Figure 9). Above graph reveals that correlates of caesarean section delivery are significant with institutional delivery C-section increases with increasing institutional delivery (Figure 10). Above figure clearly show that there is a positive correlation relationship between caesarean section rate and women who completed their 10 or more years of schooling.
Conclusion
Based on facts and figure it is concluded that caesarean section deliveries are more than fifteen per cent in most of the states of the country. C-section deliveries are performed more in the southern parts of India. Empowered Action Group (EAG) States like Uttar Pradesh, Bihar, Rajasthan etc. reveal a very low rate of C-section deliveries than other parts of India. C-section rate is the highest in Telangana and lowest in Bihar. Literacy plays a very important role in C-section deliveries, i.e., higher the literacy higher is the chances of C-section deliveries. Caesarean section deliveries are more in urban areas than rural area. Private institutions are performing more C-section deliveries than public health institutions [14]. Among North-Eastern states most of the C-section deliveries are performed in private institutions of Tripura (87.1%).
Suggestions
Indian Government should take an initiative to reduce the C-section section delivery so that its future implications should be minimized. Since, C-section deliveries without a medical need can put women at risk of short and long-term health problems. According to WHO, C-section deliveries should only be performed when medically necessary [15]. Caesarean section deliveries are mostly performed by doctors practicing in private hospitals rather than public hospitals. Therefore, it is necessary to formulate a mandate and implement in at the states where C-section is too high [16].
References
- (2005) World Health Organization. World Health Report.
- World Health Organization (1985) Appropriate technology for birth. Lancet 2(8452): 436-437.
- World Health Organization (2015) WHO Statement on Caesarean Section Rates, p. 8.
- Demographic and Health Surveys.
- World Health Organization. WHO European Regional Office Health for all database.
- Women's Healthcare Australia (2016) Women's Healthcare Australia Benchmarking Report: Maternity Care 2014/2015.
- Betrán AP, Merialdi M, Lauer JA, Bing-Shun W, Thomas J, et al. (2007) Rates of caesarean section: analysis of global, regional and national estimates Paediatr Perinat Epidemiol 21(2): 98-113.
- Ronsmans C, Holtz S, Stanton C (2006) Socioeconomic differentials in caesarean rates in developing countries: a retrospective analysis. Lancet 368(9546): 1516-1523.
- Belizán JM, Althabe F, Cafferata ML (2007) Health Consequences of the Increasing Caesarean Section Rates. Epidemiology 18(4): 485-486.
- Villar J, Valladares E, Wojdyla D, Zavaleta N, Shah A, et al. (2006) Caesarean delivery rates and pregnancy outcomes: the 2005 WHO global survey on maternal and perinatal health in Latin America. Lancet 367(9525): 1819-1829.
- JP Vogel, AP Betrán, N Vindevoghel, Souza JP, Torloni MR, et al. (2015) Use of the robson classification to assess caesarean section trends in 21 countries: a secondary analysis of two WHO multi country surveys. Lancet Glob Health 3(5): e260-270.
- AIHW NPSU, Australia's Mothers and Babies (2000) AIHW Cat. No. PER 21, vol. 12 of Perinatal Statistics Series, AIHW National Perinatal Statistics Unit, Canberra, Australia, 2003.
- AP Betran, MR Torloni, J Zhang Ye J, Mikolajczyk R, et al. (2015) What is the optimal rate of caesarean section at population level? A systematic review of ecologic studies, Reprod Health 12(1): 57.
- MR Torloni, AP Betran, JP Souza Widmer M, Allen T, et al. Classifications for cesarean section: a systematic review, PLoS One 6(1): e14566.
- MS Robson (2001) Classification of caesarean sections, Fetal and Maternal Medicine Review 12(1): 23-39.
- AP Betrán, N Vindevoghel, JP Souza, AM Gülmezoglu, MR Torloni (2014) A systematic review of the Robson classification for Caesarean section: what works, doesn't work and how to improve it. PLoS One 9(6): e97769.


