Genetic Input from Wild Giant Pandas (Ailuropoda melanoleuca) into the Captive Population Simulated by OMPG Rule
Mengmeng Zhang1, Fujun Shen1,2, Tao Yang1, Han Zhang1, Yunfeng Lu1,5* and Keliang Wu1,3*
1Department of Animal Genetics and Breeding, National Engineering Laboratory for Animal Breeding, College Animal Science and Technology, China Agriculture University, Beijing, 100193. P.R. China
2The Key Laboratory for conservation biology of endangered wildlife, Sichuan Province; Chengdu Research Base of Giant Panda Breeding, Chengdu, Sichuan, 610081. P.R. China
3 The Key Laboratory for conservation biology of endangered wildlife, Sichuan Province; Chengdu Research Base of Giant Panda Breeding, Chengdu, Sichuan, 610081. P.R. China
Submission: October 26, 2018; Published: December 05, 2018
*Corresponding author: Keliang Wu, Department of Animal Genetics and Breeding, National Engineering Laboratory for Animal Breeding, College Animal Science and Technology, China Agriculture University, Beijing, 100193. P.R. China.
Yunfeng Lu, School of life science & technology, Nanyang normal university, Nanyang Henan, 473061. P.R. China
How to cite this article: Mengmeng Z, Fujun S, Tao Yang, Han Zhang, Yunfeng L, et al. Genetic Input from Wild Giant Pandas (Ailuropoda melanoleuca) into the Captive Population Simulated by OMPG Rule. JOJ Wildl Biodivers. 2018: 1(1): 555553.
Abstract
Recent success in breeding of the giant pandas in captivity has encouraged panda conservationists to believe that the ex situ populations can serve as an available and practical approach for supporting the wild populations. However, microsatellite analysis has revealed that the captive populations retain lower genetic diversity compared with those of the wild. For this reason, introduction of genetic materials from wild pandas into captive populations is very necessary for sustainable and effective conservation regime of genetic diversity in the captive pandas. In order to perform genetic input from wild populations effectively, two crucial issues must be intensively investigated.
The first issue is which population is the priority for genetic input, and the second one is that how many migrants are imported each generation. In this study, genetic variability that presented in captive as well as wild populations was analyzed. Via comparison with estimators of genetic diversity among populations, e.g., contributions for each population to diversity (CT , CS , CD ) and differential indicators (STDST and GST) Boxing population is the best donor for genetic input. Further, the OMPG method was employed to simulate the situation of genetic input from Baoxing population into the captive population. The results suggested this genetic input can offset genetic deterioration of the captive population in small size (Ne=50) for long-term (50 generations) maintaining the genetic diversity at the stable or even higher level of initial population. This will be a powerful reference for making decisions on conservation of genetic diversity of giant panda in the future.
Keywords: Genetic input; Giant panda; Captive breeding; Ompg Rule; Simulation
Introduction
The giant panda, Ailuropoda melanoleuca (Carnivora, Ursidae), which is one of the world’s most endangered mammals as well as arguably the world’s most recognized flag species [1] distributes only in China, especially in Sichuan province, south-western China [2] The preservation and maintenance of giant panda populations is long-term concern and interest in conservation strategies. According to the 4th national survey of giant pandas, there are 1864 individuals living in 33 fragmented populations worldwide [3], compared with 1596 in 1999. Therefore, the International Union for Conservation of Nature (IUCN) recently down listed giant pandas from “endangered” to “vulnerable” [4]. However, giant panda populations are still threatened especially for populations with small size and isolated by habitat fragmentation and degeration, bamboo shortage, and mismanagement of reserves [5], as well as the effects of climate change [6-7]. There is also a phenomenon in the wild that the inbreeding level of giant pandas is higher than expected [8]. So there is a need for reintroduction of individuals into small population for preventing the reduction of genetic diversity into giant panda population [9], and active management which included habitat restoration, translocation, and reintroduction is essential to reduce the extinction risks faced by most panda populations [MacKinnon et al., 1989]. Unfortunately, although widely advocated in conservation biology, in reality, adaptive management is rarely implemented [10], a comprehensive ex situ management plan with a targeted population size, and genetic diversity goals; and if needed, approaches for preparing captive-bred pandas for release to the wild which was provided by [11] in a non-exhaustive overview of the types of management questions that need to be addressed using an adaptive management paradigm.
In recent years, a great leap of population growth by much success in captive breeding programs is achieved benefited from substantial new knowledge has been acquired on panda behaviour, reproductive physiology, endocrinology, nutrition, genetics, primarily AI and veterinary care [12-16]. Moreover, by comparing and analysing ancient mitochondrial DNA sequences and modern giant pandas, it is found that genetic diversity is less affected by habitat contraction [17]. The programs, however, focus more on the reproduction of cubs and less on conservation of genetic diversity. The overall demographic goal for captive populations is to increase the population, as rapidly as possible and the genetic goal for these populations is to retain the founder’s genetic diversity, as unchanged as possible over time [18].
Although the panda population in captivity has increased, the genetic diversity of the captive population is low compared to that in the wild; the genetics of the captive population need to be carefully managed [19-20]. Although there are currently sufficient wild-caught individuals in the captive population (both founders as well as potential founders that have not yet reproduced) to achieve the genetic goal if a sufficient intensity of genetic management, but most of potential founders are too old (or sick), they cannot contribute to the captive population at all, and moreover, founders with sharply different contribution rates to the population development in captive population Zhang .
One of the core concerns for giant panda conservationists is to maintain a high level of genetic diversity in captive breeding programs by minimizing selection to captivity because it is related to fitness, inbreeding depression and survival of giant panda individuals. Introducing genetic materials from wild pandas into captive populations is one of effective on-the-ground actions to maintain the level of the genetic diversity in captive pandas to be representative of the wild populations [21]. The ultimate goal is maintained all alleles sampled in the wild population that could help for future reintroduction program. It might take several steps to achieve this goal. In the first step, we need improve the genetic diversity of the captive population efficiently. In order to manipulate genetic input from wild populations effectively, two crucial issues must be intensively investigated. The first issue is which population is the priority for genetic input, and the second one is that how many migrants need to be imported each generation.
In this study, genetic variability presented in two captive (Chengdu Research Base of Giant Panda Breeding and the China Research and Conservation Center for the Giant Panda at Wolong) and three wild (Baoxing Nature Reserve, Wanglang Nature Reserve and Tangjiahe Nature Reserve) populations was analyzed by microsatellite markers, we took the two captive populations (Chengdu and Wolong) as a whole captive populations due to the captive population is cooperatively managed with some level, and the cooperation is becoming closer in recent year, and there was gene flow between the two captive populations [22]. Additionally, the estimators of genetic diversity such as contributions for each population to total genetic diversity and intrapopulation as well as interpopulation genetic diversity ( T C , S C , D C ) and differential indicators ( ST D and ST G ) were used to decide which population was the priority for the genetic input. The one migrant per generation (OMPG) rule was employed to maintain the level of genetic diversity of captive population because it has been proved effective for analyzing gene flow between subpopulations [e.g. 23-29]. To date, it has also been applied widely to the simulation studies on various species [30-32].
In essay, genetic structures of the captive and captiveimmigration populations based on 11 microsatellite datasets were established. Captive-immigration populations are defined that the captive populations with one panda (male or female) migrates from Baoxing population. Furthermore, the changes of genetic diversity over generations of those populations were investigated by computer simulation experiments. The results showed that this genetic input can offset genetic deterioration of the captive population in small size (Ne=50) for long-term (50 generations) maintaining the genetic diversity at the stable or even higher level of initial population. There are significant differences in genetic diversity between the captive and captive-immigration populations. Our study results will be a good guide not only for making the genetic input plan to guarantee that the maintenance of high level of genetic diversity in captive population to make it representative, but also for ‘self-sustaining’ ex situ and/or in situ populations.
Materials and Methods
Study Area
Samples of the captive population were collected from Chengdu Research Base of Giant Panda Breeding (104.1ºE, 30.7ºN; n= 49) and Wolong Chinese Giant Panda Breeding Center (102.5ºE, 30.5ºN; n= 34). Samples of wild pandas were collected from three populations in two different mountain regions, including Baoxing (102.8ºE, 30.4ºN; n= 25) in the Qionglai mountains, Wanglang (104.5ºE, 32.5ºN; n= 31) and Tangjiahe (105.1ºE, 32.6ºN; n= 33) in the different fragmented patches of Minshan mountains. The detailed information is shown in (Figure 1).

Microsatellite Data Set
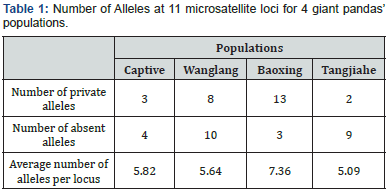
Computer simulation experiments are base the allelic frequencies of 11 microsatellite loci, which were genotyped by ABI 310 system [7,20,33]. Frequencies of Allele and private alleles for each locus were analyzed through the software Convert 1.31 [34]. The dataset in detail was shown in (Table 1).
Evaluation of the Contribution for Each Population
The contributions of each population to the overall diversity
followed the method of Petit et al. [35] The contribution
of the kth population to total diversity can be calculated as  where is overall genetic diversity
  and is the genetic diversity of set excluding kth
population. The contributions of each population to intrapopulation
genetic diversity can be quantified as
  where is
diversity of kth population, and
  is intrapopulation diversity of
population set excluding kth population. (DST ) are the contributions
of population to interpopulation and?
  The
absolute (DST ) and relative (GST ) differentiation of kth population
can be calculated as following formula:

Computer Simulation Study
General consideration
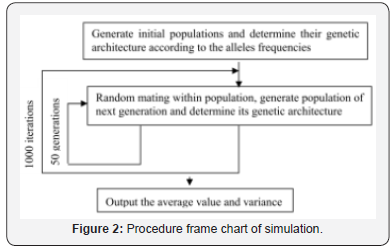
Based on microsatellite dataset, the population genetic structure of captive and three wild populations were established and the dynamic changes of genetic diversity of captive and captiveimmigrant population which is submitted to OMPG rule were investigated. The computer experiments were implemented by a computer program written in Fortran 90. Number of generations simulated is 50, and number of iterations is1000. Procedure frame chart of simulation see (Figure 2).
Genetic structure of population
The genetic makeup of populations, including captive and wild populations, was determined by dataset of 11 microsatellite loci, which are assumed as neutral markers and independent and randomly location on whole genome. The gene and genotype of each locus is simulated on allelic frequencies of 11 molecular marker loci, which were shown in Table 1. The further detailed frequencies on marker loci were depicted in Shen [20].
Maintenance of population
Assuming new immigrants would keep average genetic retention, and from the studbook analysis, Ne/N ranged from 0.164 (the poor breeding achievement in 2011) to 0.264 (the best achievement in 2008) and the generation time is 11.608 for male, 10.461 for female, we adopt Ne/N =0.2, T (generation interval) =11 in our model. In order to get the high-level genetic diversity in each generation, the reproduction strategy is random mating, that is, each male panda is mating with one female at random. In the wild population, the male can mate with many female individuals, but in captive population, the mate selection can be controlled by human activities. So, we adopt Ne≈50 due to the size of captive population is 246 which are based on actual situation at the time when sample was collected in 2010, namely, only 25 males and 25 females were supposed to contribute to next generation.
We simulated the populations by stepping through a series of events that describe an annual cycle of a typical sexually reproducing, diploid organism, mate selection, reproduction, mortality, and so on. The data and parameters are summarized in Table 2. Age of first offspring was entered as 5 years for both males and females, respectively. The annual maximum number of progenies per female was listed as 3, in case of triplets. The maximum age of reproduction was entered as 20 years. An equal sex ratio value was assigned for males and females at birth.
According to the parameters used for simulations in Table 2 and studbook analysis used for life table, we can get the enlarged rate of population size is about 4% in each generation and the rate generation overlapping is 20%, namely, 20% panda individuals in each generation is from last generation.
Indicators of Genetic Diversity
Indicators including the observed number of alleles (Ao) and the number of effective alleles (Ae) observed (Ho) and expected (He) heterozygosity, the number of polymorphic loci (Np) were utilized to quantify the genetic diversity of a given populations.
Simulation of Genetic Input
The OMPG simulation followed the method by Mills and Allendorf (1996), e.g., one-migrant-per-generation is introduced to captive population from the wild. In the study, the donor population is selected by the parameters such as and . Captiveimmigration populations are defined that the captive populations with one panda (male or female) migrates from Baoxing population.

Note: a 30% was derived by pedigree records; b the average estimate for lethal equivalent was based on the study for 45 species of mammals.
In order to investigate the effects of genetic input, the management skill of captive and captive-immigration population is same, including of reproduction strategy, the rate of generation overlapping and changes of population size.
Results
Evaluation of the contribution of each population
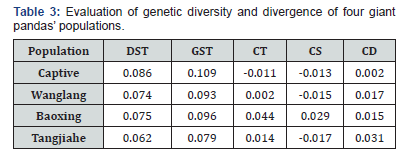
The results from evaluation of genetic diversity and divergence for four giant pandas’ populations are shown in Table 3. Baoxing giant pandas population has the largest , and , which means that it’s contributions is the most to the total genetic diversity among four populations. So, Baoxing population was considered as the donor population.
OMPG Rule in Conservation
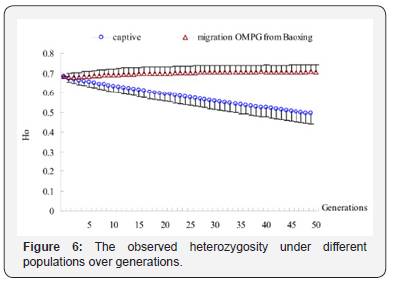
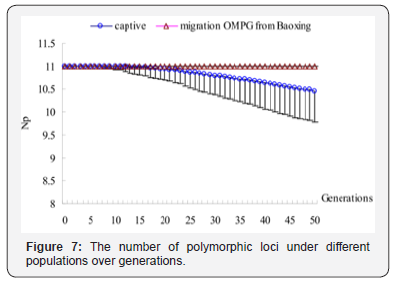
According to the results shown in Table 3, in the simulation experiment, one individual per generation migrates from Baoxing population into the captive population. The results are also shown in Figure 3-7. The simulation results showed that the trend of the genetic diversity of captive population decreases over time. But the captive-immigration population had a significantly positive effect on five diversity indicators. For captive, Ae, Ao and Np from 3.4819, 5.5603,11 in the first generation decrease to 2.2056, 3.1115, 10.459 in the 50th generation, about 36.66%, 44.04% of genes loss respectively and 4.92%of the polymorphic sites was introduced into monomorphism sites, and a reduction of 37.51%, 45.67% compared with the base population while He and Ho decreased by 27.18%, 27.22% and 27.65%, 28.28% compared with the first generation and the base population in the 50th generation respectively.
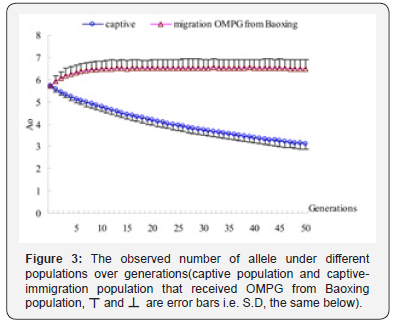


For captive-immigration population that had received OMPG from Baoxing population, Ae and Ao arise from 3.5457, 5.929 in the first generation to 3.6916, 6.4859 in the 50th generation, about 4.12% and 9.39% of genes increasing, Np maintained at 11 over generations, and an increase of 4.59%, 13.25% compared with the base population while He and Ho increase by 4.28%, 4.58% and 3.99%, 3.41% compared with the first generation and the base population respectively, which means that the polymorphic sites remain stable. Test of significance by One-way ANOVA showed that the differences were very significant (p<0.001) for the five genetic indicators between the two populations.
Discussion
Dynamics of genetic diversity in limited population size
Although the 4th national survey of giant pandas, there are 1864 individuals living in 33 fragmented populations worldwide [36] giant panda populations are still threatened especially for populations with small size and isolated by habitat fragmentation and degration, bamboo shortage, and mismanagement of reserves [5] and other factors such as insufficient subsidies for conservation programmed, poaching [37] and earthquake [38] and climate change.
This could lead to lower heterozygosity and a rapid loss of alleles because of genetic drift [39-40]. The current situation of genetic diversity on giant panda is faced by challenges. Microsatellite analysis has revealed that the ex situ populations contain lower genetic diversity compared with those in the wild Shen et al. Our results suggest that genetic diversity, including five measures, is decreased consequently over generations because inbreeding and genetic drift could not be avoided in limited population size.
How to maintain the populations at a high level is crucial management to meet the goal to create a ‘self-sustaining’ captive or isolated wild population in limited size. A ‘self-sustaining’ population should sustain 90% of the founding population’s genetic variability for 100 years, equivalent to the time required for habitat recovery [41-42]. Our result showed that introduction of genetic materials from wild pandas into the captive population is a necessary step for the captive pandas to be representative of the wild populations.
In the wild, because of the destruction and fragmentation of habitat [43-44] populations are limited in size. Some population is about several individuals. Our result suggested that reintroduction from captive to wild population [9]. So, there is a need for reintroduction of individuals into small population for preventing the reduction of genetic diversity into giant panda population [9] and active management which included habitat restoration, translocation, and reintroduction is essential to reduce the extinction risks faced by most panda populations [45].
Population for Genetic Input
Most of initial individuals in captivity originated from three protected regions including Qionglai, Liangshan, and Minshan Mountain. The wild populations in these areas were chosen as candidates for genetic input so that they could help support sustaining genetic stability of the captive population. The results shown in Table 1 illustrated that Baoxing population (in Qionglai Mountain) retains the highest allele richness and the most private alleles among three populations. Additionally, the “genetic contribution methods” also support this conclusion (Table 3).
Therefore, Baoxing population is the best donor for genetic input. Interestingly, Nature reserves in Baoxing were located very closely to the captive facilities (Figure 1). It will be more convenient to introduce the wild individuals (or semen and other genetic materials) to the captive population. In addition, the similar climate conditions and food resources in the ex-situ environment will be helpful for the “Introduction” [46-53]. In order to confirm that the best population is Baoxing population, we simulated the effect of genetic input from Tangjiahe population and Wanglang population, the results shows that the best donation population is Baoxing population from the level of genetic diversity over generation perspective.
Number of Migrants per Generation
Migration among genetically disjunctive breeding subpopulations can reduce positive and negative effects of fragmentation [25,27,39]. A widely cited figure is that one migrant per generation exchanged between pairs of subpopulations can prevent progressive genetic divergence [25,27,39]. This rule is based on Wright’s island model with a long list of simplifying assumptions Wang. The present results showed that this genetic input can offset genetic deterioration of the captive population in small size (Ne=50) for long-term (50 generations) maintaining the genetic diversity at the stable or even higher level of initial captive population. Genetic input will not only provide a better tool for genetic variability of the captive population, but also potentially save scarce alleles from small, isolated populations.
Conclusion
The results of this study suggest that Baoxing population is the best donor for genetic input with OMPG rule. And the introduction from the wild population in successive generations can offset genetic deterioration of the captive population in limited size (Ne=50) for long-term time scale (50 generations, almost 300 years). On the other hand, the wild populations which are in small population size owing to location in fragmented habitats can increase and/or maintain the level of genetic diversity by re-introduction from the captive population or exchange among other wild population by corridors among habitats. The exchanges within populations could meet the goal of giant panda breeding, a ‘self-sustaining’ population, which the population should contain 90% of the founding population’s genetic variability for 100 years, equivalent to the time required for habitat recovery [41-42].
References
- Wang T, Ye X, Skidmore AK, Toxopeus AG (2010) Characterizing the spatial distribution of giant pandas (Ailuropoda melanoleuca) in fragmented forest landscapes. Journal of Biogeography 37(5): 865- 878.
- Loucks C, Lü Z, Dinerstein E, Wang H, Olson DM, et al. (2001) Giant Pandas in a Changing landscape. Science 294: 1465.
- (2015) State Forestry Administration. The fourth national survey report on giant panda in China, China.
- Swaisgood R, Wang D, Wei F (2016) Ailuropoda melanoleuca. IUCN Red List of Threatened Species.
- Ran J, Du B, Yue B (2009) Conservation of the endangered giant panda Ailuropoda melanoleuca in China: successes and challenges. Oryx 43(2): 176-178.
- Li R, Xu M, Wong M HG, Qiu S, Li X, et al. (2015) Climate change threatens giant panda protection in the 21st century. Biological Conservation 182: 93-101.
- Shen F, Watts PC, He W (2007) Di-, tri- and teranucleotide microsatellite loci for the giant panda, Ailuropoda melanoleuca. Mol Ecol Notes 7: 1268-1270.
- Hu Y, Nie Y, Wei W, Ma T, Horn R V, et al. (2017) Inbreeding and inbreeding avoidance in wild giant pandas. Molecular Ecology 26(20): 5793-5806.
- Fang S, Wan Q, Fujihara N (2002a) Genetic diversity of the giant panda (Ailuropoda melanoleuca) between big and small populations. Journal of Applied Animal Research 21: 65-74.
- Sutherland WJ (2006) Predicting the ecological consequences of environmental change: a review of the methods. J Appl Ecol 43(4): 599-616.
- Swaisgood RR, Wei F, McShea WJ, Wildt DE, Kouba AJ, et al. (2011) Can science save the giant panda (Ailuropoda melanoleuca)? Unifying science and policy in an adaptive management paradigm. Integr Zool 6(3): 290-296.
- Swaisgood RR, Zhang G, Zhou X, Zhang H (2006) The science of behavioural management: creating biologically relevant living environments in captivity. In: Wildt DE, Zhang AJ, Zhang H, JanssenD, Ellis S, (Eds.), Giant Pandas: Biology, Veterinary Medicine and Management. Cambridge: Cambridge University Press: 274-298.
- Wild DE, Zhang A, Zhang H, Janssen D, Ellis S (2006) Giant Pandas: Biology, Veterinary Medicine and Management. Cambridge University Press, Cambridge pp. 610.
- Zhang Z, Wei F (2006) Giant Panda ex-situ Conservation: Theory and Practice. Science Press, Beijing, China.
- Guo W, Mishra S, Zhao J, Tang J, Zeng B, et al. (2018) Metagenomic Study Suggests That the Gut Microbiota of the Giant Panda (Ailuropoda melanoleuca) May Not Be Specialized for Fiber Fermentation. Front Microbiol 9: 229.
- Swaisgood R, Wang D, Wei F (2016) Ailuropoda melanoleuca. IUCN Red List of Threatened Species.
- Sheng GL, Barlow A, Cooper A, Hou XD, Ji XP (2018) Ancient DNA from Giant Panda (Ailuropoda melanoleuca) of South-Western China Reveals Genetic Diversity Loss during the Holocene. Genes (Basel) 9(4): E198.
- Ballou JD, Foose T (1992) Demographic and genetic management of captive populations. In: Kleiman D, Lumpkin S, Allen M, Thompson K, (Eds.), Wild Mammals in Captivity. Chicago: University of Chicago Press, USA, pp. 263-283.
- Tang C, Zhang H (2001) Role of captive breeding in giant panda’s conservation biology. Sichuan Journal of Zoology 20: 91-93.
- Shen F, Zhang Z, He W (2009) Microsatellite variability reveals the necessity for genetic input from wild giant pandas (Ailuropoda melanoleuca) into the captive population. Mol Ecol 18(6): 1061-1070.
- Shen G, Pimm SL, Feng C, Ren G, Liu Y, et al. (2015) Climate change challenges the current conservation strategy for the giant panda. Biol Conserv. 190: 43-50.
- Wright S (1931) Evolution in Mendelian population. Genet 16(2): 97- 259.
- Slatkin M (1987) Gene flow and the geographic structure of natural populations. Science 236(4803): 787-792.
- Mills LS, Allen Dorf FW (1996) The One-Migrant-per-Generation rule in conservation and management. Conserv Biol 10(6): 1509-1518.
- Allen Dorf FW (1983) Isolation, gene flow, and genetic differentiation among populations. In: Schonewald-Cox CM, Chambers SM, MacBride B, Thomas WL, (Eds.), Genetics and conservation: a reference for managing wild animal and plant populations. California: Benjamin/ Cummings, Menlo Park, USA p: 51-65.
- Saccheri I, Kuussaari M, Kankare M, Vikman P, Fortelius W, et al. (1998) Inbreeding and extinction in a butterfly metapopulation. Nature, Lond 392: 491-494.
- Lacy RC, Lindenmayer DB (1995) A simulation study of the impacts of population subdivision on the mountain Brushtail Possum Trichosurus caninus Ogilby (Phalangeridae:Marsupialia), in southeastern Australia. II. Loss of genetic variation within and between subpopulations. Biol Conserv 73(2): 119-129
- Luo SJ, Johnson WE, Martenson J, Antunes A, Martelli P, et al. (2008) Subspecies genetic assignments of worldwide captive tigers increase conservation value of captive populations. Curr Biol 18: 1-5.
- Sun X, Zhang Z, Zhang W, Shen F, Wang Y (2010) State of Gene Flow between Captive Giant Pandas populations. Sichuan Journal of Zoology 29(3): 333-339.
- Spielman D, Frankham R (1992) Modeling problems in conservation genetics using captive Drosophila populations: improvement of reproductive fitness due to immigration of one individual into small partially inbred populations. Zoo Biol 11(5): 343-351.
- Newman D, Tallmon DA (2001) Experimental evidence for beneficial fitness of effects gene flow in recently isolated populations. Conserv Biol 15: 1054-1063.
- Couvet D (2001) Deleterious effects of restricted gene flow in fragmental populations. Conserv Biol 16: 369-376.
- He W, Li L, Shen F (2008) Genetic diversities of the giant panda (Ailuropoda melanoleuca) in Wanglang and Baoxing Nature Reserves. Conserv Genet 9(6): 1541-1546
- Glaubitz JC (2004) Convert: a user-friendly program to reformat diploid genotypic data for commonly used population genetic software packages. Mol Ecol Notes 4: 309-310
- Petit RJ, Mousadik EL, Pons A (1998) Identifying populations for conservation on the basis of genetic markers. Conserv Biol 12(4): 844- 855.
- State Forestry Administration (2015) The fourth national survey report on giant panda in China.
- Zheng W, Xua Y, Liao L, Yang X, Gu X, et al. (2012) Effect of the Wenchuan earthquake on habitatuse patterns of the giant panda in the Minshan Mountains, southwestern China. Biol Conserv 145(1): 241-245.
- Li Y, Guo Z, Yang Q, Wang Y, Niemela J (2003) The implications of poaching for giant panda conservation. Biol Conserv 111: 125-136.
- Wright S (1943) Isolation by distance. Genet 28(2): 114-138.
- Wright S (1969) Evolution and the genetics of populations. The theory of gene frequencies. Chicago: University of Chicago Press 2.
- Soule M, Gilpin M, Conway W, Foose T (1986) The millennium ark: how long a voyage, how many staterooms, how many passengers? Zoo Biol 5(2):101-113
- Ballou JD, Miller PS, Xie Z (2006) Analysis of demographic and genetic trends for developing a captive breeding masterplan for the giant panda. In: Wildt DE, Zhang AJ, Zhang HM, (Eds.), Giant Pandas: Biology, Veterinary Medicine and Management. Cambridge: Cambridge University Press, pp. 495-519.
- Fan J, Li J, Quan Z, Wu X, Hu L, et al. (2011) Impact of road construction on giant panda’s habitat and its carrying capacity in Qinling Mountains. Acta Ecologica Sinica 31: 145-149.
- Loucks C, Lü Z, Dinerstein E, Wang H, Olson DM, et al. (2001) Giant Pandas in a Changing landscape. Science 294: 1465.
- MacKinnon J, Bi F, Qiu M (1989) The national conservation management plan for the giant panda and its habitat. World Wildlife Fund and the Ministry of Forestry, Beijing, People’s Republic of China pp: 157.
- Lacy RC (1987) Loss of genetic diversity from managed populations: interacting effects of drift, mutation, immigration, selection, and population subdivision. Conserv Biol 1(2): 143-158.
- Wang T, Ye X, Skidmore AK, Toxopeus AG (2010) Characterizing the spatial distribution of giant pandas (Ailuropoda melanoleuca) in fragmented forest landscapes. J Biogeogr 37(5): 865-878.
- Zhang Y (2010) Giant panda paternity identification and founder effect of captive population in Wolong. [dissertation]. Zhejiang, Zhejiang University, Zhejiang, China, p. 17.
- Wang J (2004) Application of the One-Migrate-Per-Generation Rule to conservation and management. Conserv Biol 18(2): 332-343.
- Tang C, Zhang H (2001) Role of captive breeding in giant panda’s conservation biology. Sichuan Journal of Zoology 20: 91-93.
- Unifying science and policy in an adaptive management paradigm. Integr Zool 6: 290-296.
- Miller PM, Lacy RC (1999) VORTEX: a stochastic simulation of the extinction process; version 8 user’s manual. Conservation Breeding Specialist Group, Apple Valley, Minnesota, USA.
- Ralls K, Ballou JD, Templeton A (1988) Estimates of lethal equivalents and the cost of inbreeding in mammals. Conserv Biol 2 pp: 185-193.

