


Studying the Infrared Spectroscopy of Compounds Fluoride that Blotched by Sb
Ahmad Khoudro1, Tark Zarouri2 and Milad Alhasno1*
1Department of Physics, Faculty of Science, Tishreen University, Syria
2Department of Physics, Faculty of Science, Aleppo University, Syria
Submitted: March 02, 2023; Published: March 20, 2023
*Corresponding author: Milad Alhasno, Department of Physics, Faculty of science, Tishreen University, Syria
How to cite this article: Ahmad Khoudro, Tark Zarouri and Milad Alhasno. Studying the Infrared Spectroscopy of Compounds Fluoride that Blotched by Sb. JOJ Material Sci. 2023; 7(5): 555721. DOI:10.19080/JOJMS.2023.07.555721
Abstract
The study of calcium fluoride is of great scientific importance due to its wide scientific applications. Therefore, our study came to some of the physical properties of the compounds of both pure Calcium fluoride and antimony doped Calcium fluoride. By measuring the infrared spectrum of pure Calcium fluoride, it is found that there are six vibratory frequencies, namely:
(3444.52 – 1517.59 – 1138.40 – 876.40 – 639.93– 436.29) cm-1 and six vibratory frequencies for antimony doped calcium fluoride at 3wt%:
(3442.13– 1516.42– 1137.98– 876.24– 638.10– 430.68) cm-1 The study showed that the absorbance values, the absorption coefficient, the refractive index and the optical length were in the antimony doped sample by 3wt% greater than that of the pure Calcium fluoride compound and are respectively: α=14.577 cm-1 n=1.817.
Keywords: Powder; Calcium fluoride; Solid state reaction; Infrared spectrum; Rare-earth ions; Optical conductivity
Introduction
Calcium fluoride is represented by the chemical formula CaF2, where CaF2 is an abbreviation for calcium fluoride. Calcium and fluoride ions are the constituent parts of this chemical. It is a crystalline solid that is noted for its transparency and has broad application as a material for transparent windows. This property allows it to be observed in the infrared section of the electromagnetic spectrum. in addition, it is utilized in the production of optical components such lenses, fiber optics, and other optical components. This is another application for the material [1,2].
The term Sb-doped calcium fluoride refers to a specific variety of the mineral calcium fluoride. During the doping procedure, this particular type of calcium fluoride was on purpose adulterated with minute amounts of antimony (Sb). Doping is a procedure that is regularly used to change the properties of a substance, and it is most commonly employed in the field of materials science. in the case of calcium fluoride that has been doped with antimony, the material may become more transparent and more resistant to being harmed by UV radiation as a result of the addition of antimony. in addition, the material may be able to withstand higher doses of ultraviolet radiation. It is also possible for it to raise the material’s refractive index, which makes the material more suit able for use in lenses and other optical components. Increasing the substance’s refractive index. One common application for antimony-doped calcium fluoride is in the production of infrared optics, such as lenses and windows. The addition of antimony can improve the transmission of infrared light through the material, making it more efficient for use in these types of devices [4,5].
Antimony doping can also be used to improve the performance of calcium fluoride in other applications, such as in the production of coatings for solar panels or as a component in lasers. The specific effects of antimony doping on the properties of calcium fluoride will depend on the amount of antimony added and the processing conditions used. Calcium fluoride (CaF2) density is 3.18 (g/cm3) melting at 1633 (K) and crystalize in cubic structure with lattice constants a = 5.432 Å. CaF2 is presently the fastest known scintillator. It has an emission component with sub nanosecond decay time [6,7]. CaF2 has several scintillation emission bands. The fast scintillation light is emitted in the UV bands centered at 220 and 200nm.
The decay time of the fast component varies between 600 and 800 ps [3]. CaF2 has attracted much attention because of its wide range of potential applications in optoelectronic and microelecAbstract tronic devices [8,9]. CaF2 compounds doped with rare-earth ions have been reported to display unique luminescence properties and can thus be used as scintillators [10,11]. in general, Sb-doped calcium fluoride is a versatile material that has a range of prospective applications in many different kinds of businesses. These applications may be found in a number of different industries. These applications can be discovered in a wide number of subcultures and subfields. Its one-of-a-kind properties make it a strong contender for use in a wide variety of optical and electronic devices, making it a good option for this kind of application. This study is aimed at characterizing CaF2 compounds doped with rare-earth ions such as Sb.
Research Materials and Methods
The following materials have been used in preparing the samples
a) calcium fluoride CaF2 (99% purity, TITAN BIOTECH LTD, origin India).
b) antimony Sb (purity 99%, TITAN BIOTECH LTD, origin India).
Devices and tools used
a) Sensitive scale type (SARTORIUS) with an accuracy of (10-4) gr is available in the Faculty of Science Physics Department.
b) Small agate mortar.
c) High temperature thermal Oven (1200oC) with a Temperature Regulator.
Preparing the samples
The samples are prepared by the solid-state reaction method. Accordingly, the weights of the powders required for each sample are mixed and calculated using the molecular weight method in order to obtain the compounds required for the study where CaF2 1-x Sbx; (x=0.00-0.03). Then grinding these materials in the agate mortar perfectly well to make the mixture homogeneous and sifting it with a sieve of 90 μm(15\9\2022). Then it is put it in a container, and we add distilled water (about 1gr) to increase the mixing process and homogeneity of the powder. Then we put it on a heater for 3 hours at a temperature of 100oC and the mixing and homogeneity process of the powder occurs by stirring. After that, the powder is placed on a heater with direct contact with the air, then the water evaporates and then we perform a preliminary roasting process inside the oven (pre-sinter) to increase the degree of homogeneity of the mixture. We fix the oven temperature at 700°C for three hours, then we turn off the oven, which means to stop the roasting process and leave the sample inside the oven until it cools and reaches room temperature, thus we get rid of impurities that evaporate at high temperatures. Then we grind the powder resulting from the roasting process in its first stage. Then we perform the second roasting process where we fix the oven temperature at 100°C for an hour and then we raise the temperature 50°C every 15min until we reach the temperature of 700°C where we fix the oven temperature at it for 3 hours in order to get the crystal structure in its correct form.
Results and Discussion
Infrared spectroscopy
The IR spectrum of pure calcium fluoride and antimony doped calcium fluoride was measured using the spectrometer asco type FT / IR-460 plus available in the central laboratory of the Faculty of Science - aleppo University, working in the range [400-4000] Cm-1. Where the permeability T was measured by the frequency function υ, the absorbance A, the absorption coefficient α, the damping factor K, the refractive index n and optical conductivity σopt were calculated:
Permeability T: It is defined as the ratio between the intensity of the penetrating radiation to the intensity of the fallen radiation, it has been taken from the device itself and then by using the appropriate mathematical equations, other optical parameters have been calculated.
Absorbency A: is the ratio between the intensity of the absorbed radiation and the intensity of the fallen radiation, calculated from the equation [15]:
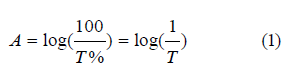
T represents Permeability.
Absorption coefficient α: defined as the ratio between the decrease in the flow of the fallen radiation energy to the unit of distance towards the spread of the fallen light wave within the field, and is calculated from the equation:
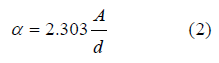
A represents absorbency, d = 1mm the thickness of the material
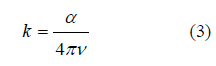
The damping factor k: is defined as the amount of energy absorbed by the electrons of the studied material from the energy of the radiation photons that fall on it, and is calculated from the equation [17]:
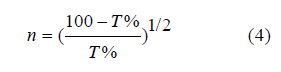
Refractive index n: which is the ratio between the speed of light in the vacuum to its speed in the field, and it is calculated from the equation [18]:
Optical length L: the inversion of the absorption coefficient [16]:
Optical conductivity σopt: optical conductivity is related to the refractive index and the damping factor according to the following equation [18]:
FTIR analysis of samples has been performed at room temperature within the range [400-4000] Cm-1. Some bundles appeared within this range, including the absorption bundle at the top corresponding to the number of vibratory frequency 1516.42 cm-1, 3442.13 cm-1 which belongs to the vibratory pattern of the hydroxyl group (vibration of hydroxyl group). This is due to the absorption of water vibration, the vibratory pattern also shows stretching and retraction (stretching vibrational mode) belonging to the O-H group [12]. The location of the absorbent bundles and peaks also depends on the crystalline structure of the material and its chemical composition, as well as on the morphology of the material [13]. Pure calcium fluoride is characterized by a set of vibrational frequencies within the range [400-4000] Cm-1 which is: (3444.52 – 1517.59 – 1138.40 – 876.40 – 639.93– 436.29) cm-1. antimony doped calcium fluoride by 3wt% is characterized by a set of vibrational frequencies within the range [400-4000] Cm-1 which is:
(3442.13– 1516.42– 1137.98– 876.24– 638.10– 430.68) cm-1
An absorbent value has been observed at about the frequency 1137.98 cm-1 belonging to the C-H group, and this could be due to adsorption and interaction between carbon dioxide atoms with water during the sintering process [14]. From the permeability spectrum by the frequency function indicated in figure 1, the physical quantities of pure calcium fluoride have been calculated, which are the absorbance, the absorption coefficient, the damping coefficient, the refractive index, the wavelength, the optical conductivity, which are shown in table 1.


The absorption coefficients variations are drawn by the function of the vibrational frequency of pure calcium fluoride and the antimony doped calcium fluoride as shown in figure 2 & table 2.
Figure 2 shows the change in the absorption coefficient of pure and antimony doped calcium fluoride, we note that the largest absorption coefficient value was (7.761cm-1) corresponding to the frequency (1517.59cm-1) cm-1 and the smallest absorption coefficient value was (2.441cm-1) corresponding to the frequency (639.93 cm-1) and the largest value of absorption coefficient to the Sb doped calcium fluoride was (14.577 cm-1) corresponding to the frequency (430.68 cm-1) and the smallest value of absorption coefficient was (2.233 cm-1) corresponding to the frequency (638.10 cm-1).


The optical conductivity variations are also drawn by the frequency function of pure calcium fluoride and the antimony doped calcium fluoride, as shown in figure 3.
Figure 3 shows the change in the conductivity of pure and antimony doped calcium fluoride, we note that the largest value of the conductivity was (0.022(Ωcm)-1) corresponding to the frequency (1517.59 cm-1) and the smallest value of conductivity was (0.003 (Ωcm)-1) corresponding to the frequency (639.93 cm-1), and the largest value of the conductivity to the Sb doped calcium fluoride was (0.070 (Ωcm)-1) corresponding to the frequency (430.68 cm-1) and the smallest value of conductivity was (0.002 (Ωcm)-1)) corresponding to the frequency (638.10 cm-1).


Figure 4 shows the change in the absorbance of pure and antimony doped calcium fluoride, we note that the largest absorbance value was (0.337) corresponding to the frequency (1517.59 cm-1) and the smallest value of absorption was (0.106) corresponding to the frequency (639.93 cm-1), and the largest value of absorbance corresponds to the Sb doped calcium fluoride was (0.633) corresponding to the frequency (430.68 cm-1) and the smallest value of absorbance was (0.097) corresponding to the frequency (638.10 cm-1) (Figures 5 & 6).


Conclusion
1.The pure calcium fluoride FTIR spectrum has shown some vibrational frequencies within the range [400-4000] Cm-1 which are:
1. (3444.52 – 1517.59 – 1138.40 – 876.40 – 639.93– 436.29) cm-1
2. The FTIR spectrum of the antimony doped calcium fluoride by 3wt% showed vibrational frequencies within the range [400-4000] Cm-1, the most notably are:
3. (3442.13– 1516.42– 1137.98– 876.24– 638.10– 430.68) cm-1
2. The absorbance value for the pure sample varies within the range [0.106 - 0.337], and for the doped sample, the absorbance value varies within the range [0.097 - 0.633].
3. The absorption coefficient value varies within the range of the pure sample [2.441 - 7.761] Cm-1
4. The value of the refractive index for the pure sample varies within the range [0.526 - 1.082].
5. The value of the optical length L concerning the pure sample varies in the range [0.128 - 0,409] cm, and for the doped sample the value of the optical length varies within the range [0.068 - 0.447] cm.
6. The optical conductivity value σopt for the pure sample varies within the range [0.003 - 0.022] (Ωcm)-1, for the doped sample the value of the optical conductivity varies in the range [0.002 – 0.070] (Ωcm)-1.
7. The largest values of absorbance, absorption coefficient, refractive index and optical length were greater in the antimony -doped sample by 3wt% for the vibrational frequency 430.68 cm-1.
8. The largest values of the absorbance, the refractive index, and the absorption coefficient were in the pure sample for the frequency 1517.59cm-1.
References
- Czaja M, Gajowska SB (2012) The luminescence properties of rare-earth ions in natural fluorite. Phys Chem Minerals 39: 639-648.
- Battikh AA (2014) Studying of the Europium ion Effect on the Luminescence Calcium Fluoride Crystal. Tishreen University Journal, p. 36.
- Nanto H, Nakagawa R (2015) Optically stimulated luminescence in Tm-doped calcium fluoride phosphor crystal for application to a novel passive type Dosimeter. Sensors and Materials 27(3): 277-282.
- Hahn D (2014) Calcium fluoride and barium fluoride crystals in optics. Optik & Photonik 9(4): 45-48.
- Elbatal FHA, Marzouk MA, Hamdy YM, ElBatal HA (2014) Optical and FT Infrared Absorption Spectra of 3d Transition Metal Ions Doped in NaF-CaF2-B2O3 Glass and Effects of Gamma Irradiation.
- Zheng W, Zhou S, Chen Z, Hu P, Liu Y, et al. (2013) Sub-10 nm Lanthanide Doped CaF2 Nanoprobes for Time Resolved Luminescent Biodetection 52(26): 6671-6676.
- Ravangave LS (2010) Effect of doping concentration of Eu3+ ion on CaF2 Digest Journal of Nanomaterials and Biostructures 7: 575-578.
- Kishi Y, Tanabe S, Tochino S, Pezzotti G (2005) Fabrication and Efficient Infrared to Visible Upconversion in Transparent Glass Ceramics of Er Yb Co Doped CaF2 Nano Crystal. Journal of the American Ceramic Society 88(12): 3423-3426.
- Wanga F, Fana X, Pi D, Wang M (2005) Synthesis and luminescence behavior of Eu3+ doped CaF2 Solid State Communications 133(12): 775-779.
- Hraiech S, Jouini A, Kim KJ, Guyot Y, Goutaudier C, et al. (2007) A Breakage of Yb3+ pairs by Na+ in Yb3+ doped CaF2 laser host. Ann Phys 32: 59-61.
- Rouessac F, Rouessac A (2004) Chemical Analysis Modern Instrumental Methods and Techniques. Dunod Paris.
- Faisal M, Harraz FA, Bouzid H, Ibrahim AA (2015) SnO2 doped ZnO nanostructures for highly efficient Films by photocatalyst. Journal of Molecular catalysis A: chemical 39: 9-25.
- Saleh SA, Ibrahim AA, Mohamed SH (2016) Structural and Optical Properties of Nanostructured Fe-Doped SnO2. Acta Physical Polonica A 129: 1220-1225.
- Gnanam S, Rajendran V (2010) Preparation of Cd-doped SnO2 nanoparticles by sol - gel route and their optical properties. Journal of Sol-Gel Science and Technology 56: 128-133.
- Sakni L (2017) Studying the structural of Fe doped tin oxide. Master thesis. Alwadi university.
- Aljawad S (2016) Studying effect of doping on the structural and optical properties of tin oxide thin films. Journal of engineering and technology, p. 34.
- Mansour M (2012) Studying the structural and optical properties of ZnO : Cu thin films by APCVD method, p. 5.
- Zaid A (2012) Studying the structural and optical properties of NiO thin films, Master thesis. Dyala university. Iraq.
- Faisal M, Ibrahim AA, Harraz FA, Bouzid H, Al Assiri MS, et al. (2015) SnO2 doped ZnO nanostructures for highly efficient photocatalyst. Journal of Molecular catalysis A: Chemical 39: 19-25.


