Abstract
Topographical measurements are essential for decision makers, restoration works, and evacuation and safety plans in disaster areas. This study is conducted by evaluating the damage to a disaster-affected area based on images measured by a high-resolution camera mounted on an Unmanned Aerial Vehicle (UAV) and converting them into a point cloud. Once the point cloud is available, it is classified into three classes: ground, buildings, and other objects. The ground class is used to calculate the Digital Surface Model (DSM), contour lines, in addition to the assessment of road damage. Whereas the building class is used to identify the damaged buildings. This data analysis allows the production of the most required topographical maps, which can be used for urgent decision-making tasks. The suggested approach not only provides speed in data acquisition but also damages assessment in war-affected areas, while also considering the safety aspect for people working within a disaster-affected area. In addition to the topographical measurements, the results provide the location of the damaged buildings and determine the extent of damage to the buildings and whether we can restore them, as well as planning and the estimated cost.
Keywords: Point cloud; Damaged building; Topographical measurements; Restoration works
Abbreviations: SAR: Synthetic Aperture Radar; UAV: Unmanned Aerial Vehicle; DSM: Digital Surface Model; GIS: Information Systems; RS: Remote Sensing; DLDE: Decision-Level Damage Estimation; LiDAR: Detection and Ranging; SVM: Support Vector Machine; VLS: Virtual Laser Scanning; DTM: Digital Terrain Model; PTDF: Progressive Triangular Density Filter; CNNs: Convolutional Neural Networks
Introduction
Disasters have been an integral part of human life since the dawn of human existence. However, over the years, new risks and threats have emerged, increasing the likelihood of new disasters and the resulting crises. War is one of the most destructive disasters, with its widespread impact on conflict zones causing significant economic and social damage, perhaps more devastating than any natural or man-made phenomenon [1]. In Syria, the war has affected the entire country intermittently since 2011, during the period of peaceful protests, and continued until 2024. The war has claimed the lives of more than 618,000 people, left thousands missing, and displaced millions, according to correspondents and news agencies. It has also left many areas devastated and inaccessible due to the remnants of war and the rugged terrain caused by bombing. The total area of the war zone in Syria, approximately 185,180 square kilometers, has also caused massive losses to infrastructure and crops [2]. Topographic measurements are one of the most important investigations in disaster areas, including war disasters, where slopes affect the surrounding land in terms of soil erosion, earthquakes, and buildings targeted by weapons because of war. Studies have shown that areas with slopes are more susceptible to destruction and building collapse than flat areas, as well as the presence of caves under cities or groundwater that affects buildings [3].
Automatic point cloud classification has become one of the most important research areas in various fields, particularly in topographic measurements and computer vision [4]. It has been widely used in various fields, including determining building heights, establishing level points, and creating plans or maps of the surveyed area [5]. From a computer vision perspective, it has also been used in autonomous driving, virtual reality, and robotics [6]. In the same context, several tools such as Synthetic Aperture Radar (SAR) can be used, which is an effective tool in disaster management as it can obtain images that are not affected by weather conditions, but requires high accuracy and is expensive to operate [7]. Drone images are also used to conduct field damage surveys and take topographic measurements [8]. Evaluating the three-dimensional surface topography is crucial in many cases where modern data collection tools are used [9]. Interferometric measuring devices are particularly important in this case, given the time required for measurement. Finally, it is important to note that the accuracy and comparability of the tools used must be evaluated with traditional measuring devices [10]. In this paper, a three-dimensional point cloud of the study area was used to analyze and map affected areas requiring immediate response [11]. In this context, the integration of information extracted through Geographic Information Systems (GIS) and Remote Sensing (RS) offers tremendous potential for identifying, monitoring, and assessing war disasters [12].
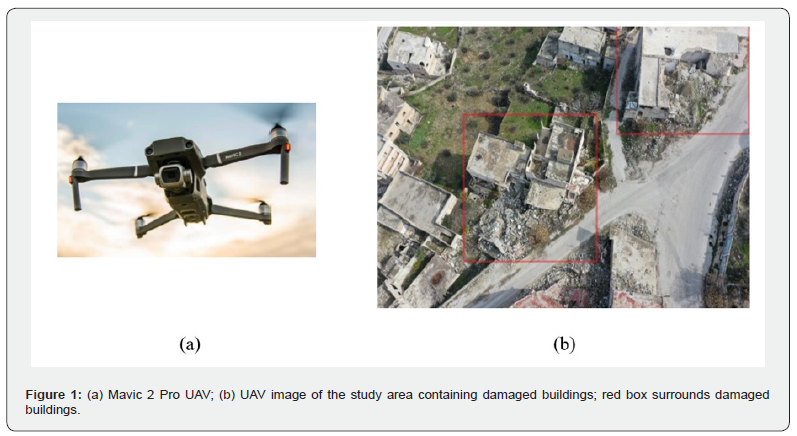
High-resolution UAV imagery, which has become available in recent years, has increased the usefulness of RS data in disaster management [13]. The damage status of individual buildings and infrastructure can be determined without having to visit disaster sites [12]. This facilitates and ensures work safety, especially in hazardous areas, given the difficulty of accessing war-prone areas [14]. A Mavic 2 Pro drone equipped with a high-resolution camera is used to monitor the study area, which also allows for analyzing the damage to individual buildings as well as the roads.
The novelty and the main contribution of this paper can be summarized as follows:
a. Building and road damage classification according to the ability of restoration.
b. Full series suggested algorithms to extract and classify damage within war-affected areas.
c. Testing different algorithms for data classification, DTM construction, and contour line drawing.
d. Safe topographical work assessment within disaster areas.
Related works
In the literature, numerous studies have been conducted on topics related to disaster management and damage assessment in disaster areas. Input data classification is an important procedure for assessing damaged buildings. The aerial images are considered as the main important input data; indeed, they are easily accessible, easy to use, and easy to process. Several studies have been discussed in this field, including a comparison between automatic detection methods for damaged buildings from remote sensing and satellite sensor images, along with manual damage identification using satellite imagery [15]. Satellite imagery from three satellites (Skysat, GE-1, and WV-3) was compared. The results confirm the ability to quickly identify damaged areas and achieve a rapid response to reduce losses and save lives [16]. A Decision-Level Damage Estimation (DLDE) method was suggested to create a building damage map using high-resolution satellite imagery and Light Detection and Ranging (LiDAR) data. This is done by analyzing texture in the first step, followed by using a Support Vector Machine (SVM) classification algorithm to extract damaged buildings. A damage score is then calculated based on LiDAR and satellite images for each building. These damage scores are combined to obtain the final damage score for the building [17]. The use of RS data for building damage assessment was also suggested, and a LiDAR-based aerial damage assessment methodology using a density-based algorithm was proposed. Results included the ability to identify building structures, extract damage characteristics, and determine the extent of damage to individual building properties [18].
Drone imagery was used widely to identify the damaged buildings in urban areas due to earthquakes through stages: one to distinguish buildings outside the urban context (urban classification), and the other to identify damaged structures (building classification) [19]. These approaches used elevation-based algorithms based on Digital Surface Model (DSM) [20]. This has proven effective in detecting both severe damage and completely collapsed buildings [19]. Nex et al. [21] also discussed the focus of most of its research on classifying buildings into general damage categories, with limited attention paid to classifying specific types of damage. In this context, MaskR-CNN and ResNet50 techniques are used to detect wall collapse damage in images by segmenting images captured by drones [21]. Moreover, mobile mapping images are employed to study the collapse of historic buildings resulting from natural and human-made disasters by the basis on image segmentation, which has been used to detect damaged buildings in the aftermath of disasters [22].
At this stage, it is important to note that LiDAR data was considered one of the important inputs to study damaged buildings. Damage severity assessment using digital images and laser scanner data is widely discussed in literature, e.g., determination of the damage to granite rocks. The obtained results show that the Fuzzy K-Means algorithm achieved a high-quality result [23]. Automated multi-class structural damage assessment of buildings was analyzed using a machine learning model trained on Virtual Laser Scanning (VLS) data, and a classifier was then used to assess building damage scores [24]. Indeed, disaster area data classification using machine learning represents a hot research spot [16]. Change attributes were determined for each object, and damaged and undamaged building parts were then identified using a clustering approach. Classifying damaged areas depending on the disaster type is also crucial, particularly for earthquake disasters. The evaluation of deep learning in an earthquake-affected area was tested through four network architectures: U-Net, LinkNet, FPN, and PSPNet. Various performance metrics were adopted, such as accuracy, precision, recall, F1 score, specificity, AUC, and IoU. The results indicated that FPN and U-Net were the high-performing models based on the desired performance metric. Concerning the hurricane disaster, it has been discussed how to improve the initial assessment of post-disaster damage using drone imagery after the hurricane and then applying artificial intelligence techniques to determine the initial assessment of Hurricane Dorian [25].
Datasets
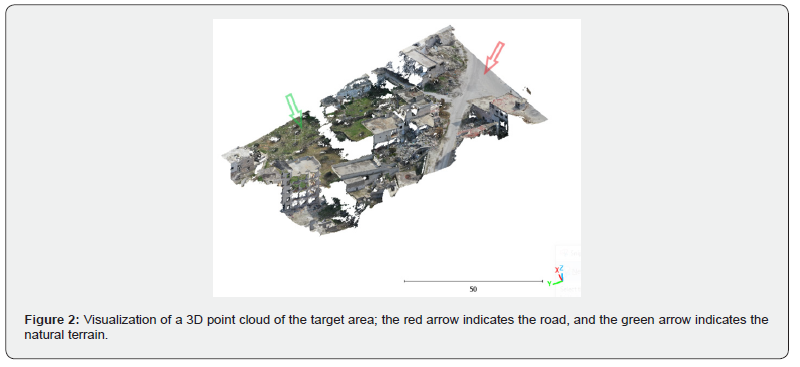
The data used in this paper are UAV images of Kafranbel town in the Idlib city countryside, taken using a Mavic 2 Pro drone to identify areas affected by the war. These images show the targeted area, a small part of the city of Kafranbel. The study area contains both intact and damaged buildings. The red box in Figure 1 shows damaged buildings. After capturing the UVA images, a 3D point cloud is calculated from them by considering a great overlap between neighboring images. For this purpose, Pixed 4d software is used, which can recognize the detected image order according to the fly strips. One of the limitations is the considerable calculation time cost, in addition to the need for a high-speed computer. Table 1 illustrates the characteristics of the measured 3D point cloud that covered the project area (Figure 2), which is calculated from UAV images using Pixed 4d software. Though the obtained point density is considerably high (350 points/m2), the point accuracy is still modest regarding the image resolution (1.58 cm/pixel) and the automatic matching errors. However, the accuracy can be estimated at ±60 cm. To improve this accuracy, UAV LiDAR scanning can be used instead of UAV images. The 3D point cloud of the study area (Figure 3) is of 206,1977 points, showing the area in detail, such as ground, streets, green areas, and intact and damaged buildings.

Methods
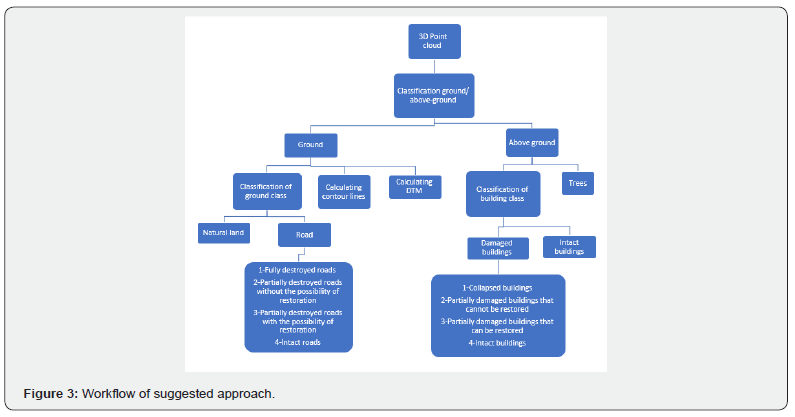
The schematic diagram presented in Figure 3 illustrates the suggested approach for extracting damaged buildings and roads, along with the analysis of the above-ground and ground classes. First, the point cloud is classified into two classes: ground and non-ground classes, where the ground class is required to recognize the road damages and then restore them. The ground class is also useful for monitoring infrastructure, sidewalks, and drawing contour lines. Finally, the ground class can be employed to model the terrain class in the project area. That is why the Digital Terrain Model (DTM) is calculated, which will be used later to calculate the contour lines model. Concerning the above-ground class, it is used to determine the intact and damaged buildings. Regarding the building viewpoint, the damaged area has been identified. Each processing step of the presented flowchart will be explained independently in the next sections.
Point cloud classification into ground and above-ground classes
We classify point clouds into two classes: ground and non-ground. Separating point clouds into ground and non-ground is important for creating a DTM. For this purpose, the Progressive Triangular Density Filter (PTDF) algorithm [24] is applied. Indeed, it relies on detailed initial terrain and fine-tuning of information; initial temporal DTMs of normal quality are obtained using the CS filter and PTD. This operation excels in accuracy as well as in practicality [24]. Moreover, an adaptive texture simulation filtering algorithm based on terrain roughness is applied to remove noisy points and then adjust the input data. Hence, the used algorithm can automatically classify the measured point cloud into ground and non-ground classes. At this stage, it is important to note that the terrain roughness should be adjusted [18]. A texture simulation filter (CSF) represents a tool for extracting ground points from 3D point clouds, where a DSM is directly generated from the point clouds [25]. In the same context, this procedure can be realized manually for the separation of the ground from the non-ground classes, but it is not preferable to use it due to the high calculation cost. On the other hand, this procedure can be realized to create ground truth data, which can help to estimate the classification accuracy (see Section 5). The point cloud in this paper was separated using the Cloudcompar software using the CSF Filter, which requires a small number of easy-to-set integers and logical parameters. The experimental results produce an average total error of 4.58% [26]. At this stage, it is noticed that the classification accuracy equals 97.4%, which is a good accuracy.
Calculation of DTM
A DTM is a digital model that provides topographic information about the ground surface, and it can be generated from aerial photography, satellite images, ground surveys, LiDAR data, and multi-data fusion. The accuracy of the produced DTM is affected by (1) the resolution and density of the original point cloud, (2) the performance of the ground point classification algorithm, and (3) the used interpolation algorithm [27].
Three methods, including autocorrelation-based algorithms, are used to determine the DTM by selecting different window orientations and contour lines for the sloped area, applying moving windows, and repeatedly extracting non-ground features. The results are validated by calculating skewness and kurtosis values. The results show that changing the window shape and orientation to long, narrow squares parallel to the ground contour lines, respectively, improves the classification results in sloped areas. Four parameters, namely window size, window shape, window orientation, and cell size, are experimentally selected to optimize the creation of the initial digital elevation model (DTM) [28].
In the same context, a deep learning-based method for extracting DTMs is applied using deep Convolutional Neural Networks (CNNs). For each point with a spatial context, neighboring points within the window are extracted and converted to an image [29]. The point classification can then be treated as an image classification. The point-to-image transformation is carefully designed by considering the elevation information in the neighborhood. This enables the deep CNN model to learn how a human operator recognizes a point as a ground feature, thus enabling us to extract DTM [30]. The third DSM construction algorithm is tested, which accurately extracts ground data from measured 3D point clouds and generates a DTM. This algorithm uses flat surface features and contacts with the local minimum points to improve ground point extraction [31]. To conclude, the visual comparison between the results of the last three illustrated algorithms shows a high similarity level between the obtained results, which is why any method of the last three tested ones can be applied to calculate the DTM.
Calculation of contour lines
Starting with the DTM model, contour lines of the project area are calculated. For this purpose, two approaches have been tested to calculate contour lines, including adaptive segmentation, data point reduction, and curve fitting, where the point cloud is segmented along the direction into multiple layers according to the Z coordinate values. The layers are then partitioned at the intermediate level to form two-dimensional points. These points are then used to generate a boundary curve. The advantage of this method is its simplicity and insensitivity to common small accuracy errors [32]. Also, a three-dimensional octree-based grid is applied to handle large amounts of unordered point clouds. This is achieved by iteratively segmenting cells using the normalized values of the points. This process extracts the edge neighbor points and then extracts the contour lines [33]. It is observed that the calculation cost is much better in the first approach, especially when the input data volume is considerable.
Road damage analysis
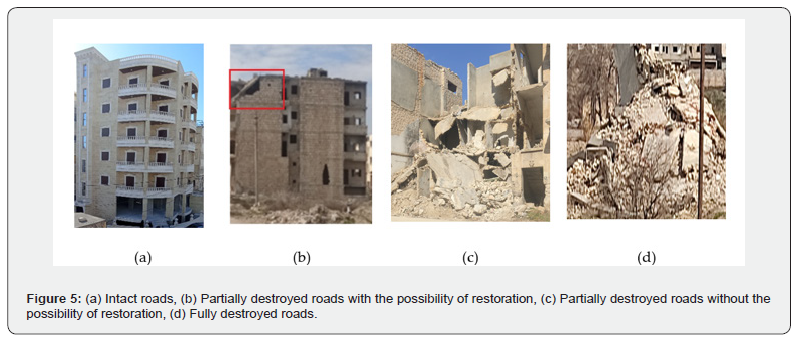
It is unavoidable to examine the roads in the area of the destroyed buildings to determine the usability of the road, whether the road has been damaged or not. The road type must also be determined, as it is expected to envisage a list of road kinds in the disaster area, such as highways, major public roads, inter-building roads, roads under construction, and agricultural roads. The restoration of each type of road varies according to the engineering instructions. The location of road damage can be determined using any type of RS data, such as aerial photographs, satellite images, and airborne point clouds [34]. In this paper, roads are manually classified using three-dimensional airborne point clouds. Ground class can be classified into two subcategories: roads and natural ground, as shown in Figure 2, where the red arrow indicates the road, and the green arrow indicates the natural terrain. Regarding the importance of roads for accessing the damaged area, the excavated roads are identified, their usability status is described, and the extent of the damage is determined. Roads are classified according to the level of damage into four categories: intact roads, partially destroyed roads with the possibility of restoration, partially destroyed roads without the possibility of restoration, and fully destroyed roads (Figure 4). In Future work, more investigations will target the roads subclass regarding its particular importance in the management of disaster areas. At this point, the extraction and analysis of road damage may be automated using machine learning and rule-based algorithms.
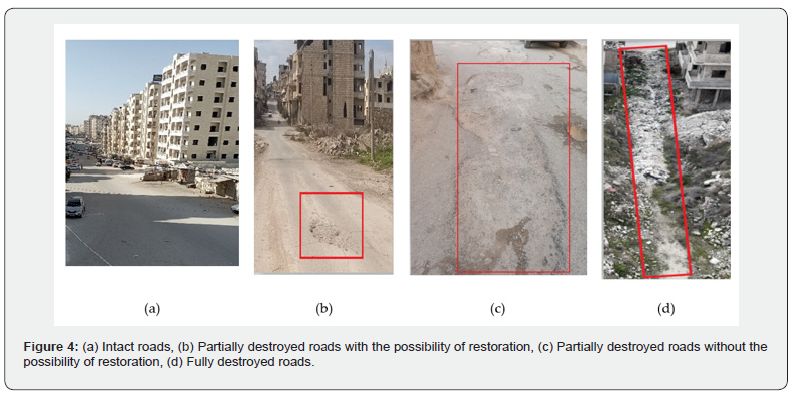
Once the roads subclass is segmented according to the damage state, safety plans can be developed to be able to access the disaster area to construct and/or restore the road network, and then start the other target operations, such as restoration projects. In addition, the extent of damage to green spaces is assessed, with existing damage determined based on the extent of the destruction of forests and agricultural land and whether it can be restored due to irreparable damage, such as chemical and radioactive materials. The presence of chemicals can cause significant damage to green areas, as well as fires and other causes. We haven't focused on this topic much on this paper because it merits being handled in future work.
The ability to restore the damaged buildings depends on three criteria:
a. The value of the building: Whether the building is historic, governmental, or a building that is difficult to remove, such as a dam or an ordinary building.
b. Restoration cost: If the cost of restoration is greater than the cost of demolition and reconstruction, the decision will be to rebuild it. If the cost of restoration is less, the building will be restored.
c. Restoration risk: If the restoration poses risks to workers and others, we determine the extent of the risk and carry out the restoration.
After identifying the damaged buildings manually, the percentage of damaged buildings regarding the total number of all buildings should be calculated to estimate the damage volume in the target area. Also, it is unavoidable to determine the value of damaged buildings and the timeframe for restoring them, and the kinds of damage according to the proposed building damage classification scale. In this paper, we will focus only on the detection of damaged buildings and the determination of the percentage of damaged buildings, and the other investigation will be processed and detailed in future work. Concerning the green areas, such as parks and forests, that may have been exposed to damage (such as fires, drought, cutting, or theft), but these are not discussed in this paper. We will discuss them in subsequent papers. In this paper, the damaged buildings were identified manually, which is why the accuracy is supposed to be 100%. However, the identification should be automatic, and we will do this automatically in future work.
Results and Accuracy Discussion
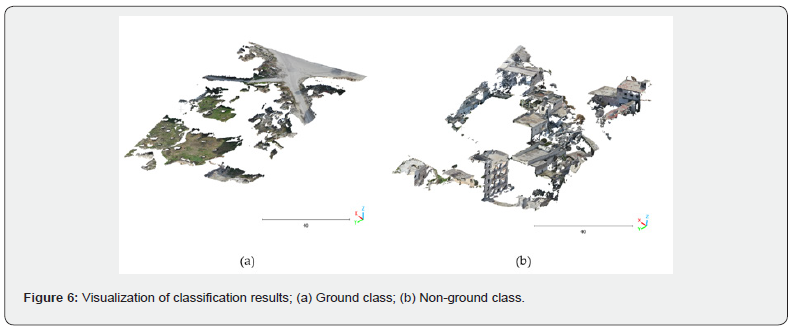
The input data is a 3D point cloud calculated from UVA images by considering a great overlap between them (Section 3). This point cloud covers an urban area that suffered from war damage. According to the suggested approach summarized in Figure 3, the first step of data processing is the classification of the 3D point cloud into two classes: ground and above-ground classes. Figure 6 shows the 3D visualization of the obtained result of the classification procedure. In Figure 6, it can be seen that the ground class represents the natural ground in addition to the roads, whereas the above ground class contains both intact and damaged buildings. Also, the trees in the aboveground class were eliminated because they are considered noise. This choice has been adopted regarding the research goal, which is the damage assessment in disaster areas.
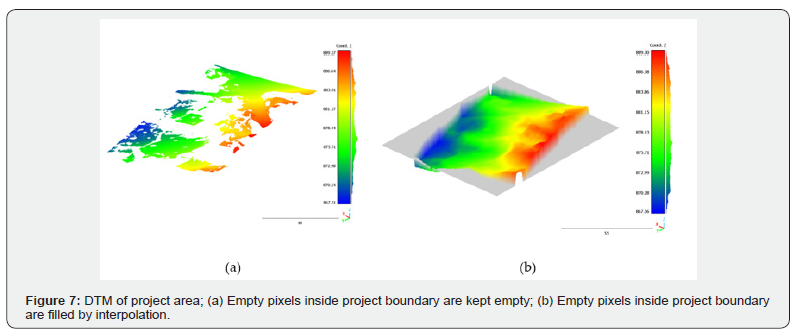
At this stage, it is important to assess the accuracy of the classification results. For this purpose, the confusion matrix is used [35,36]. In this context, only two classes will be considered: the ground class and the above-ground class. As manual classification (point per point) is supposed to have high accuracy [37], the reference model is manually calculated. Three errors can depict the classification result accuracy (Table 2). Error, I represent the rate of misclassified building pixels; Error II describes the rate of misclassified non-building pixels, and Total Error, which expresses the rate of misclassified pixels. In Table 2, it can be noted that the achieved classification has considerable accuracy values, which confirm the validity of classification results. Once the ground class is extracted from the point cloud, the next step is to calculate the DTM and the contour lines of the scanned area. Figure 7 shows the visualization of the DTM of the project area. The colors in this figure were calculated as a function of Z coordinate values. As illustrated in Figure 7a, there are a lot of ground missing points inside the boundary of the project area. This phenomenon can be explained by the presence of areas covered by buildings. To overcome this issue, the empty pixels inside the study area boundary can be calculated by interpolation as shown in Figure 7b.

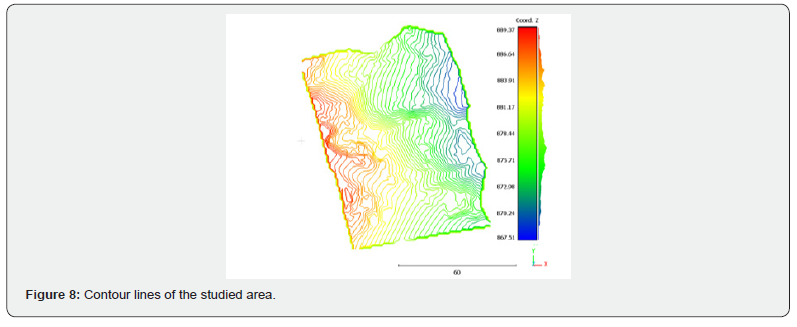
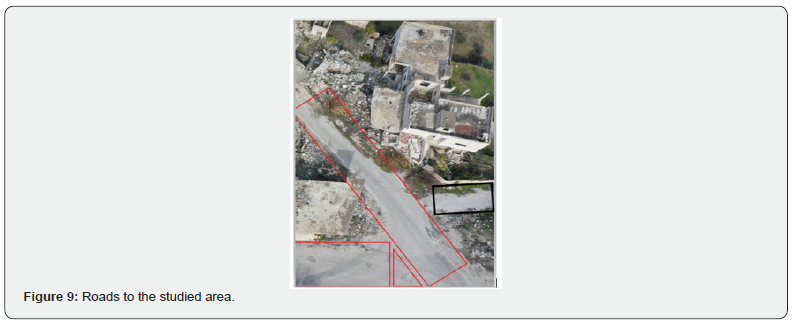
In the same context, the contoured lines of the scanned area are calculated as mentioned in Figure 8, where the step is considered equal to 0.5 m. It can be noted that the missing ground point areas are interpolated to calculate the contour lines for the complete scanned area. After classifying the point cloud into ground and above-ground areas, calculating the DTM model and contour lines, the road classification is extracted and classified into intact, partially damaged, or destroyed sections. In the studied area, there are three roads: two intact roads, shown in red, and one partially damaged road, which contains some rubble and some vegetation that has grown due to the lack of road maintenance (Figure 9).
Concerning the above-ground class, the vegetation is considered noisy points, as mentioned in Paragraph 1 of this section, which is why this class will only contain buildings. Thereafter, we identify the damaged buildings from the point cloud: where the buildings have been categorized into intact buildings, partially destroyed buildings that can be repaired, destroyed buildings that cannot be repaired, and rubble (there is no remaining building, but only hip of debris). The destroyed buildings were identified manually using aerial images and a 3D point cloud, and only two destroyed buildings were identified (marked in the red box) (Figures 10c & 11). Upon inspection, their classification was determined, and both buildings can be repaired (Rehor M et al. [12]). The first damaged building has suffered damage to its exterior and interior walls, as well as damage to the roof. The rest of the building is intact. This means we can restore the first damaged building by identifying the areas of damage and debris that need to be removed during the restoration and then proceed with the restoration.
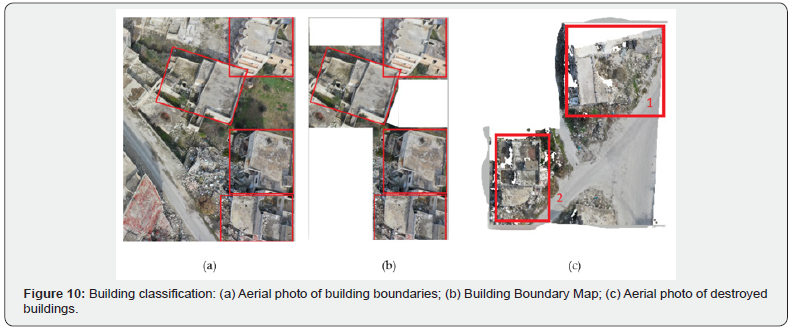
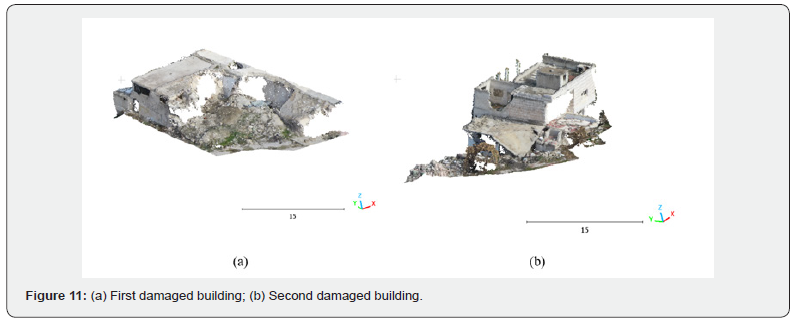
The damage to the second building is identified from the point cloud and aerial images manually. The adjacent store was fully destroyed, with damage to the second-floor ceiling and parts of its walls. The rest of the building remains intact. By analyzing the point cloud, we conclude that this building can be restored, as we can identify the areas of damage and debris that need to be removed during the restoration. It can be concluded that nine buildings are available in the study area (Figure 10), seven of which are in good condition and two of which are damaged. This results in a total building damage rate of 22.2%, a significant percentage in the targeted area. This percentage helps us determine the extent of damage in the city for restoration and reconstruction purposes and identify the most devastated areas.
Conclusion
For the most common terrain measurements, we adopted photogrammetry, which consists of images taken from a drone and analyzed using advanced software to produce a point cloud. These point clouds are then classified as the DTM as well as the contour lines model. Moreover, the destroyed buildings and roads are extracted respectively from the above-ground and ground classes and classified according to the possibility of restoration. This approach was developed to serve three goals: first, the targeted area is dangerous and could cause harm to people who intend to go inside it; second, the speed of issuing results and rapid response; and third, the study area dimensions could be considerable. The automation of all processing steps will be at the head of our priority in future work. Then, testing the suggested algorithm on different datasets of different areas and different sensors, such as LiDAR data, is inevitable. Finally, integrating machine learning algorithms may help to improve quality and accuracy.
References
- Quarantelli EL, Lagadec P, Boin A (2007) A heuristic approach to future disasters and crises: New, old, and in-between types. Handbook of Disaster Research, pp.16-41.
- Haq M, Akhtar M, Muhammad S, Paras S, Rahmatullah J (2012) Techniques of remote sensing and GIS for flood monitoring and damage assessment: a case study of Sindh province, Pakistan. The Egyptian Journal of Remote Sensing and Space Science 15(2): 135-141.
- Shabani M J, Mohammad S, Ali G (2021) Slope topography effect on the seismic response of mid-rise buildings considering topography-soil-structure interaction. Earthquakes Struct 20(2): 87-200.
- Tarsha Kurdi F, Rehor M, Landes T, Grussenmeyer P (2007) Extension of an automatic building extraction technique to airborne laser scanner data containing damaged buildings. ISPRS.
- Tarsha Kurdi F, Lewandowicz E, Gharineiat Z, Shan J (2025) High-Resolution Building Indicator Mapping Using Airborne LiDAR Data. Electronics 14(9): 1821.
- Zhang H, Wang C, Tian S, Lu B, Zhang L, et al. (2023) Deep learning-based 3D point cloud classification: A systematic survey and outlook. Displays 79: 102456.
- Danklmayer A, Doring BJ, Schwerdt M, Chandra M (2009) Assessment of atmospheric propagation effects in SAR images. IEEE Transactions on Geoscience and Remote Sensing 47(10): 3507-3518.
- Yamazaki F, Masashi M (2007) Remote sensing technologies in post-disaster damage assessment. Journal of Earthquake and Tsunami 1(3): 193-210.
- Gharineiat Z, Tarsha Kurdi F, Glenn C (2022) Review of automatic processing of topography and surface feature identification LiDAR data using machine learning techniques. Remote Sensing 14(19): 4685.
- Ohlsson R, Wihlborg A, Westberg H (2001) The accuracy of fast 3D topography measurements. International Journal of Machine Tools and Manufacture 41(13-14): 1899-1907.
- Chaoxian L, Haigang S, Lihong H (2020) Identification of building damage from UAV-based photogrammetric point clouds using supervoxel segmentation and latent Dirichlet allocation model. Sensors 20(22): 6499.
- Rehor M, Bähr HP, Tarsha Kurdi F, Landes T, Grussenmeyer P (2003) Contribution of two plane detection algorithms to recognition of intact and damaged buildings in lidar data. The Photogrammetric Record 23(124): 441-456.
- Amina K, Sumeet G, Sachin KG (2022) Emerging UAV technology for disaster detection, mitigation, response, and preparedness. Journal of Field Robotics 39(6): 905-955.
- Gochfeld M, Volz CD, Burger J, Jewett S, Powers CW, et al. (2006) Developing a health and safety plan for hazardous field work in remote areas. Journal of Occupational and Environmental Hygiene 3(12): 671-683.
- Chen SA, Escay A, Haberland C, Schneider T, Staneva V, et.al. (2018) Benchmark dataset for automatic damaged building detection from post-hurricane remotely sensed imagery. 1812.05581: 8.
- Linardos V, Drakaki M, Tzionas P, Karnavas YL (2022) Machine learning in disaster management: recent developments in methods and applications. Machine Learning and Knowledge Extraction 4(2): 446-473.
- Eslamizade F, Rastiveis H, Zahraee NK, Jouybari A, Shams A (2021) Decision-level fusion of satellite imagery and LiDAR data for post-earthquake damage map generation in Haiti. Arabian Journal of Geosciences 14(12): 1120.
- Zhou Z, Jie G, Xuan H (2019) Community-scale multi-level post-hurricane damage assessment of residential buildings using multi-temporal airborne LiDAR data. Automation in Construction 98: 30-45.
- Fernandez GJ, Norman K, Markus G (2015) UAV-based urban structural damage assessment using object-based image analysis and semantic reasoning. NHESS 15(6): 1087-1101.
- Guerin C, Renaud B, Marc PD (2014) Automatic detection of elevation changes by differential DSM analysis: Application to urban areas. IEEE Journal of Selected Topics in Applied Earth Observations and Remote Sensing 7(10): 4020-4037.
- Nex F, Rupnik E, Toschi I, Remondino F (2014) Automated processing of high-resolution airborne images for earthquake damage assessment. Int Arch Photogramm Remote Sens Spatial Inf Sci 40: 315-321.
- Kallas J, Napolitano R (2023) Automated large-scale damage detection on historic buildings in post-disaster areas using image segmentation. Int Arch Photogramm Remote Sens Spatial Inf Sci 48: 797-804.
- Hacıefendioğlu K, Başağa HB, Kahya V, Özgan K, Altunışık AC (2024) Automatic detection of collapsed buildings after the 6 February 2023 Türkiye earthquakes using post-disaster satellite images with deep learning-based semantic segmentation models. Buildings 14(3): 582.
- Zahs V, Anders K, Kohns J, Stark A, Höfle B (2023) Classification of structural building damage grades from multi-temporal photogrammetric point clouds using a machine learning model trained on virtual laser scanning data. International Journal of Applied Earth Observation and Geoinformation 122: 103406.
- Cai S, Zhang W, Liang X, Wan P, Qi J, et al. (2019) Filtering airborne LiDAR data through complementary cloth simulation and progressive TIN densification filters. Remote Sensing 11(9): 1037.
- Zhang W, Qi J, Wan P, Wang H, Xie D, et al. (2016) An easy-to-use airborne LiDAR data filtering method based on cloth simulation. Remote Sensing 8(6): 501.
- Huan N, Xiangguo L, Jixian Z (2017) Classification of ALS point cloud with improved point cloud segmentation and random forests. Remote Sensing 9(3): 288.
- Shirowzhan S, Samad MES (2019) Spatial analysis using temporal point clouds in advanced GIS: Methods for ground elevation extraction in slant areas and building classifications. International Journal of Geo-Information 8(3): 120.
- Dey EK, Tarsha Kurdi F, Awrangjeb M, Stantic B (2021) Effective selection of variable point neighborhood for feature point extraction from aerial building point cloud data. Remote Sensing 13(8): 1520.
- Xiangyun H, Yuan Y (2016) Deep-learning-based classification for DTM extraction from ALS point cloud. Remote Sensing 8(9): 730.
- Susaki J (2012) Adaptive slope filtering of airborne LiDAR data in urban areas for digital terrain model (DTM) generation. Remote Sensing 4(6): 1804-1819.
- Javidrad F, Pourmoayed AR (2011) Contour curve reconstruction from cloud data for rapid prototyping. Robotics and Computer-Integrated Manufacturing 27(2): 397-404.
- Woo H, Kang E, Wang S, Lee KH (2002) A new segmentation method for point cloud data. International Journal of Machine Tools and Manufacture 42(2): 167-178.
- Hrůza P, Mikita T, Tyagur N, Krejza Z, Cibulka M, et al. (2018) Detecting Forest Road wearing course damage using different methods of remote sensing. Remote Sensing 10(4): 492.
- Sithole G, George V (2003) Automatic structure detection in a point-cloud of an urban landscape. IEEE p. 5.
- Tarsha Kurdi F, Lewandowicz E, Gharineiat Z, Shan J (2025) High-Resolution Building Indicator Mapping Using Airborne LiDAR Data. Electronics 14(9): 1821.
- Tarsha Kurdi F, Mohammad, Awrangjeb (2020) Comparison of LiDAR building point cloud with reference model for deep comprehension of cloud structure. Canadian Journal of Remote Sensing 46(5): 603-621.


