Hydrological Characterization and Statistical Analysis of Groundwater Quality for the Ogallala Aquifer in the Permian Basin, Texas, USA
Derek Haskell1, Joonghyeok Heo1*, Joon Kyu Park2* and Chao Dong3
1Department of Geosciences, University of Texas - Permian Basin, US
2Department of Civil Engineering, Seoil University, Korea
3Department of Chemistry and Physics, University of Texas - Permian Basin, US
Submission: July 21, 2023; Published: August 09, 2023
*Corresponding author: Joonghyeok Heo, Department of Geosciences, University of Texas - Permian Basin, Odessa, TX 79762, USA, Email ID: heo_j@utpb.edu
Joon Kyu Park,, Department of Civil Engineering, Seoil University, 28 Yongmasan-ro 90-gil, Jungnang-gu, Seoul 02192, Korea, Email ID: jkpark@seoil.ac.kr
How to cite this article: Derek H, Joonghyeok H, Joon Kyu P, Chao D. Hydrological Characterization and Statistical Analysis of Groundwater Quality for the Ogallala Aquifer in the Permian Basin, Texas, USA. Int J Environ Sci Nat Res. 2023; 32(4): 556344. DOI 10.19080/IJESNR.2023.32.556344
Abstract
The objective of this research is to analyze the groundwater quality of the Ogallala Aquifer and assess the hydrological characteristics within the Southern High Plains region of the Permian Basin in West Texas, USA. Levels of arsenic, lithium, hardness, and total dissolved solids (TDS), provided from the Texas Water Development Board (TWDB), were evaluated through the years 1990-2016. A total of 133 wells were analyzed, varying from 4 wells in one county to 19 wells in another. Statistical mean, maximum and minimum values, and sample standard deviation were utilized to evaluate the data, its distribution, and propose trends. The average levels of the contaminants for each year available in every county were assessed to the respective maximum contaminant levels (MCL) or secondary MCL set by the Environmental Protection Agency (EPA). The study outlined the potential threats to human well-being that are associated with each contaminant. Available sources of each contaminant and their uses in everyday life were also discussed. This research provides important information on how oil and gas developments, agricultural practices, and other human activities impact groundwater quality and contributes on understanding the response to development in the Southern High Plains Region and Permian Basin.
Keywords: Ogallala aquifer; High plains aquifer; Groundwater quality; Depth; Permian basin; Texas
Introduction
Groundwater is an essential resource for all life on Earth. The Ogallala Aquifer is the largest freshwater aquifer in the US, so it is crucial that it is kept sustainable for life. The Permian Basin is well known throughout the world for producing oil and natural gas. It is one of the largest oil and gas producing regions in the United States, and it is responsible for a significant portion of the country’s energy production. With the presence of oil field activity in the Permian Basin, there is a growing concern regarding the potential contamination of the Ogallala Aquifer. Irrigation and the extensive utilization of fertilizers are prevalent methods in the High Plains. The water quality of the Ogallala aquifer is generally sufficient for irrigation needs, however it often falls short of meeting the drinking water standards set by the U.S. Environmental Protection Agency (EPA) for parameters such as total dissolved solids (TDS) [1]. The exploration for oil in the Permian Basin has been an ongoing venture for approximately a century. Unconventional drilling methods such as hydraulic fracturing, horizontal method, and other advanced technologies, have significantly augmented oil production [1,2].
There are numerous environmental challenges concerning the Permian Basin, especially when oil and gas development is so widespread [3,4]. The continuous rise in population and the expansion of agricultural activities pose significant concerns [5]. Certain contaminants can be naturally found in water bodies, but the primary contributors to water contamination are anthropogenic, such as agriculture and industrialization [4]. Agriculture serves as a vital economic pillar in the Southern High Plains region, playing a central role in its economy. Robertson & Sharp [6] showed research identifying synthetic and natural (manure-based) fertilizers as the leading anthropogenic factors responsible for groundwater contamination. The increasing popularity of synthetic fertilizers has been positioned since the 1950s, making them the favored option for agricultural fertilization. Commercial fertilizer uses significantly boosted until the 1980s, where it has fluctuated since then because of demand and supply [7-10].
The Ogallala aquifer (commonly recognized as the High Plains aquifer) is an unconfined aquifer that has seen radical changes in its properties because of agricultural uses [11]. Hornbeck & Keskin [3] mentioned that center pivot irrigation technology experienced substantial improvements through the 1950s. The extensive manufacturing and distribution of this emerging technology had a profound impact on groundwater withdrawal, leading to a five-fold increase in rates from 1949 to 1974. The USGS (United States Geological Survey) [12,13] measured water levels from predevelopment (approximately 1950) to 2015 based off 3,164 wells and reported the Ogallala Aquifer demonstrating an average declination of the water level of 234 feet throughout Texas. Since predevelopment to 2015, the saturated thickness dropped from 10 to more than 50 feet throughout Texas and saw an increase of 10 to more than 25 feet in Andrews, Howard, Dawson, and Lynn counties. There was also a decline in recoverable water of almost 160 feet in Texas [13]. The falls in water level and saturated thickness within Texas is very alarming and action to combat this is necessary. The population in the Permian Basin is gradually growing with 2,061,422 residents in 2018 [14]. The population grew 3.3% during 2013 - 2018 and another 2.3% increase is expected by 2023.
In recent years, hydraulic fracturing has emerged as a valuable method for extracting oil and gas from reservoir rocks characterized by exceptionally low permeability and porosity [15-17]. Hydraulic fracturing, or fracking, is the method of injecting a fluid blend, predominantly comprising water, sand, and chemicals, into reservoir rocks that exhibit minimal porosity and permeability, with the purpose of generating fractures [18,19]. Jasechko & Perrone [20] demonstrated how hydraulic fracturing wells, in a proximity of 3 kilometers of wells can influence water contamination. It was also demonstrated that conventional oil and gas wells were in a proximity of approximately 2 kilometers to groundwater wells and posed a risk of contaminating water. Oil refineries, such as the facility located in Howard County, Texas, specifically in Big Spring, pose risks not only to water quality but also to air and soil. These refineries are a notable source of the emission of harmful substances, including BTEX (benzene, toluene, ethylbenzene, and xylene) [21]. Water discharge from these refineries is under strict regulations from Clean Water Act (CWA) with Safe Water Drinking Act (SWDA); however, pollution from previous discharge can stay in water bodies [20,21].
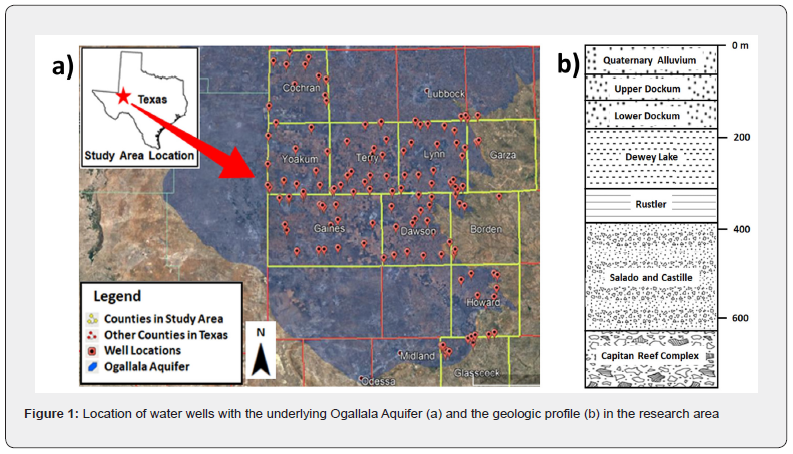
Considering the aforementioned concerns and factual data, the primary objective of this research was to analyze the groundwater quality for the Ogallala Aquifer in the study area: Cochran, Yoakum, Terry, Lynn, Garza, Gaines, Dawson, Borden, Howard, and Glasscock counties (Figure 1). Given the significant role that the petroleum and agriculture industries play in the regional economy, coupled with the essentiality of groundwater resources, it is imperative to ascertain the quality of groundwater in this area. The contaminants of arsenic, lithium, hardness, and TDS were estimated from 1990 to 2016 to evaluate if drinking water was safe to consume for the populations of their respective counties. Based on this dataset, an assessment was conducted to evaluate the influence of energy development and agricultural practices on groundwater resources in the research area. The study offers crucial information for the management of groundwater resources and contributes on understanding groundwater’s response to oil/gas and agriculture activities in the Permian Basin, Texas.
Study Area
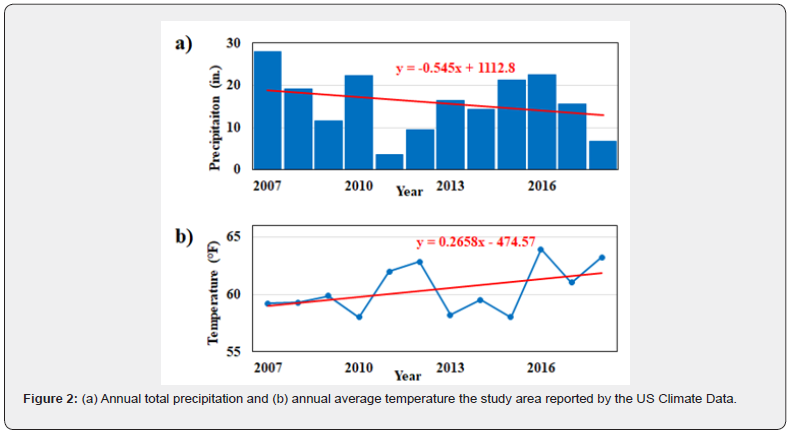
The study area consists of the southernmost portion of the Ogallala located in the Permian Basin, Texas, US (Figure 1). The study area is predominantly characterized by a rural setting with a relatively low population density. Although the population is increasing as a whole in the Permian Basin, the counties in the study area are experiencing varying changes. From 2010 to 2019, Yoakum, Gaines, Lynn, Glasscock, Borden, and Howard counties are increasing by a range of 0.6% to 22.6%. The counties of Cochran, Garza, Dawson, and Terry have experienced a decrease in population by a range of 2.5% to 8.8% from 2010 to 2019 [22,23]. In order to get a clearer understanding of the climatic change, information from the US Climate Data was utilized that displayed changes in total precipitation and average temperature from 2007-2018 in Lamesa, TX, in Dawson County [24-26]. Precipitation has been trending in the downward direction in the 2007-2018 timeframe while the linear regression line for temperature has been increasing Figure 2.
The study area experienced Ogallala sediment deposits during the Tertiary Period from the erosion of the southern Rocky Mountains and continuous tectonic activity occurring into the late Tertiary [25,26]. The Ogallala was deposited as an alluvial outwash with the thickest sediments being closest to the Rocky Mountains and get finer further from them. The sediments in the aquifer consist of fluvial sand, gravel, clay, and silt, and eolian sand and silt. The same time as the Ogallala was being deposited in the Tertiary, the Permian sediments experienced significant dissolution, mostly in the northern part of the Southern High Plains compared to the southern portion. Groundwater encountered these Permian sediments, which dissolved and caused the formations to collapse that led to substantial deposition of the Ogallala [26]. These collapsed basins are some of the thickest regions of the Ogallala and are one of the reasons why it has high variation in thickness.
The recharge is not uniform in Texas and is separated into two regions. The southern portion of the Ogallala in Texas is mainly impacted by agricultural development with recharge ranging from 0.007 to 3 inches per year. Recharge in the northern portion of the Ogallala in Texas is limited mainly due to the clayey soil, with a recharge rate ranging from 0.1 to 0.8 inches per year [25].
However, both regions are primarily recharged by precipitation, playas, headwater creeks, and return flow from irrigation. The primary utilization of groundwater within the Ogallala Aquifer is driven by agriculture, with agriculture claiming approximately 95% of the total groundwater consumption [27]. The remaining 5% of groundwater usage is distributed among diverse sectors, including livestock production, oil and gas production, manufacturing, and wholesale and retail trade.
Data and Methodology
The data for groundwater quality was collected for all 10 counties through the TWDB in the water quality by county database. The data was put into Microsoft Excel where it was manipulated in order to be utilized to create graphs and tables. A total of 133 wells were analyzed, with the minimum number of wells being 4 which resided in Garza County and the maximum being 19 which resided in both Gaines and Lynn Counties. Table 1 was created showing wells with the most recent data, starting from the 1990s to 2016. The selection of years in this study was determined by the availability of data, with most data being given every 4 years, but some was also available in between too. This timeline would also present the recent trends of groundwater quality and whether this is due to natural causes or anthropogenic processes, such as hydraulic fracturing, which became increasingly dominant around 2010. Lithium was the only contaminant where the data began in 1996 because that is when the TWDB first begun to provide that information. Averages for the contamination levels of arsenic, lithium, hardness, and TDS were calculated and analyzed in each of their respective counties.

The maximum contaminant level (MCL) and secondary MCL were provided from the Environmental Protection Agency (EPA) due to the Safe Water Drinking Act (SWDA) being constructed in 1974. The average values of each parameter were evaluated to determine the changes in groundwater levels over time, in comparison to their respective maximum contaminant level (MCL) or secondary MCL. Water level depths were provided from the TWDB and were graphed with a linear regression line, making it possible to show the trend from 1990-2020. Groundwater quality from latest data of each contaminant and the depth of the well from which the reading was taken was plotted together with a linear regression line. The direction of the linear regression line would determine whether the contamination was coming from natural causes or anthropogenic processes. Interpretations were made to determine the reason as to why some parameters were experiencing values greater than their respective MCLs.
Results and Discussion
Arsenic is an inorganic, naturally occurring, toxic contaminant which can be found throughout the environment. This element is a metalloid with an atomic number of 33 and an atomic mass of 74.92 grams per mole (g/mol). Its density is 5.72 grams per cubic centimeter (g/cm3), making it denser than water which is 1g/ cm3. This contaminant occurs in four different oxidation states: -3, 0, +3, and +5. The EPA set the MCL for arsenic to 10 micrograms per liter (ug/L) [28-31]. The effects of arsenic can vary in each individual due to genetics, metabolism, diet, health status, sex, and others [28]. The effects arsenic can have on oneself due to intake or increased exposure has been studied in different parts of the world, specifically in Asia and South America. These effects included skin cancer, when groundwater that contained arsenic was greater than 100ug/L, and dermatosis, when arsenic levels were greater than 200ug/L [29]. Although arsenic is very toxic, it has important uses in the creation of ammunition, car batteries, special types of glass, and wood preservation. It is also used extensively as a dopant to silicon to utilize its semi conductive properties [30].
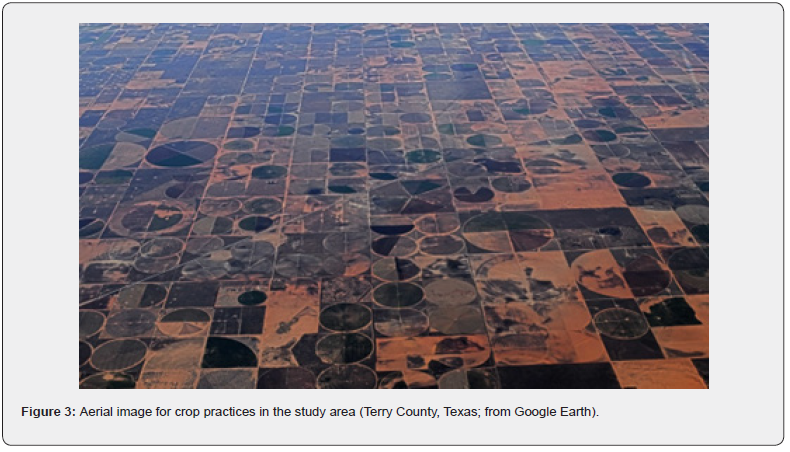
The Ogallala Aquifer in Texas shows exceeded levels of the MCL for arsenic, primarily in the study area [31-33]. One reason as to why the Ogallala has high levels of arsenic in this region is because the average thickness of the formation is thin and does not have a lot of area to dilute the contaminant [32]. Another reason could be from the influence of the Dockum Aquifer that underlies the Ogallala. According to Hudak [33], anthropogenic factors are the main causes for arsenic contamination as the concentrations were greater in the shallow Ogallala wells than the deeper Dockum wells. Most of the study area is dominated by agriculture, so pesticides and insecticides which contain arsenic could be a large source for contamination (Figure 3). This does not mean there is no sort of influence from the Dockum Aquifer regarding arsenic, but it does conclude that it is not the main source for arsenic contamination [31,33].
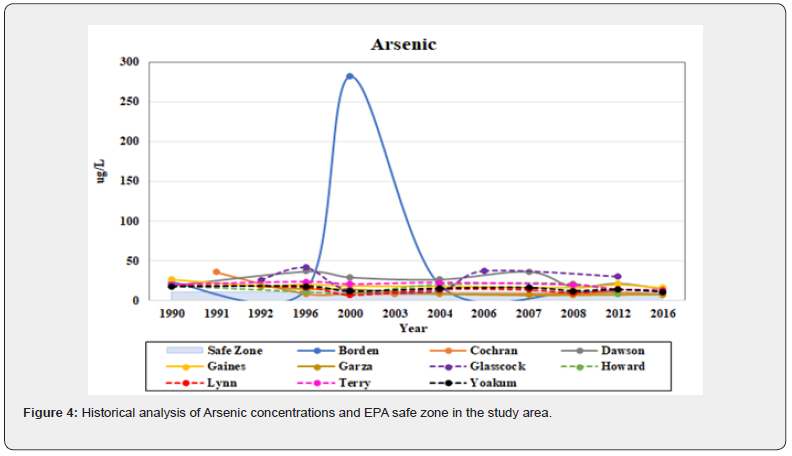
Most counties in this study exceeded their arsenic MCL. Cochran and Garza were the only counties that did not exceed their MCL for an extended period in recent years. Borden County had one substantial spike in arsenic of 281ug/L in 2000, which could be most likely due to precipitation. Contaminants can accumulate on the surface or subsurface and if there is a substantial amount of precipitation, a mechanism is provided for that accumulation to penetrate the groundwater. Howard and Yoakum counties did not exceed their MCL in the final year of data that was present of 8.5ug/L and 9.472ug/L, respectively. These high levels of arsenic can have detrimental impacts, especially for cities in Glasscock and Dawson Counties, as they had the highest values of arsenic in the study. The counties of Garza, Yoakum, Howard, and Cochran fell in the safe zone at least by 2012 and 2016, while the rest of the counties were over the MCL for every year or most (Figure 4).
Lithium
Lithium is a naturally occurring, alkali metal that is found in mineral and sea water, the tissues of animals, and constitutes about 0.0017% of the Earth’s crust [34,35]. There is currently no MCL or secondary MCL in drinking water set by the EPA for lithium. This element has an atomic number 3 and a molecular weight of 6.941g/mol. Lithium has a density of 0.534g/cm3, making it less than water. When lithium is found in the Earth, it is typically found in pegmatites [36]. Lithium can be found in 145 different minerals, but it is obtained from only 5 minerals: lepidolite, spodumene, amblygonite, petalite, and eucryptite, with spodumene being the most common. Lithium can also be found in evaporite, geothermal waters, and natural brines. These natural brine lakes can be found in high concentrations in some South American countries and in low concentrations in the United States and Tibetan Plateau [35]. Human organ tissues like the liver and the uterus contain trace amounts of lithium, as well as erythrocytes.
It is used in many manmade products such as ceramics, desiccants, grease, electronics, and batteries for electric vehicles, laptops, and phones [37,38]. Rubber, pharmaceuticals, primary aluminum production, and continuous casting are other products that require lithium. USGS [38] also states that 40% of lithium is used as lithium carbonate to create primary aluminum production, continuous casting, ceramics, glass, and batteries. The demand for lithium has increased 77% from 2009 to 2011 and will keep increasing with electric cars and mobile devices continuing to be more popular commodities.
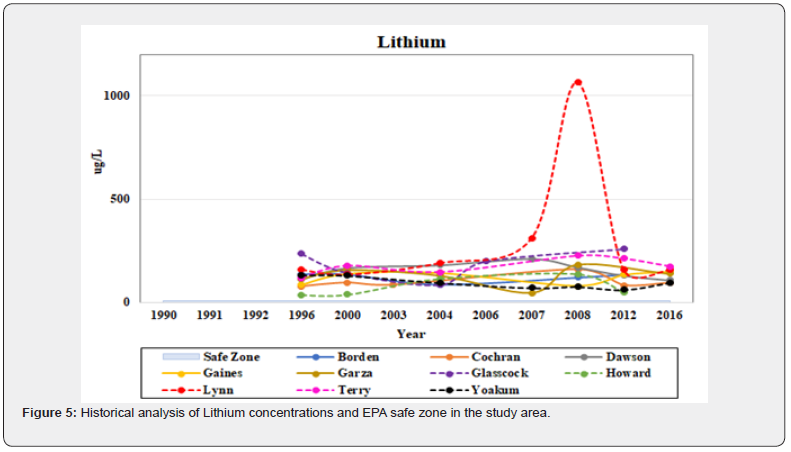
A high intake in lithium can have adverse effects to the physiological properties of animals. According to previous research by Adeel et al. [36] conducted in the study area, most of the wells sampled had lithium concentrations of 54μg/l, with the rest being between 6 and 54μg/l. Previous research showed Lithium concentrations in the Ogallala Aquifer [34-38]. These concentrations tended to be greater in the Southern High Plains than the Northern High Plains, with the exceptions of the cities Lubbock and Amarillo, Texas. Moran et al. [37] also observed how higher populated areas near Seoul, South Korea had higher lithium concentrations than less populated areas, suggesting anthropogenic sources are the cause for these high concentrations. Although there is no MCL or secondary MCL set by the EPA for lithium, the levels ranged from approximately 40 to 260ug/L in 2012 and 90 to 200ug/L in 2016 (Figure 5).
Hardness
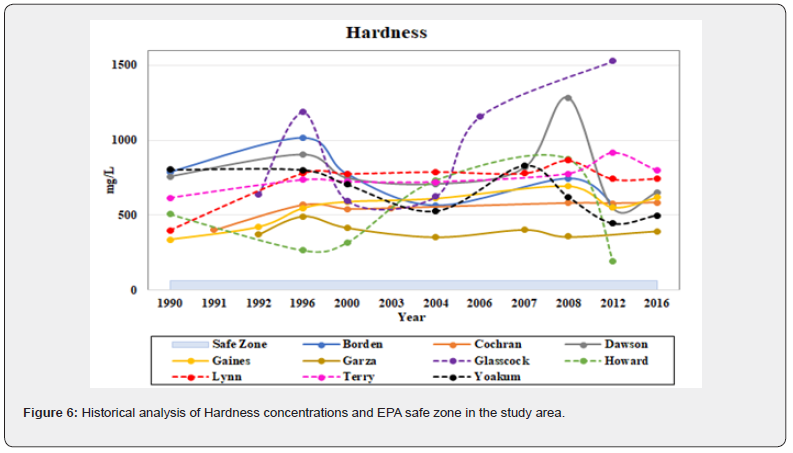
There are mainly two dissolved cations that constitute to the hardness of groundwater, calcium (+2) and magnesium (+2), although other metals like aluminum, iron, and manganese contribute to the hardness as well. No MCL or secondary MCL exists for hardness. There are 4 general classifications of the levels of hardness, these consist of 0-60mg/l (soft water), 61-120mg/l (moderately hard), 121-180mg/l (hard), and anything over 181mg/l is considered very hard. Water becomes hard generally from dissolved ions from sedimentary rocks, like limestone and chalk, and seepage and runoff from soils [39,40]. High levels of hardness can cause health problems, but so can extremely low levels, as one would not be receiving adequate amounts of calcium and magnesium, which are essential for human life. Carbonate aquifers, which contain limestone and dolomite, are filled with calcium and magnesium that can influence hardness levels. The Edwards-Trinity (Plateau) aquifer underlies the Ogallala in portions of the study area and is hydraulically connected with each other. Appleyard et al. [40] also states how the hydraulic head of the Edwards-Trinity Aquifer is greater than the Ogallala’s, causing upward migration of saline water. Some of the consequences of hard water result in scale deposits, staining of home appliances, bad taste & odor, cloudiness or discoloration, low pH, and corrosion in pipes [38,39]. More soap and detergents are required to clean dishes and laundry when using hard water.
The health effects that occur from drinking water with a high hardness are mainly due to the dissolution of salts in the water, primarily calcium and magnesium. Heo et al. [41] conducted a study which demonstrated Alzheimer’s disease being a potential effect from high hardness. Aluminum is often present in water with high hardness and the risk of Alzheimer’s was 1.5 times greater in areas when concentrations were greater than 0.11mg/L compared to other areas with 0.01mg/L [40]. Eczema is a skin disease that is believed to result partially from hard water, although there are other extenuating circumstances that control this condition as well. With that said, Howell [39] showed that eczema was more frequent among people in areas with high hard water than areas with softer water. Kidney stones consist of calcium, but there is a weak association between that and hard water as there are many other factors associated with kidney stones.
USGS [38] conducted a study for the state of Texas showing hardness of groundwater. The northeast portion of Texas had the lowest values of water hardness while the Southern High Plains and Permian Basin had the highest values. The southern portion of the Ogallala Aquifer fell victim to these high values of water hardness, along with the Pecos Valley Aquifer. Figure 6 represents the hardness where all counties exceeded the limit of 60mg/L, which would categorize the water being “soft water”. All hardness concentrations for every county exceeded the 181mg/L threshold, making the groundwater very hard.
Total dissolved solids (TDS)
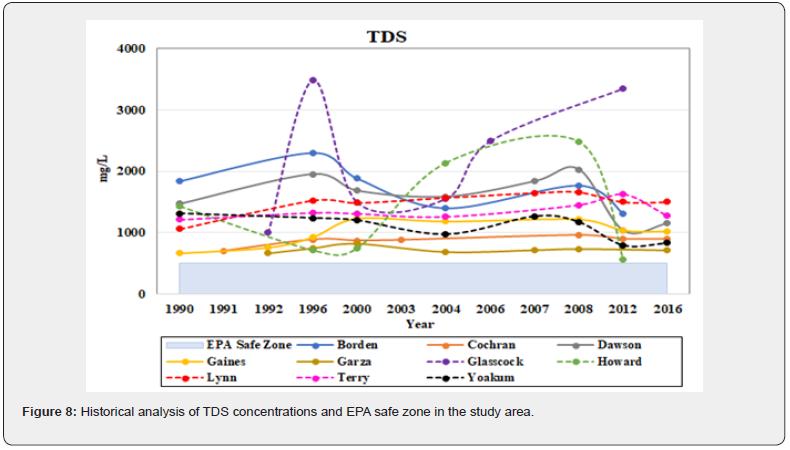
Total Dissolved Solid (TDS) is used to indicate the salinity of water, but it is also a measure of the overall quality of water. The secondary MCL for TDS is 500mg/l [42,43]. If the groundwater has a concentration above this secondary MCL, one can expect a higher hardness, colored water, staining, and a salty taste. Freshwater has a TDS concentration range from 0-1,000mg/l, this would include rainwater, surface water, and diluted groundwater. When TDS concentrations range from 1,000-10,000mg/l, it is categorized as brackish water, which includes groundwater and coastal marshes. TDS concentrations that range from 10,000- 100,000mg/l is considered saline water, which includes sea water and groundwater. Anything over 100,000mg/l is considered brine water, which is observed in deep basin brines and saline lakes. Potential sources that directly impact TDS concentrations include industrial discharges, sewage, fertilizers, road runoff, and soil erosion [44,45]. Not only is it pivotal to stray away from substantially elevated TDS concentrations but it is also desirable to not have excessively low concentrations, as it will not contain the desired amount of necessary nutrients.
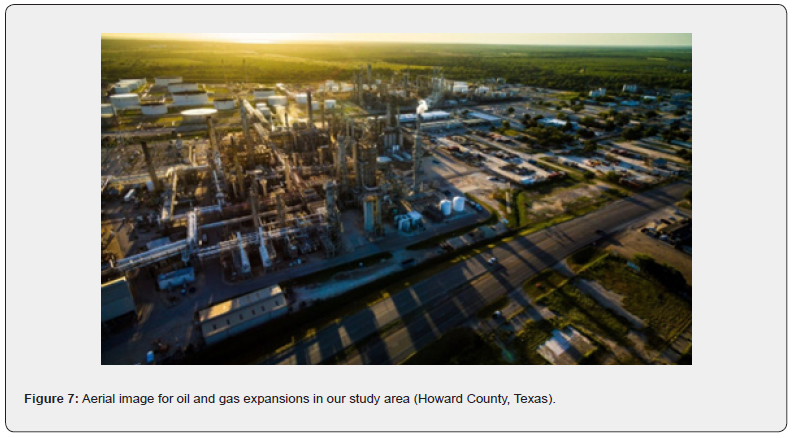
According to Chaudhuri & Ale [46], elevated total dissolved solids (TDS) concentrations in the research area can be attributed to factors such as the application of mineral fertilizers and the presence of bedrock units like the Dockum Aquifer and Permian evaporites. The Dockum Aquifer exhibits a wide range of TDS concentrations, varying from 1 to 35,000mg/l within the study area. Mehta et al. [44] suggests that other possible sources of salinity include brine pits from old oil and gas wells, and the upward movement of oil and gas from wells that were not properly plugged (Figure 7). The rise in solute levels in shallow groundwater can be attributed to evaporation, with the occasional flushing of salts by irrigation water playing a significant role in elevating salt concentrations as one of the primary mechanisms [45,46]. The Southern High Plains raises greater concerns compared to the Northern High Plains since a significant majority (84%) of the recorded observations surpassed the brackish water threshold of 10,000mg/L. The Northern High Plains generally had TDS concentrations of less than 400mg/l, but a saline plume is present along the northeastern margin of the Southern High Plains, which could cause salt concentrations to rise in the surrounding area. It was also noticed that the quality of groundwater declined in shallower observations as opposed to deeper ones, indicating that the primary origin of contamination is predominantly from the surface rather than from deep within the subsurface. A secondary MCL of 500mg/L was established for TDS, and none of the counties succeeded in meeting this threshold. (Figure 8).
Groundwater parameter and depth correlations
Higher concentrations of contamination were observed closer towards the surface for the parameters of arsenic, lithium, hardness, and TDS. Many studies confirmed that these higher concentrations at shallower depths are the result of contamination by natural and anthropogenic sources occurring at the surface [15,39,46]. Irrigation, fertilizers, and oil field brines are the main culprits of anthropogenic processes that cause such contamination from the surface [47]. This does not mean there is no influence from underlying geologic formations. For example, the Permian evaporites are a source of influence as upward hydraulic gradients are intensified due to pumping of the Ogallala, which brings solutes from these underlying formations and mixes with the Ogallala [15,39]. Hardness tends to be greater when there is a hydraulic connection between a carbonate aquifer and another, like the Edwards-Trinity (Plateau) and Ogallala Aquifers for example. pH levels can be influenced from both surface and deep sources of contamination. Anthropogenic sources such as mine wastes, power plants, industrial effluents, etc. are potential sources that influence pH levels from or near the surface. Geologic units that have basic properties and are hydraulically connected to an aquifer is a potential source that influences pH levels from deep in the subsurface [42]. Lithium concentrations tended to be greater in the Southern High Plains but also near largely populated cities such as Amarillo and Lubbock, Texas. Lithium might not only be influenced from natural sources like pegmatites or brine lakes that can occur deep in the subsurface but also anthropogenic sources that occur at the shallow sections.
In the research area, located in the Southern High Plains, the well depths tend to be shallower because the Ogallala gets thinner towards the south. The Northern High Plains have deeper wells due to the increase in Ogallala thickness. Water quality tends to diminish in the Southern High Plains compared to the Northern High Plains [33]. A study conducted by US DOE [47] measured the depth of 597 wells, with the minimum being 30 feet, the maximum being 900 feet, and a median depth of 280 feet. Most wells in the Southern High Plains were categorized in the 30-200 feet range with some being 201-400 feet deep. All the well depths that ranged from 401-900 feet were north of the study area.
In order to understand the change in water levels occurring in the study area, relationships between water level and time were displayed. The data for the water depths ranged from 1990 to 2019 or 2020, depending on data availability, for all counties in the study area. All water levels are demonstrated by the blue line with the black line representing the trend. Every county displayed a decreasing trend, with Borden and Garza Counties having the shallowest and Gaines County being the steepest. This downward trend suggests the discharge rate is greater than the recharge rate.
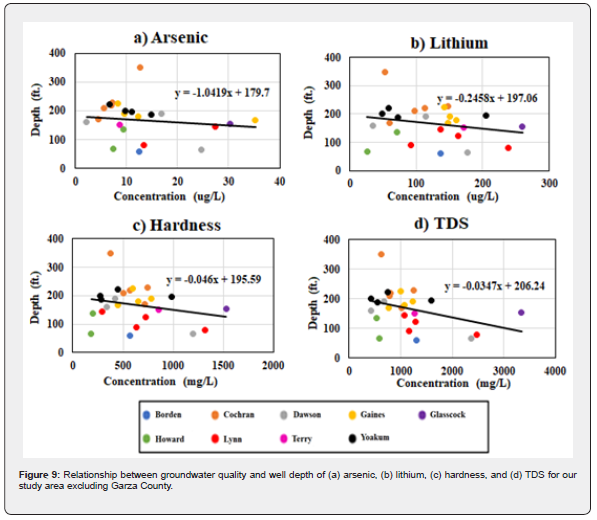
To gain a better understanding of the relationship between depth and groundwater quality, the correlations between these two parameters were graphed to investigate whether the source of contamination originated from surface sources or underlying geological formations. The data from 2016 for each county, except for Glasscock, Borden, and Howard Counties as the latest data were from 2012, were used because it was the latest data available. Garza County was not able to be used for this portion of the study because of no known depth for the wells that had data in 2016. Groundwater contamination should be worse in shallower wells compared to deeper wells because of human impact that occurs at the surface [15]. To strengthen this argument, a linear regression line was determined and depicted on a graph to investigate the extent to which the data in this study exhibited conformity to the claim. The collected data in the study demonstrates a decreasing linear regression pattern for all parameters. This finding strongly suggests that the contamination source is predominantly from the surface rather than the underlying formations (Figure 9).
Conclusion
This study evaluated the groundwater quality of Cochran, Yoakum, Terry, Lynn, Garza, Gaines, Dawson, Borden, Howard, and Glasscock counties from approximately 1990 to 2016. All counties faced high concentrations of groundwater pollution for most parameters where the majority of counties fell within the MCL set for the specific contaminants. Based on the standards defined by the EPA, water would be considered overall unsafe to drink in the majority of counties, without any filtering method, when examining the most recent year of data for each county. Human activities can be attributed as the main contributors to the elevated levels of groundwater contamination, with a moderate to substantial level of responsibility. This does not rule out the fact that there are some naturally occurring reasons as to why there are elevated levels of groundwater contamination.
Statistical methods were proven useful in evaluating datasets with information of different sizes. Borden, Dawson, and Glasscock counties faced the greatest amounts of groundwater pollutants. The importance of this study lies in its focus on the increased concentrations of groundwater contamination in the Permian Basin and Southern High Plains region. Historical data in each county shows how groundwater contamination has changed over time and suggests why some years had higher concentrations than others. This research focuses on anthropogenic and naturally occurring sources for each of the parameters, whether it be oil/ gas activity, agricultural practices, or underlying bedrock that is hydraulically connected to the Ogallala, for example. In order to increase the efficacy of this study, continued research in the study area and further up-to-date data would present more accurate trends of how groundwater quality is responding with increasing development.
Author Contribution
D.H. collected detailed information on the climate and water, calculated the environmental changes, and analyzed the results with the conclusions. J.H. designed the project, developed the discussion, and contributed to the overall paper. All authors have read and agreed to the published version of the manuscript.
References
- US EPA (United States Environmental Protection Agency) (2020) National Primary Drinking Water Regulations; US EPA: Washington, DC, USA, 2020.
- Mobley CA, Ging PB (2022) Depth to water and water quality in groundwater wells in the Ogallala aquifer within the north Plains groundwater conservation district, Texas panhandle, 2019-20, and comparison to 2012-13 conditions. Scientific Investigations Report; USGS: Austin, TX, USA, pp. 1-38.
- Hornbeck R, Keskin P (2014) The historically evolving impact of the Ogallala aquifer: Agricultural adaptation to groundwater and drought. American Economic Journal 6(1): 190-219.
- Rodriguez J, Heo J, Park J, Lee SS, Miranda K (2019) Inorganic pollutants in the water of Midland and Odessa, Permian Basin, West Texas. Air, Soil and Water Research 12: 1178622119861089.
- Nelson R, Heo J (2020) Monitoring environmental parameters with oil and gas developments in the Permian Basin, USA. International Journal of Environmental Research and Public Health 17(11): 4026-4043.
- Robertson W, Sharp J (2013) Variability of groundwater nitrate concentrations over time in Arid Basin Aquifers: sources, mechanisms of transport, and implications for conceptual models. Environmental Earth Sciences 69: 2415-2426.
- Heo J, Yu J, Giardino J, Cho H (2015) Water resources response to climate and land-cover changes in a semi-arid watershed, New Mexico, USA. Terrestrial Atmospheric and Oceanic Sciences 26(4): 463-474.
- Heo J, Yu J, Giardino J, Cho H (2015) Impacts of climate and land-cover changes on water resources in a humid subtropical watershed: a case study from East Texas, USA. Water and Environment Journal 29(1): 51-60.
- Seo M, Heo J, Kim Y (2021) Present and potential future critical source areas of nonpoint source pollution: A case of the Nakdong River watershed, South Korea. Environmental Science and Pollution Research 28(33): 45676-45692.
- US EPA (United States Environmental Protection Agency) (2019) Fertilizer Applied for Agricultural Purposes; US EPA: Washington, DC, USA.
- English S, Heo J, Won J (2020) Investigation of sinkhole formation with human influence: A case study from wink sink in Winkler County, Texas. Sustainability 12(9): 3537-3549.
- McGuire VL (2017) Water-level and recoverable water in storage changes, High Plains Aquifer, predevelopment to 2015 and 2013-15, Scientific Investigations Report 2011–5089. Scientific Investigations Report; USGS (US Geological Survey): Reston, VA,
- USGS (United States Geological Survey) (2015) Center Pivot Irrigation System, USA; USGS: Austin, TX, USA.
- McEwen M (2019) TIPRO Report Looks at Changing Demographics of the Permian Basin. Midland Reporter Telegram: West Texas, TX, USA.
- Rodriguez J, Heo J, Kim KH (2020) The impact of hydraulic fracturing on groundwater quality in the Permian Basin, West Texas, USA. Water 12(3): 796-811.
- Swigart J, Heo J, Wolf D (2021) Soil contamination assessments from drilling fluids and produced water using combined field and laboratory investigations: A case study of Arkansas, USA. International Journal of Environmental Resource and Public Health 18(5): 2421-2438.
- Lozano J, Heo J, Seo M (2021) Historical assessments of inorganic pollutants in the sinkhole region of Winkler County, Texas, USA. Sustainability 13(13): 7513-7526.
- US EIA (United States Energy Information Administration) (2018) Permian Basin Wolf camp Shale Play; US EIA: Washington, DC, USA.
- Epstein AC (2015) Health and environment risks from oil and gas development. In Hydraulic Fracturing Impacts and Technologies; CRC Press: New York, NY, USA, pp. 122-135.
- Jasechko S, Perrone D (2017) Hydraulic fracturing near domestic groundwater wells. Proceedings of the National Academy of Sciences of the United States of America 114: 13138-13143.
- US EPA (United States Environmental Protection Agency) (2003) Environmental Impact of the Petroleum Industry; US EPA: Washington, DC, USA.
- US Census Bureau. Population Estimates (2019)S. Census Bureau: Suitland-Silver Hill, MD, USA.
- USDA (United States Department of Agriculture) (2017) Census of Agriculture, 2017. Census Volume 1, Chapter 1: State Level Data.
- Carson D (2020) Texas Counties: Annual Precipitation.
- TWDB (Texas Water Development Board) (2003) Groundwater Availability of the Southern Ogallala Aquifer in Texas and New Mexico: Numerical Simulations Through 2050; TWDB: Austin, TX, USA.
- TWDB (Texas Water Development Board) (2016) Texas Aquifers Study: Groundwater Quantity, Quality, Flow, and Contributions to Surface Water TWDB: Austin, TX, USA.
- Heo J (2018) The impact of climate change on hydrology with geomorphology in Northeast Texas. Journal of Earth Science and Engineering 8: 1-7.
- Horne T, Brikowski T, Johannesson K (2023) Natural arsenic-rich spring waters discharging from the Austin Chalk, North-Central Texas, USA. Applied Geochemistry 150: 105547.
- Fischer A, Lee M, Ojeda A, Rogers S (2021) GIS interpolation is key in assessing spatial and temporal bioremediation of groundwater arsenic contamination. Journal of Environmental Management 280: 111683.
- Nilling J, Verma A, Singh A (2022) Precipitation of arsenic-bearing solids as a secondary control on arsenic speciation in groundwater: Evidence from field study and geochemical analysis. Geochimica et Cosmochimica Acta 333: 308-332.
- USGS (US Geological Survey) (2015) Arsenic and radionuclide occurrence and relation to geochemistry in groundwater of the Gulf Coast Aquifer System in Houston, Texas.
- Gong G, Basom J, Mattevada S, Onger F (2015) Association of hypothyroidism with low-level arsenic exposure in rural West Texas. Environmental Research 138: 154-160.
- Reedy RC, Scanlon BR, Walden S, Strassberg G (2011) Naturally Occurring Groundwater Contamination in Texas. TWDB (Texas Water Development Board) Final Report 1004831125.
- Lindsey B, Belitz K, Cravotta C, Toccalino P, Dubrovsky N (2021) Lithium in groundwater used for drinking-water supply in the United States. Science of The Total Environment 767: 144691.
- Sharma N, Westerhoff P, Zeng C (2022) Lithium occurrence in drinking water sources of the United States. Chemosphere 305: 135458.
- Adeel M, Zain M, Shakoor N, Ahmad M, Azeem I, et al. (2023) Global navigation of Lithium in water bodies and emerging human health crisis. NPJ Clean Water 6: 33.
- Moran B, Boutt D, McKnight S, Jenckes J, Munk L, et al. (2022) Relic groundwater and prolonged drought confound interpretations of water sustainability and Lithium extraction in Arid Lands. Earth‘s Future 10(7): 1-24.
- USGS (US Geological Survey) (2022) Depth to water and water quality in groundwater wells in the Ogallala aquifer within the north plains groundwater conservation district, Texas panhandle, 2019-20, and comparison to 2012-13 conditions. Scientific Investigations Report.
- Howell N (2021) Comparative water qualities and blending in the Ogallala and Dockum aquifers in Texas. Hydrology 8(4): 166-201.
- Appleyard S, Wong S, Willis-Jones B, Angeloni J, Watkins R (2004) Groundwater acidification caused by urban development in Perth, Western Australia: Source, distribution, and implications for management. Soil Research 42(6): 579-585.
- Heo J, Lee D, Koh D, Chang H (2007) The effect of ionic strength and hardness of trichloroethylene contaminated synthetic groundwater on remediation using granular activated carbon. Geosciences Journal 11: 229-239.
- US EPA (United States Environmental Protection Agency) (2012) 8 Total Solids; US EPA: Washington, DC, USA.
- Thu N, Patra S, Pranudta A, Nguyen T, El-Moselhy M, et al. (2023) Desalination of brackish groundwater using self-regeneration hybrid ion exchange and reverse osmosis system (HSIX-RO). Desalination 550: 116378.
- Mehta S, Fryar AE, Banner JL (2000) Controls on the regional-scale salinization of the Ogallala aquifer, Southern High Plains, Texas, USA. Applied Geochemistry 15(6): 849-864.
- Tahtouh J, Mohtar R, Assi A, Schwab P, Jantrania A, et al. (2019) Impact of brackish groundwater and treated wastewater on soil chemical and mineralogical properties. Science of The Total Environment 647: 99-109.
- Chaudhuri S, Ale S (2014) Long term (1960–2010) trends in groundwater contamination and salinization in the Ogallala aquifer in Texas. Journal of Hydrology 513: 376-390.
- US DOE (United States Department of Energy) (2018) Permian Basin Wolfcamp Shale Play, U.S. Department of Energy: Washington, DC, USA.


