Dependency of Evaporation and Class A Pan Coefficient on Meteorological Parameters
Antensay Mekoya*
Ethiopia Environment and Forest Research Institute, Bahir Dar Environment and Forest Research Center, Ethiopia
Submission: March 16, 2020; Published: April 14, 2020
*Corresponding author: Antensay Mekoya, Ethiopia Environment and Forest Research Institute, Bahir Dar Environment and Forest Research Center, P.O. Box: 2128 Bahir Dar, Ethiopia
How to cite this article: Antensay M. Dependency of Evaporation and Class A Pan Coefficient on Meteorological Parameters. Int J Environ Sci Nat Res. 2020; 24(2): 556134. DOI: 10.19080/IJESNR.2020.24.556134
Abstract
The relation of evaporation deriving meteorological parameters particularly wind speed, solar radiation and vapor pressure deficit with evaporation schemes namely Class A pan evaporation (Ep), potential evapotranspiration (PET) and reference evapotranspiration (ETo) at Tharandt, Germany for the summer half-year of 2004-2013 was investigated. PET was calculated using three methods: 1. Haude (2005), 2. Wendling (1991), 3. Penman (1963); whereas, ETo was calculated according to Food and Agricultural Organization-Penman Monteith method. The results showed that the evaporatin schemes were mainly driven by solar radiation (R2 ≥ 0.69, RMSE ≤ 0.76mm d-1) and vapor pressure deficit (R2 ≥ 0.53, RMSE ≤ 0.92mm d-1). The effect of wind speed at 2m in deriving the evaporation schemes was negligibly small (R2 < 0.12). An equation is derived for estimation of Ep from measured meteorological parameters alone which makes this study special. In another scenario, Class A pan coefficient (Kp) which is the ratio of ETo and Ep had shown good correlation with Ep only (R2 = 0.50, RMSE = 0.19, n = 1483). The correlation of Kp with ETo, shortwave radiation, wind speed at 2m, vapor pressure deficit, relative air humidity, and air temperature was too low (R2 < 0.1).
Keywords: Class A pan evaporation; Class A pan coefficient; Solar radiation; Vapor pressure deficit; Air temperature; Relative air humidity; Wind speed; Reference evapotranspiration; Potential evapotranspiration; Summer half-year; Tharandt
Abbreviations: Ep: Class A Pan evaporation; Kp: Class A Pan Coefficient; PET: potential evapotranspiration; ETo: reference evapotranspiration; SHY: summer half-year which is the time from april to september; PETs: PET estimated according to Haude, Wendling, and Penman; Rn: net solar radiation; Rs: solar or shortwave or incoming radiation; u2: wind speed at 2m; VPD: vapor pressure deficit; RH: relative air humidity; T: air temperature; Haude7: PET calculated according to Haude in which 17 values which were greater than 7mm d-1 are replaced by 7mm d-
Introduction
Evaporation does not take place at a constant rate as its rate naturally depends on meteorological, geographical, and topographical factors. The principal meteorological parameters affecting evapotranspiration are solar radiation, air temperature, relative air humidity and wind speed (Trajković and Živković (2009) as cited in Isikwue BC et al. [1] p.698; also refer Moderow et al. [2] and Wang & Dickinson [3]. Vapor pressure deficit (i.e., air humidity and air temperature) is also one of the meteorological parameters which affect evaporation or evapotranspiration [4]. The rate at which molecules leave water depends on the vapor pressure of the water (ew) and the rate at which molecules enter the air depends on the vapor pressure of the air (ea) above the water surface. Thus, the rate of evaporation depends on the difference between them called vapor pressure deficit (VPD); i.e., VPD = ew–ea. Therefore, evaporation is proportional to (ew – ea) and continuous until ew = ea. Similarly, evaporation is proportional to the difference between actual humidity and the saturated humidity at a given temperature.
In this article, the dependency of the methods of estimation of PET estimated according to Haude (Haude7), Wendling and Penman and ETo estimated according to FAO56-PM method on wind speed at 2m (u2), VPD, and shortwave and net solar radiation (Rs & Rn) at Tharandt from 2004 to 2013 for the summer half-year (n = 1830) was investigated. The summer half-year dependency of Class A pan evaporation (Ep) with u2, VPD, and Rs & Rn as well as with air temperature and with relative air humidity was also investigated (n = 1709).
Data and Methodology
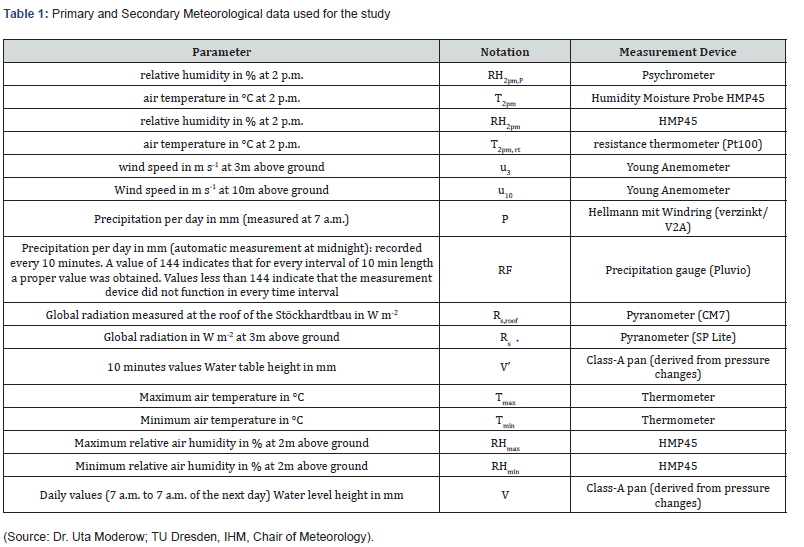
The study area was Tharandt, Germany (altitude: 220 m a.s.l, latitude: 50°58’42.06” N, longitude: 13°34’52.69” E). Ten years (01.01.2004 to 31.12.2013) daily and ten minutes data of Tharandt meteorological station was the basis of the data set. The meteorological parameters and measurement devices used for the study are presented in Table 1.
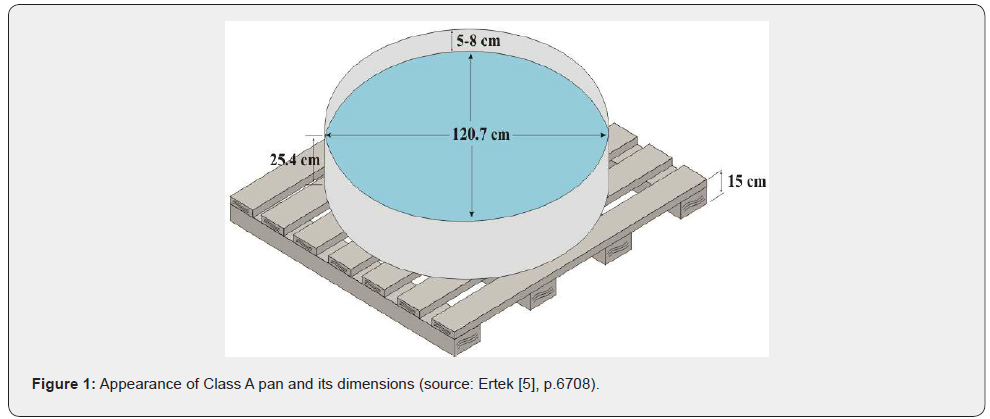
The pan used for measurement of pan evaporation is the World Meteorological Organization (WMO) standard Class A pan evaporimeter (see Figure 1). Class A pan evaporation (Ep) is calculated as described in Mekoya et al. [6]. PET estimated using three methods:
a) Haude (2005) as cited in Weiß [7];
b) Wendling (1991) as cited in Wendling [8]; and
c) Penman (1963) as cited in ASCE-EWRI [9].
ETo is estimated according to Allen et al. [10] (FAO56-PM). Net radiation (Rn) (in MJ m-2 d-1) is also calculated as described in Allen et al. [10].
For the analyses, measured shortwave radiation in MJ m-2 d-1 at 3m above ground (Rs) was used. At Tharandt over the ten years (2004 to 2013) the average, extreme maximum and extreme minimum values of net radiation (Rn) were 8.87, 26.83 and 0.10MJ m-2 d-1; whereas its corresponding values of Rs were 6.19, 15.87 and -0.96MJ m-2 d-1, respectively.
Saturation vapor pressure (es) in kPa is calculated as given below.

Where, T is air temperature (in °C).
To get saturation vapor pressure (es) in hPa using T2pm, Eq. 1 is modified as

Relative humidity in % (RH) expresses the degree of saturation of the air as a ratio of the actual (ea) to the saturation (es) vapor pressure at the same temperature.

Generally, daily vapor pressure deficit (VPD) in kPa was calculated using Eq. 1 and Eq. 2. However, in the case of PET according to Haude, VPD in hPa was calculated using Eq. 1a and Eq. 3. Daily wind speed at 2 m above ground (u2) in m s-1 is calculated as given below.


Where uz is measured wind speed at z m above the ground surface (in m s-1), and z is height of measurement above the ground surface (in m).
Daily wind speed at 2m above ground (u2) in m s-1 is used as calculated in Eq. 4 (except for PET according to Wendling which uses Eq. 5).
Finally, the degree of dependency of evaporation schemes on u2, VPD, Rs and Rn was evaluated using a linear regression model where values of Pearson’s correlation coefficient (r), R2, RMSE, and p-value (at 95% confidence interval or at 0.05 significant level) were used for assessing the fit of the regression model.
Results and Discussion
Evaporation schemes and meteorological parameters The dependency of evaporation schemes on wind speed
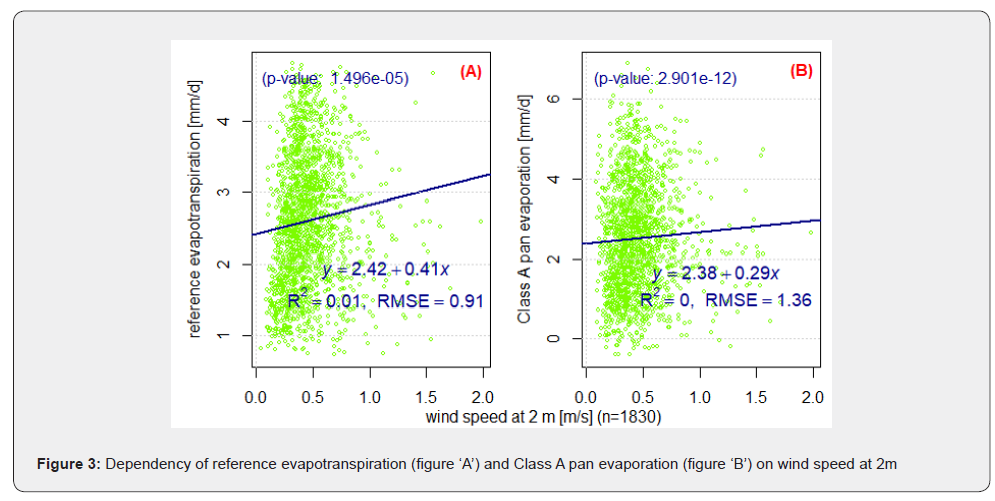
Figure 2 shows the dependency of potential evaporation schemes namely PET according to Haude, Haude7, Wendling and Penman with wind speed at 2m. Similarly, Figure 3 shows the dependency of reference evapotranspiration and Class A pan evaporation with u2. Generally PET schemes, ETo, and Ep had shown significantly poor dependency with u2. The dependency was nonsignificant (p-value > 0.05) only in the case of PET estimated according to Haude7. Moreover, PETs, ETo and Ep increased with increasing wind speed at 2m for u2 ≤ 1 m s-1 and slightly decreased with increasing values of u2 for u2 > 1 m s-1, where in all cases R2 was less than 0.1 (not shown).

The dependency of evaporation schemes on vapor pressure deficit
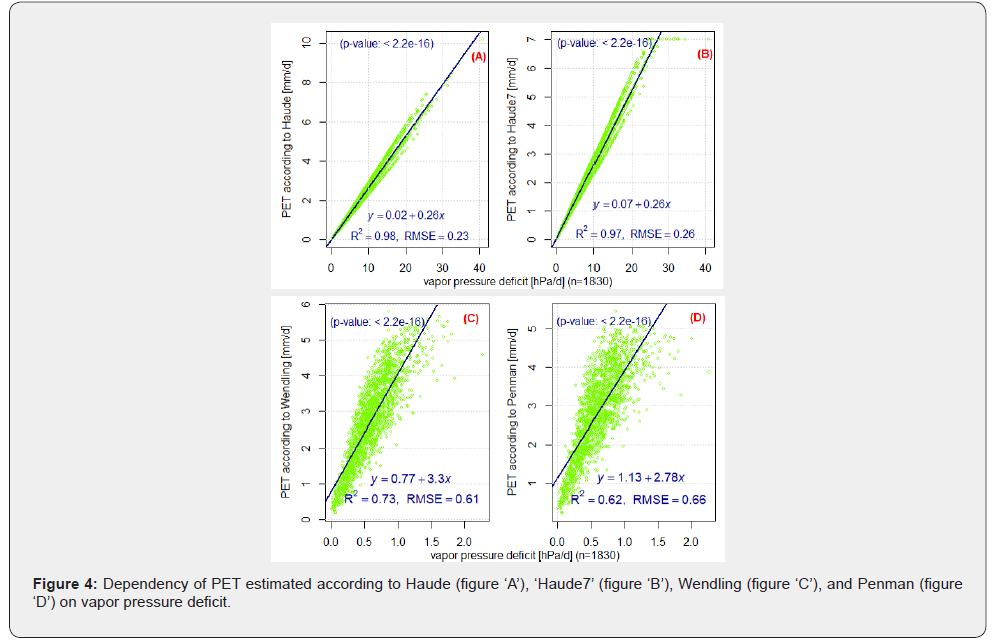
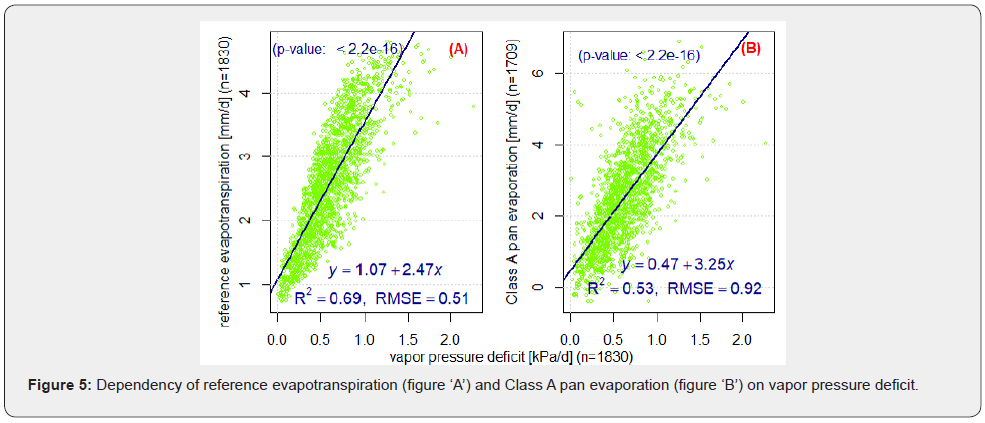
The dependency of PETs and ETo with vapor pressure deficit was high (R2 ≥0.78; RMSE ≤ 0.62 mm d-1) and significant (p-value < 2.2∙10-16 < 0.05); the dependency in the case of Ep was also ‘slightly strong’ (R2 = 0.53; RMSE = 0.93mm d-1) and significant (see Figure 4 & 5). Particulary in the case of PET according to Haude it was extremely high (R2 = 0.98; RMSE = 0.23mm d-1) and significant. Note that PET according to Haude is calculated by multiplying calibrated factor and VPD.
The dependency of evaporation schemes on solar radiation
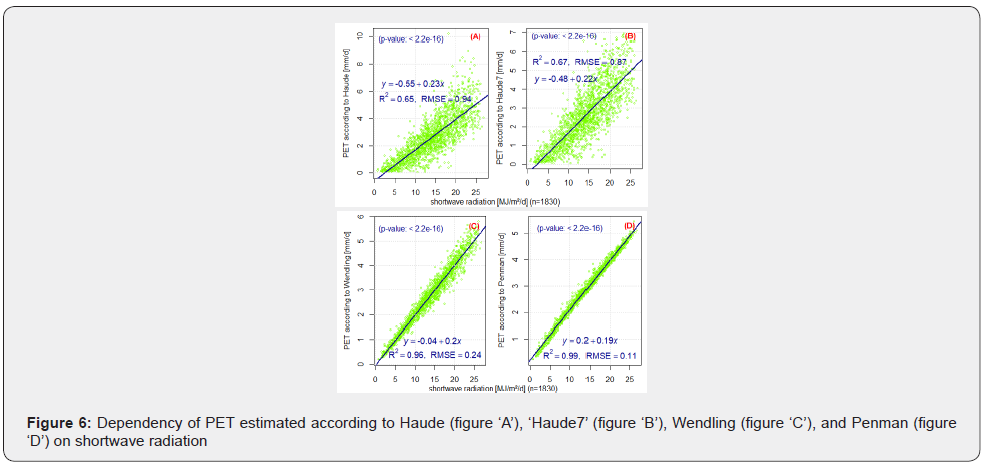
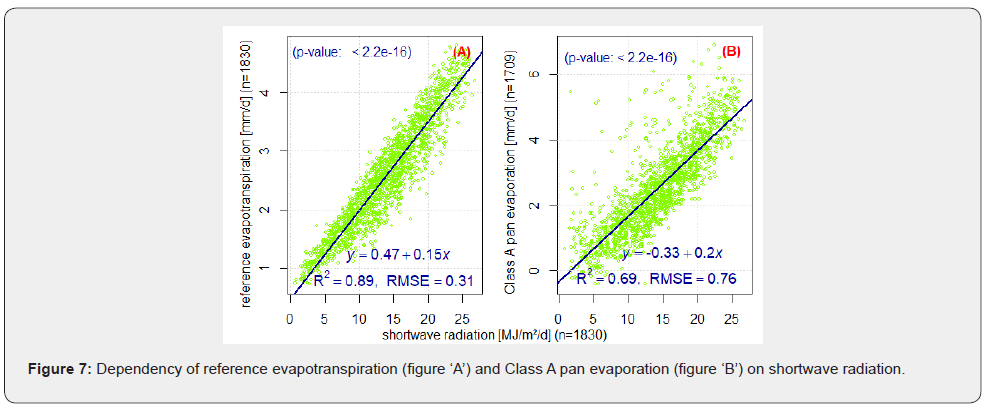
Figure 6 & 7 show that the dependency of PETs and ETo on shortwave or solar radiation was high (R2 ≥ 0.89). The dependency of Ep on Rs was also a bit high (R2 = 0.69; RMSE = 0.76mm d-1). The dependency was extremely high in the case of Penman and Wendling PETs (R2≥0.98). The dependency of evaporation schemes on net solar radiation was very high and significant particularly in the case of ETo, and PET according to Wendling and Penman (see Table 2).

Further on evaporation schemes and meteorological parameters
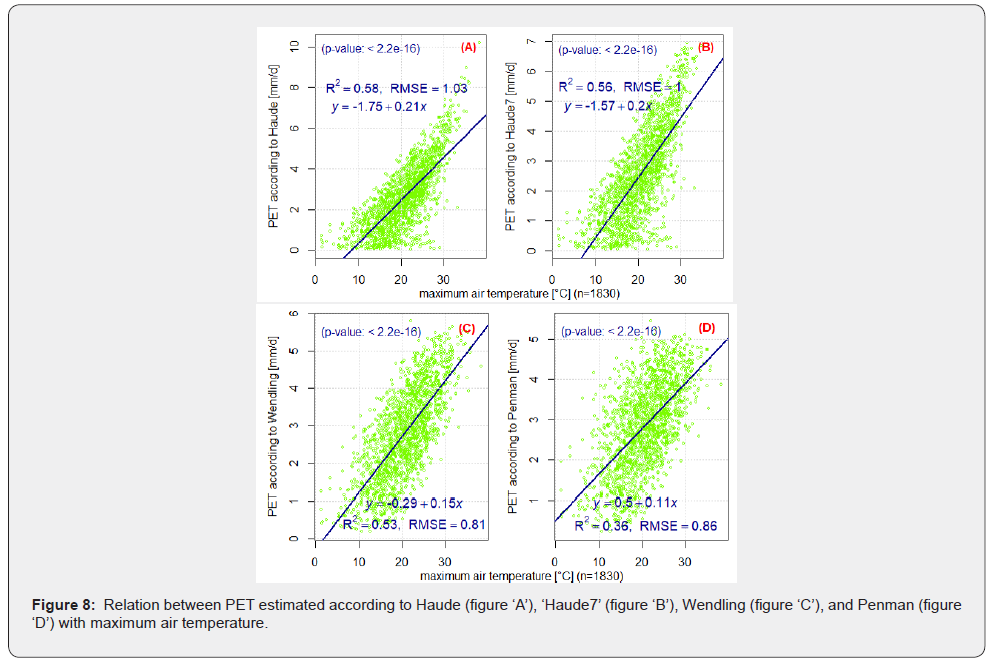
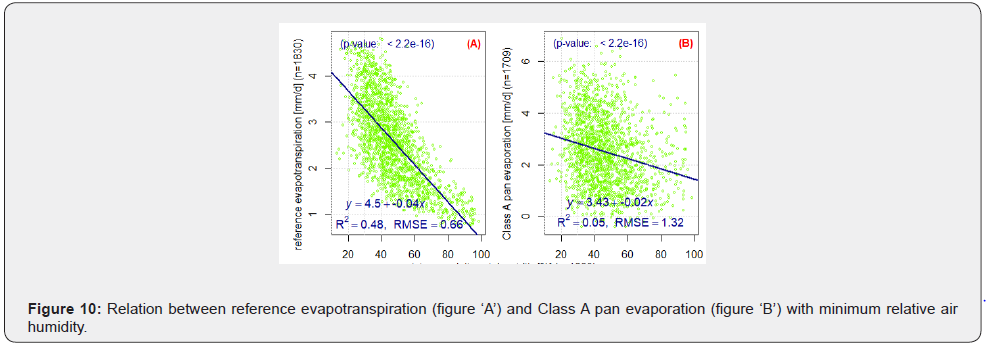
The relation between the evaporation schemes with maximum air temperature are presented in Figure 8 & 9. Generally, the correlation of the evaporation schemes with air temperature (not shown) was lower as compared to their correlation with maximum air temperature. A significant positive correlation (r ≥ 0.6) was observed between all evaporation schemes and maximum air temperature. Also, the relation of air humidity with the evaporation schemes is presented in Table 3, the corresponding graph for ETo and Ep is presented in Figure 10. For minimum relative air humidity and relative air humidity a significant good negative correlation (r ≤ -0.7) was observed with all evaporation schemes except Ep (see Table 3 & 4). The intercorrelation between ETo, PET according to Wendling, and PET according to Penman was very high (r > 0.9).




Derivation of equations for estimation of Class A pan evaporation
The Pearson’s correlation coefficient (r), R2, RMSE, the slope (a), the y-intercept (b), and an accuracy factor ‘F’ = 2(R2 +1- RMSE) of the linear regression model (‘y = ax + b’) described before are summarized in Table 4. F ranges from negative values to 4. Negative values of F indicate no accuracy and F = 4 indicates perfect alignment of model prediction or simulated or estimated data (y) and simulator or measured data (x). Ep can be estimated with good accuracy from ETo, Rn, Kp, and VPD as given below, where y is replaced by Ep and x is replaced by ETo, Rn, Kp, VPD, Rs, Tmax, RHmin, RH and T.

However, the calculation of ETo, Rn, Kp and VPD is not a simple task as it requires many parameters to be fulfilled. In contrast, estimation of Ep using only measured meteorological parameters such as Rs, Tmax, RHmin, RH, and T which can be easily obtained from meteorological offices on request has been desired and are given below.

Comparatively relative air humidity (RH) and air temperature (T) have lower values of accuracy factor (F). Therefore, using weighted average of F and Eq. 10, Eq. 11 and Eq. 12, Class A pan evaporation (Ep) in mm d-1 can be estimated with good accuracy from Rs, Tmax, and RHmin as [1.86 (0.2 Rs - 0.33) + 0.82 (0.16 Tmax - 0.86) + 0.56 (5.01 – 0.05 RHmin)]/(1.86 + 0.82 + 0.56) ≈ (0.4 Rs + 0.13 Tmax - 0.03 RHmin + 1.5)/3.24 (see Eq. 15)

Where, Epd is Class A pan evaporations in mm d-1 derived from measured solar or shortwave radiation (Rs) in MJ m-2 d-1, daily maximum air temperature (Tmax) in oC, and daily minimum relative air humidity (RHmin) in %.
Class A pan coefficient and meteorological parameters
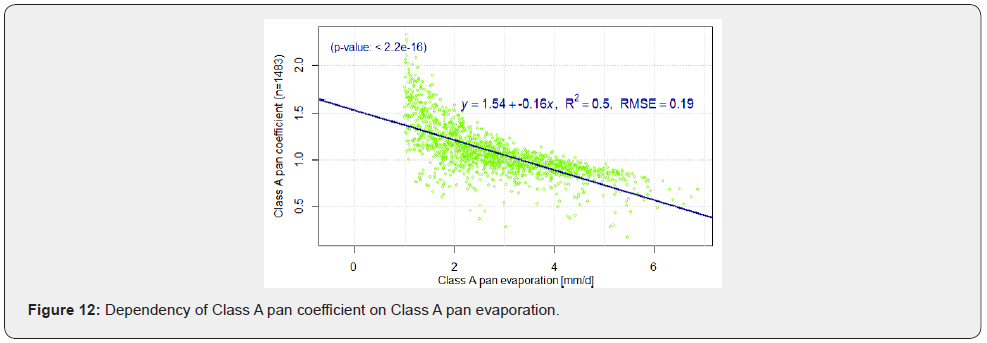
Class A pan coefficient (Kp) is the ratio of ETo and Ep. Its correlation with meteorological variables such as solar radiations (Rs and Rn), vapor pressure deficit (VPD), wind speed at 2m (u2), relative air humidity (RH) and air temperature (T) was too low (R2 < 0.1). Also, the correlation between Kp and ETo was too low (R2 = 0.1; RMSE = 0.26). However, its correlation with Ep for Ep ≥1 mm d-1 was relatively ‘good’ (R2 = 0.50; RMSE = 0.19; n = 1483; see Figure 12).
On the basis of the result of the linear regression model, for Tharandt site and places with similar climatic and or topographic characteristic with Tharandt, a rough estimate of summer halfyear daily values of Kp can be estimated from measured Ep (for 1 ≤ Ep ≤ 7.2 mm d-1); range = [0.388, 1.38] (see Eq. 16).

Where Kp is Class A pan coefficient and Epd is derived Class A pan evaporation in mm d-1.
Conclusion
At Tharandt for the summer half-year from 2004 to 2013 evaporation was mainly driven by solar radiation and vapor pressure deficit. The correlation between air temperature and relative air humidity with evaporation schemes was also good. Sunshine duration, which is not considered in this study, might also have good correlation with evaporation schemes. The effect of wind in deriving evaporation was negligibly too low. Moreover, the effect of wind speed at 2m (u2) was not uniform. For u2≤1 m s-1, the evaporation schemes namely Class A pan evaporation, reference evaporation and potential evaporation (PET) according to Haude, Wendling and Penman increased with increasing values of u2, whereas, for u2 > 1m s-1, they slightly decreased with increasing values of u2. Note however that the cause for the negligibly too low effect of wind speed at 2m on evaporation schemes might have resulted due to topography of the study site. Because Tharandt station is located at the bottom of a ‘V-shaped’ valley in which there is a high shelter effect that could have an impact at least on the wind and sunshine duration. The non-uniform effect of wind speed (for u2 > 1 m s-1 and for u2 ≤ 1 m s-1) on evaporation schemes is not clear. It might happen due to the influence of the nearby Weißeritz river.
The correlation between Class A pan coefficient and meteorological parameters such as solar radiation, vapor pressure deficit, wind speed at 2m, relative air humidity, air temperature and reference evapotranspiration was too low. However, its correlation with Class A pan evaporatin (Ep) was comparatively good. Thus, for Tharandt site and places with similar climatic and topographic characteristics with Tharandt, Class A pan coefficient can be estimated from Ep alone with good accuracy. Also, at Tharandt, for the summer half-year Ep can be estimated from reference evapotranspiration, net solar radiation, Class A pan coefficient, vapor pressure deficit, solar or shorwave radiation, maximum air temperature, minimum relative air humidity, relative air humidity, and air temperature with very good accuracy. Particularly, the estimation of Class A pan evaporation merely based on measured solar radiation, maximum air temperature and minimum relative humidity makes this study special. Inclusion of actual sunshine duration hours which might improve the accuracy of the estimation of Class A pan evaporation is recommended.
The results of this study can be used for other parts of the world; however, only after proper validation because for instance unlike the case in Tharandt, in other parts of the world, the contribution of wind speed in deriving evaporation (evapotranspiration) maybe even higher than vapor pressure deficit. Note also that the equations developed in this study are based on ten years of climate data of a single station. Therefore, the results of this article shall be evaluated again using at least thirty years of climate data from multiple stations, if available, as ten years may not be enough to draw a generalized and strong conclusion. Last but not least, the knowledge obtained from this study may be used for evaporation related study in Tharandt and in areas with similar climatic conditions with Tharandt which can serve for decision makers to take appropriate measures in various agriculture, water and forestry sectors. Because summer half-year evaporation and precipitation amounts were almost equal, this study can also be implemented in warmer areas of the world with some modifications.
Acknowledgement
First of all, I do praise GOD and GOD’s Mother above all. I particularly thank Virgin Mary’s or ‘Tsadiqane Mariam’ (‘ፃድቃኔ ማርያም’) monastery of Ethiopia. Next, I thank Technische Universität Dresden, Faculty of Environmental Sciences, Institute of Hydrology and Meteorology, Chair of Meteorology for providing me all the data used for the study. I also thank DAAD, the National Meteorology Agency of Ethiopia (NMA), and the Ethiopian Meteorology Society for giving me financial support during my master’s study. Very special thanks to my official supervisors Prof. Dr. Christian Bernhofer and Dr. Uta Moderow for their excellent supervision during my master thesis (finished in 2017). I am also grateful to my friend Mr. Abebe Guadie and my lecturer Mr. Endalkachew Bekele; they supported me in the publication of my previous research article. Last but not least, I would like to thank my wife and my family and friends for their crucial support and for sharing love and happiness.
Data Availability Statement
All data used during the study were provided by a third party. Direct requests for these materials may be made to the provider as indicated in the Acknowledgements. Also, all models or code generated or used during the study are available from the corresponding author by request.
ORCID
Antensay Mekoya https://orcid.org/0000-0002-2895-4581
References
- Isikwue BC, Audu MO Isikwue OM (2014) Evaluation of Evapotranspiration usingFAOPenman-MonteithMethod inKanoNigeria.InternationalJournal of Science and Technology 3(11): 698-703.
- Moderow U, Aubinet M, Feigenwinter C, Kolle O, Lindroth A, et al. (2009) Available energy and energy balance closure at four coniferous forest sites across Europe. TheorAppl Climatol98(3-4): 397-412.
- Wang K, Dickinson RE (2012) A review of global terrestrial evapotranspiration: Observation, modeling, climatology, and climatic variability. Rev Geophys50(2).
- Qin M, Hao L, Sun L, Liu Y, Sun G (2017) Climatic controls on watershed reference evapotranspiration vary dramatically during the past 50 years in southern China.Hydrol Earth Syst Sci.
- Ertek A (2011) Importance of pan evaporation for irrigation scheduling and proper use of crop-pan coefficient (Kcp), crop coefficient (Kc) and pan coefficient (Kp).African Journal of Agricultural Research 6(32): 6706-6718.
- Antensay M, Christian B, Moderow U (2019) Estimation of Evaporation using Daily and Ten-Minute Class-A Pan Data from Automatic Measuring Pressure Sensor Instrument at Tharandt, Germany. Int J Environ Sci Nat Res19(1): 556003.
- Weiß M, Menzel L (2008) A global comparison of four potential evapotranspiration equations and their relevance to streamflow modeling in semi-arid environments.Adv Geosci 18: 15-23.
- Wendling U (1991) Schätzmethoden der Verdunstung landwirtschaftlicher Bestände nach den Ansätzen von Penman und Turc. = ‘Estimating evaporation in crop stands according to Penman and Turc formulas.’ (in German, with English summary). Arch.Acker- PflanzenbauBodenkd 35: 251-257.
- ASCE-EWRI (2002)The ASCE Standardized Reference Evapotranspiration Equation Appendices A-F. Environmental and Water Resources Institute (EWRI) of the American Society of Civil Engineers (ASCE) Standardized Reference Evapotranspiration Task Committee (TC).
- Allen RG, Pereira LS, Raes D, Smith M (1998) Crop evapotranspiration: Guidelines for computing crop water requirements. FAO Irrig and Drain, Paper No. 56, Food and Agricultural Organization of the United Nations, Rome, Italy.


