The Most Cited Author Who Published Papers in the Journal of Otolaryngology: A Bibliometric Study
Tsair Wei Chien1, Hsien-Yi Wang2 and Willy Chou3,4*
1Medical Research Department, Taiwan
2Department of Sport Management, Taiwan
3 Department of Physical Medicine and Rehabilitation, Taiwan
4 Department of Recreation, Health-Care Management & Institute of recreation, Taiwan
Submission: November 16, 2018; Published: November 27, 2018
*Corresponding author: Willy Chou, Chi-Mei Medical Center, 901 Chung Hwa Road, Yung Kung Dist, Tainan 710, Taiwan.
How to cite this article: Tsair Wei Chien, Hsien-Yi Wang, Willy Chou. The Most Cited Author Who Published Papers in the Journal of Otolaryngology: A Bibliometric Study. Glob J Oto, 2018; 18(3): 555986. DOI: 10.19080/GJO.2018.18.555986
Abstract
Background: Individual researchers’ achievements(IRA) were determined by the number of publications and citations using bibliometric indices(e.g., author impact factor(AIF)) which were criticized without considering authorship weighted contributions. The objective of this study is to develop a scheme for quantifying author contributions which can be applied to calculate the author’s IRA. Which article topics with higher impact factor(IF) are also investigated
Methods: We obtained abstracts from Medline by searching the keywords of “Otolaryngology”[Journal]). A total of 291 articles were retrieved in 1978 and cited 94 times by published papers in Pubmed Central. An authorship-weighted scheme (AWS) was used for quantifying coauthor contributions. The number of citations on article topics was analyzed using bibliometric indices(x-index, author impact factor(AIF), L=weithted citations and Ag=mean on core articles for g-index). We plotted the clusters, including (i) the top 10 author clusters which collaborated most in centrality degree of social network analysis(SNA); (ii) most-cited authors, (ii) article types classified by SNA and major medical subject headings(MeSH) dispersed on a dashboard, and (iii) one way ANOVA applied to analyze the difference among clusters of author collaborations and Mesh terms. Visual dashboards were shown on Google Maps.
Results: This study found that (i) the most cited authors is P A Santi(PMID=113741 cited 10 times) with high AIF=10; (ii) the top three topics are physiology, surgery, and pathology; (iii) the most number of cited article is entitled by “Arteriolar sclerosis as a cause of presbycusis” with PMID=113738. Differences in impact factor were found among MeSH clusters with statistics of F(9,37)=2.287 and p=0.025.
Conclusions: The AWS-based x-index can be applied to other academic fields for understanding the most highly cited authors in a discipline or on an academic topic.
Keywords: Pubmed center; Authorship-Weighted Scheme; Social Network Analysis; Google MAPS; x-index
Abbrevations: AIF: Author Impact Factor; AWS: authorship-weighted scheme; BC: Betweenness; centralityIC: internal consistency; IF: impact factors; MESH: medical subject headings; PMC: PubMed Central; SNA: Social network analysis; VBA: visual basic for application
Introduction
Otorhinolaryngology (also called otolaryngology and otolaryngology-head and neck surgery) is a surgical subspecialty within medicine that deals with conditions of the ear, nose, and throat (ENT) and related structures of the head and neck [1]. Doctors who specialize in this field are called otorhinolaryngologists, otolaryngologists, ENT doctors, ENT surgeons, or head and neck surgeons. Patients often seek treatment from an otorhinolaryngologists for diseases of the ear, nose, throat, base of the skull, and for the surgical management of cancers and benign tumors of the head and neck [1]. As of Novenber10, 2018 154899 abstracts were found by searching the keyword of Otorhinolaryngology in Pubmed Central(PMC), and 2705 in article title only. There are four topics that intrigue us to study, including
a. which terms of author collaborations are most outstanding in the academic field related to otorhinolaryngology?
b. which research teams and article types were highly cited by published papers?
c. which authors whose papers were cited most in otorhinolaryngology?
d. Is any difference among research teams or article types regarding the topic of otorhinolaryngology?
It is hard to find the relationship between multiple entities. The social network analysis(SNA) has been applied to investigate the correlations of entities in a network by the concept of cooccurrence [2-4]. Many data scientists have developed ways to discover new knowledge from the vast quantities of increasingly available information [5], particularly applying social network analysis (SNA) [6-8] to author collaborations in academic fields. Authorship collaboration using SNA has been investigated by many authors in recent years [6]. because co-authors among researchers form a type of social network. Whether the keyword network in otorhinolaryngology earns different impact factors is interesting to explore.
We are thus interested in using SNA to explore the features in otorhinolaryngology from published papers we observed in Medline library. However, the authorship weighted scheme should be applied to fairly report the most cited authors in a discipline[2,3]. Google maps have provided users to gain an overall geospatial visualization [9,10]. Few were found using Google Maps to show the study results when searching the keyword google map [Title]. Even many papers [6-8]. have investigated co-author collaboration in the literature. However, none display these results using SNA and dashboards on Google Maps. Our aims are to present (i) the top 10 author clusters which collaborated most in centrality degree of social network analysis(SNA); (ii) most-cited authors, (ii) article types classified by SNA and major medical subject headings(MeSH) dispersed on a ashboard, and (iii) one way ANOVA to analyze the difference among clusters of author collaborations and Mesh clusters.
Methods
Data Source
We obtained 291 abstracts from Medline by searching the keywords of “Otolaryngology”[Journal]). A total number of 94 citing articles were successfully matched to the 37 cited papers in Pubmed Center(PMC).
A General AWS for quantifying coauthor contributions
An authorship-weighted scheme (AWS) was based on the Rasch rating scale model [11] for quantifying author contributions and letting the sum equals 1, see Equation (1) and (2) [2,3]:
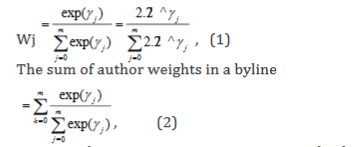
As a result, more importance is given to the first (=exp(m), primary) and the last (=exp(m-1), while it is assumed that the others (the middle authors) have made smaller contributions [12]. In Eq.2, the smallest portion(=exp(0)=1) is assigned to the second last author with the odds=1 as the basic reference [2,3].
Author Impact Factor (AIF) used for Evaluating Individual Researchers’ Achievements (IRA)

The AIF of an author A can be defined in Eq.3:), (3)
A total number of 291 authors were collected for calculating their metrics and AIFs based on citable papers in PMD in 2978 only. All metrics and AIFs were located on dashboards using SNA and Google Maps to display.
Social Network Analysis Using Pajek Software
In keeping with the Pajek guidelines [13] using SNA, we defined an author as a node(or an actor) that is connected to another counterpart at another node through the edge of a line. Usually, another weight is defined by the number of connections between two nodes [2,3]. Three main centrality measures (i.e., degree, closeness, and betweenness) are frequently used to evaluate the influence (or power) momentum of an entity (e.g., the author or keyword) in a network [14,15]. Centrality is an important index to analyze the network. Any individual authors lie in the center of the social network will determine its influence on the network and its speed to gain information [16]. In this study, the degree centrality was applied to explore the keywords and author collaborations.
Article Topics Based on Medical Subject Headings
SNA was applied to classify the major medical subject headings(MeSH) into articles on the topic of otolaryngology. The algorithm of community partition was performed to identify and separate the clusters.
Each article was, in turn, assigned to a specific MeSH cluster through the maximum likelihood estimation. As such, each article was classified as one of the MeSH clusters. Each MeSH cluster can be characterized by bibliometric indices which internal consistency (IC) can be examined by Kendall’s coefficient of concordance (W) [17] across keyword clusters. If the agreement is accepted by the statistical alpha level (<0.05) [18].
The Unique Tool for Creating Google Maps with SNA
The centrality measures are computed by SNA algorithm in Pajek. We imported them into an author-made Excel module and then created a page of Hyper Text Mark-up Language(HTML) used for Google Maps. Bibliometric indices regarding h-index[20], the author impact factor (AIF)[21, 22], and others(i.e., g-index[23], Ag[23], x-index[24], and L-index [25]). The L-index is the root of the total citations for authors used in this study.
Results
TASK1: Presenting the Most Cited Author in Otolaryngology
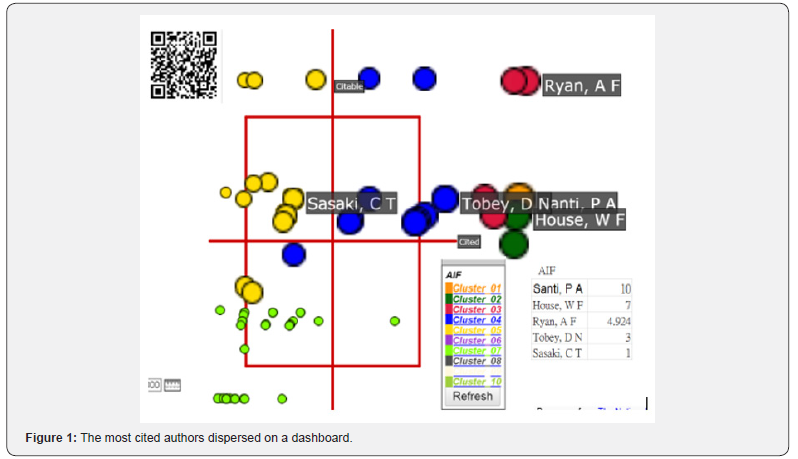
The most cited authors is PA Santi(PMID=113741 cited 10 times) with high AIF=10 [19] until 2018 with high metrics(citable=0.73, cited=7.31, AIF=10, Ag=7.31, h=1.31, =1, x=2.7). Interested readers are invited to scan the QR-Code in Figure 1 to examine the author’s publication outputs in PMC by clicking the specific author bobble.
TASK2: Selecting the Top Topics Related to Journal Impact Factor (JIF)
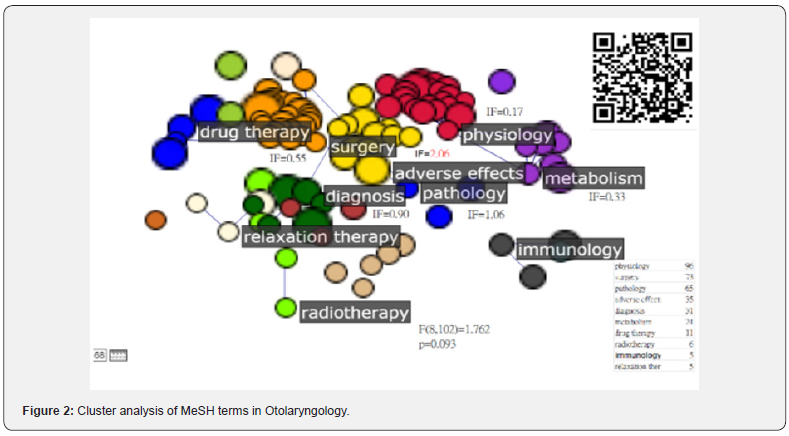
The top 10 MeSH clusters were separated as shown in Figure 2. The representative terms with the most degree centrality are shown for each cluster. The interested readers are recommended to scan the QR-coed in Figure 2 to see the detailed information in PMC by clicking the word of publication when the specific keyword bubble is selected. The top three topics are physiology, surgery, and pathology.
TASK3: Analysis of Kendall’s W and Topics with high IF
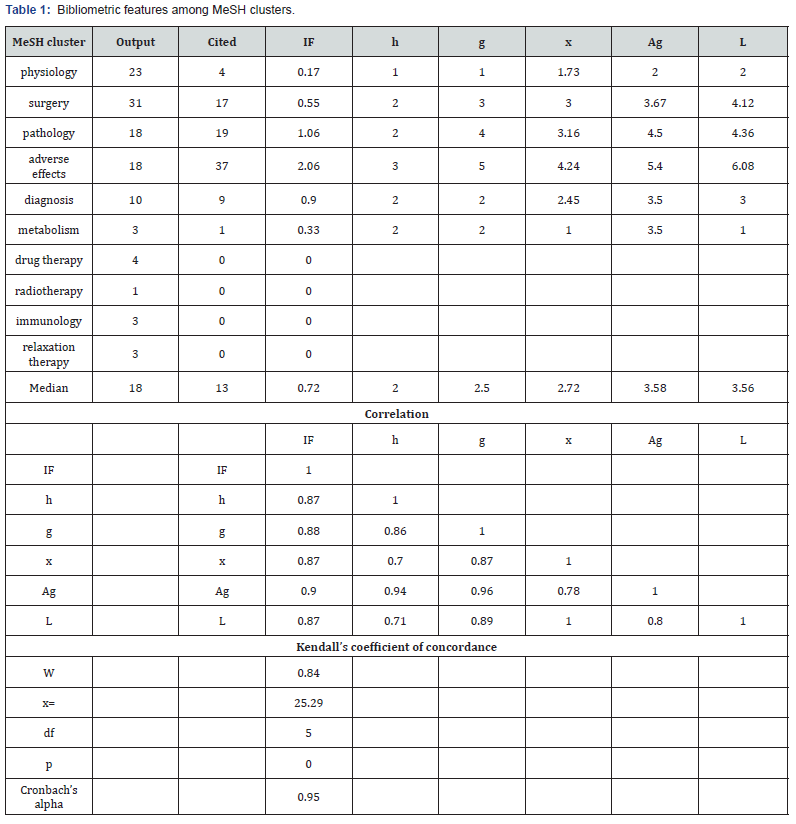
Table 1 at the top shows the counts of citable, cited articles and metrics across the MeSH clusters. MeSH impact factors have relatively-strong relations with other metrics at the middle panel in Table 1. Kendall’s W is 0.84 ( 25.29, df = 5, p < 0.001), indicating a strong IC (at the bottom in Table 1). In Table 1, we can see that the topic of adverse effects earns the highest IF(=2.06=37/18) compared to other counterparts. Similarly, the topic of adverse effects also owns the highest metrics if author-level indices were applied.
TASK4: Analysis of author Collaborations with Impact nFactors in Clusters
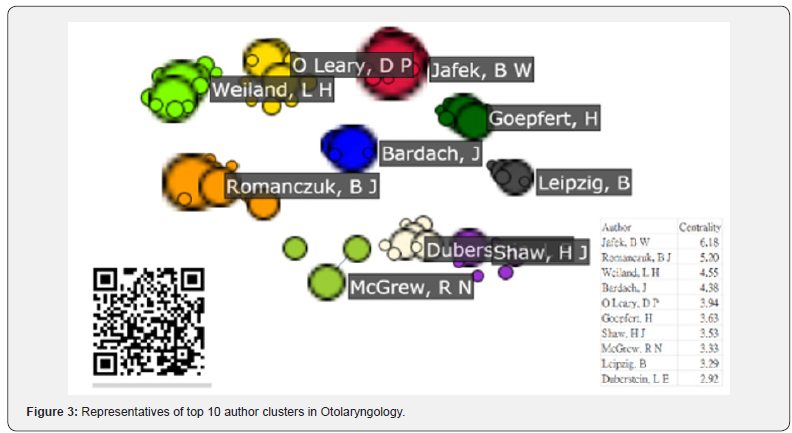
The top 10 representatives of author clusters in otolaryngology are shown in Figure 3. The representatives with the highest degree centrality for each cluster are highlighted with the author names. The largest bubble size is the author BW Jafek, followed by BJ Romanczuk, and LH Weiland. The one-way ANOVA shows no any difference in impact factor exists among author clusters.
Discussion
This study found that (i) the most cited authors is P A Santi(PMID=113741 cited 10 times) with high AIF=10; (ii) the top three topics are physiology, surgery, and pathology; (iii) the most number of cited article is entitled by “Arteriolar sclerosis as a cause of presbycusis” with PMID=113738. Differences in impact factor were found among MeSH clusters with statistics of F(9,37)=2.287 and p=0.025. Although the h-index [20-25] is a popular authorlevel metric that can measure both the productivity and citation impact of the publications of a scientist, one of its shortcomings is the assumption of equal credits for all coauthors in an article [26-28]. Many concepts of author impact factor(AIF) has already proposed before [28-33], but we are not aware of any empirical study that can successfully solve the problem of quantifying coauthor contributions [28] in the empirical discipline.
Even Vavryčuk [34] proposed a combined weighted counting scheme in 2018; the weighted mathematical scheme is complex and not applicable compared to the one in Eq. 1. The most worthnoting feature in this study is the general AWS fully congruent with the category probability theory based on the Rasch rating scale model (RSM) [11]. We can adjust the parameters(i.e., the base and the power) to accommodate many types of situations or scenarios in practice. Hence, Vavryčuk’s combined weighted scheme [34] (or the harmonic credits [35]) is a special case of the general AWS in Eq. 2. Another feature of this study is about the MeSH clusters classified by the SNA and assigned by the maximum likelihood estimation through the equation for a given cluster(k)= . With which, the relations between IF and the article topics can be inferred, like adverse effect with the highest IF(=2.06=37/18) compared to others. Besides the author PA Santi(PMID=113741 cited 10 times) with high AIF=10 [19], the calculation of metrics can be applied to others, such as the author AF Ryan at the righttop side in Figure 1 has two citable articles [36,37] cited six and two times, respectively, with metrics of AIF=4.92, Ag=2.46, h=1.39, =2, and x=2.09. The topic clusters denoted by the representative MeSH terms are physiology, surgery, pathology, and so on, see Figure 2. The second feature is the intrinsic dynamic character of the simple AIFs to examine the change of author’s AIF. Unlike the h-index, which is a growing measure taking into account the whole career path[22].
Study limitations
Although findings are based on the above analysis, there are still several potential limitations that may encourage further research efforts. First, all data were linked to the PubMed database. There might be some biases of understanding the matched authors because some different authors with the same name or abbreviation exist, who are affiliated with different institutions. Therefore, the result of author relationship analysis would be influenced by the accuracy of the indexing author. Second, many algorithms have been used for SNA. We merely applied the algorithm of degree centrality in the Figures. Any changes in the algorithm used in this study might present a different pattern and judgment to the results. Similarly, the formula, Eq.1, used in this study is also a special case of the general AWS model. Any change for the parameters might present a different AIF or other metrics and judgment to the results. Third, the assumption of corresponding (or supervisory) authors being the last authors might be challenged, especially in computing AIFs. Any parameters changed in our proposed formula will affect the author contribution weights and the AIFs(or h-index) in results.
Fourth, the data extracted from PMC cannot be generalized to other major citation databases—such as the Scientific Citation Index (SCI; Thomson Reuters, New York, NY, USA) and Scopus (Elsevier, Amsterdam, The Netherlands). Such as the most cited authors are determined by the paper selections on Pubmed. Finally, the data were merely downloaded in 1978 which are limited to the generation of study results in a short period. Authors are recommended to include many years regarding the topic of otolaryngology in the future.
Conclusion
The AWS-based x-index can be applied to other academic fields for understanding the most highly cited authors in a discipline. The AWS can objectively and fairly determine the individual researchers’ achievements(IRA) in the discernible future.
References
- (2018) Teh difinition of otolaryngologist.
- Chien TW, Wang HY, Chang Y, Kan WC (2018) Using Google Maps to display the pattern of coauthor collaborations on the topic of schizophrenia: A systematic review between 1937 and 2017. Schizophr S0920-9964(18): 30573-30575.
- Chien TW, Chow JC, Chang Y, Chou W (2018) Applying Gini coefficient to evaluate the author research domains associated with the ordering of author names: A bibliometric study. Medicine 97(39): e12418.
- Chien TW, Chang Y, Wang HY (2018) Understanding the productive author who published papers in medicine using National Health Insurance Database: A systematic review and meta-analysis. Medicine (Baltimore) 97(8): e9967.
- Morris MA, Saboury B, Burkett B, Gao J, Siegel EL (2018) Reinventing Radiology: Big Data and the Future of Medical Imaging. J Thorac Imaging 33(1): 4-16.
- Sadoughi F, Valinejadi A, Shirazi MS, Khademi R (2016) Social Network Analysis of Iranian Researchers on Medical Parasitology: A 41 Year Co- Authorship Survey. Iran J Parasitol 11(2): 204-212.
- Osareh F, Khademi R, Rostami MK, Shirazi MS (2014) Co-authorship Network Structure Analysis of Iranian Researchers’ scientific outputs from 1991 to 2013 based on the Social Science Citation Index (SSCI). Collnet J Scientometr Info Manag 8 (2): 263-271.
- Liu X, Bollen J, Nelson ML, Van de Sompel H (2005) Co-authorship networks in the digital library research community. Info Process Manag 41(6): 1462-1480.
- Dasgupta S, Vaughan AS, Kramer MR, Sanchez TH, Sullivan PS (2014) Use of a Google Map Tool Embedded in an Internet Survey Instrument: Is it a Valid and Reliable Alternative to Geocoded Address Data? JMIR Res Protoc 3(2): e24.
- Kobayashi S, Fujioka T, Tanaka Y, Inoue M, Niho Y, et al. (2010) A geographical information system using the Google Map API for guidance to referral hospitals. J Med Syst 34(6): 1157-1160.
- Andrich D(1978) A rating scale formulation for ordered response categories. Psychometrika 43(4): 561-573.
- Lindsey D (1982) Further evidence for adjusting for multiple authorship. Scientometrics 4(5): 389-395.
- BatageljV, MrvarA (2003) Pajek - Analysis, and Visualization of Large Networks. In Jünger, M, Mutzel, P, (Eds.) Graph Drawing Software, Springer, Berlin, Pp.77-103.
- Freeman LC (1979) Centrality in social networks conceptual clarification. Soc Networks 1(3): 215-239.
- Otte E, Rousseau R (2002) Social network analysis: a powerful strategy, also for the information sciences. J Inform Sci 28(6): 441-453.
- Zhang C, Yu Q, Fan Q, Duan Z (2013) Research collaboration in health management research communities. BMC Med Inform Decimas 13: 52.
- Kendall MG, Babington SB (1939) The Problem of m Rankings. The Annals of Mathematical Statistics 10(3): 275-287.
- Zaiontz C, Kendall’s Coefficient of Concordance (W). Real Statistics Using Excel.
- Santi PA, Duvall AJ (1978) Stria vascularis pathology and recovery following noise exposure. Otolaryngology 86(2): ORL354-61.
- Hirsch JE (2005) An index to quantify an individual’s scientific research output. Proc Natl Acad Sci USA 102: 16569-16572.
- Lippi G, Mattiuzzi C (2017) Scientist impact factor (SIF): a new metric for improving scientists’ evaluation ?Ann Transl Med 5(15): 303.
- Pan RK, Fortunato S (2014 ) Author Impact Factor: tracking the dynamics of individual scientific impact. Sci Rep 4: 4880.
- Egghe L (2006) Theory and practise of the g-index. Scientometrics 69(1): 131-152.
- Fenner T, Harris M, Levene M, Bar Ilan J (2018) A novel bibliometric index with a simple geometric interpretation. PLoS One 13(7): e0200098.
- Belikov AV, Belikov VV (2015) A citation-based, author- and agenormalized, logarithmic index for evaluation of individual researchers independently of publication counts. F1000Research 4: 884.
- Strahler Rivero T, Herrera Nuñez LM, Uehara Pires E, Amodeo Bueno OF (2015) ADHD Rehabilitation through Video Gaming: A Systematic Review Using PRISMA Guidelines of the Current Findings and the Associated Risk of Bias .Front Psychiatry 6: 151.
- Angus C, Latimer N, Preston L, Li J, Purshouse R (2014) What are the Implications for Policy Makers? A Systematic Review of the Cost- Effectiveness of Screening and Brief Interventions for Alcohol Misuse in Primary Care. Front Psychiatry 5: 114.
- Sekercioglu CH (2008) Quantifying coauthor contributions. Science 322 (5900): 371.
- Egghe L (2006) Theory and practise of the g-index. Scientometrics 69(1): 131-152.
- Petersen AM, Wang F, Stanley HE (2010) Methods for measuring the citations and productivity of scientists across time and discipline. Phys Rev E Stat Nonlin Soft Matter Phys 81(3 Pt 2): 036114.
- Batista PD, Campiteli MG, Kinouchi O (2006) Is it possible to compare researchers with different scientific interests?. Scientometrics 68 (1): 179-189.
- Sidiropoulos A, Katsaros D, Manolopoulos Y (2007) Generalized Hirsch h-index for disclosing latent facts in citation networks. Scientometrics 72 (2): 253-280.
- Jayant SV (2005) V-index. A fairer index to quantify an individual’s research output capacity. BMJ 331 (7528): 1339.
- Vavryčuk V (2018) Fair ranking of researchers and research teams. PLoS One 13(4): e0195509.
- Hagen NT (2008) Harmonic allocation of authorship credit: sourcelevel correction of bibliometric bias assures accurate publication and citation analysis. PLoS One 3(12): e4021.
- Ryan AF, Bone RC (1978) Potentiation of kanamycin ototoxicity by a history of noise exposure. Otolaryngology 86(1): ORL-125-128.
- Bone RC, Ryan AF (1978) Audiometric and histologic correlates of the interaction between kanamycin and sub traumatic levels of noise in the chinchilla. Otolaryngology 86(3 Pt 1): ORL400-4.


