Identification of ceRNA Regulatory Network in Alcohol-Related Hepatocellular Carcinoma
Jinxian Fu and Zhengwei Su*
Department of Neurology, The Seven Affiliated Hospital, Sun Yat-Sen University, China
Submission:September 12, 2023;Published:October 09, 2023
*Corresponding author:Zhengwei Su, The Seventh Affiliated Hospital, Sun Yat-sen University, Shenzhen, Guangdong Province, 518107, China.
How to cite this article:Jinxian F, Zhengwei S. Identification of ceRNA Regulatory Network in Alcohol-Related Hepatocellular Carcinoma. Glob J Intellect Dev Disabil. 2023; 12(4): 555845. DOI:10.19080/GJIDD.2023.12.555845
Abstract
Background and aims Alcohol use disorder (AUD) is a major risk factor for hepatocellular carcinoma (HCC). The number of alcohol abuse in various countries is increasing year by year, which brings an increased risk of alcohol-related HCC. In HCC, numerous studies demonstrate that non-coding RNA (ncRNA) was linked to the process of development, progression, and invasion. So far, there is no study addressing the roles of ncRNA in alcohol-related HCC pathogenesis. Our aim in this study was to establish the potential mRNA-miRNA-lncRNA regulatory network of alcohol-related HCC. Methods Retrieve high-throughput sequencing data of alcohol-related HCC from the TCGA and HCBBD databases and analyze the expression difference of the sequencing data through R software. Protein–protein interaction (PPI) networks of differentially expressed genes (DEGs) were constructed by STRING. Cytoscape was used to determine hub module of the network. Functional enrichment analysis and survival analysis were utilized to screen the key DEGs in the module. The miRNet and starBase databases were used to predict the potential miRNA-mRNA and miRNA-lncRNA binding relationships, respectively. The predicted results were used for co-expression analysis with the differentially expressed miRNA and lncRNA selected from the TCGA database, and finally the ceRNA regulatory network of alcohol-related HCC was constructed through the mutual combination of miRNA, mRNA and lncRNA. GSE50579 was used to verify the mRNA expression of the regulatory network. Results We have established a ceRNA regulatory network involving lncRNA (AL050341.2, AC024075.2), mRNA (ANLN, MCM3) and miRNA (mir-497-5p, let-7b-5p). Our study showed that AL050341.2 and AC024075.2 acted as a competitive endogenous RNA (ceRNA) for mir-497-5p and let-7b-5p, respectively, resulting in the overexpression of ANLN and MCM3. Activation of this ceRNA regulatory network indicates a poor prognosis for patients with alcohol-related HCC. Conclusions We suggest that this ceRNA regulatory network was involved in the pathological process of alcohol-related HCC and its possibilities as a new target for alcohol-related HCC prevention, diagnostic and therapeutic treatment.
Keywords: Cytoscape; Proliferation; Alcoholic steatohepatiti; Kaplan–meier curve; Pancreatic cancer
Abbreviations: BP: Biological Process; CC: Cellular Component; DEG: Differentially Expressed Gene; DE-miRNA: Differentially Expressed miRNA; DE-lncRNA: Differentially Expressed lncRNA; MF: Molecular Function; GEO: Gene Expression Omnibus; HR: Hazard Ratio; HBV: Hepatitis B virus; HCV: Hepatitis C virus; HCC: Hepatocellular Carcinoma; KEGG: Kyoto Encyclopedia of Genes and Genomes; KM Plotter: Kaplan–Meier plotter; PPI: protein–protein interaction; TCGA: The Cancer Genome Atlas; miRNA: microRNA
Mini Review
HCC, as one of the most common primary liver cancers, accounts for approximately 70-90% of the total incidence of primary liver cancers around the world [1]. It predicts that HCC ranks fourth in global cancer-related death. Numerous risk factors such as hepatitis viruses (HBV/HCV) infection, alcohol abuse, smoking, and aflatoxin B1 intake are closely linked to the occurrence of liver cancer. At present, more research on HCC is focused on HBV and HCV infection-related HCC. However, the potential molecular mechanism of alcohol-related HCC is not yet sufficient, and further research should be conducted. Non-coding RNA is a compilation of a variety of RNAs that do not encode proteins, including rRNA, tRNA, snRNA, snoRNA, MicroRNA(miRNA) and lncRNA. The function of ncRNA is not presently fully understood [2]. The majority of studies have concentrated on two types of miRNA and lncRNA in the ncRNA family. MiRNA is a small non-coding single- stranded RNA molecule with a length of about 22 nucleotides encoded by endogenous genes. It speculates that miRNA regulates one-third of human genes [3,4]. It is currently known that miRNA is involved in various pathological processes of disease, such as differentiation, proliferation, apoptosis, migration, and invasion[5].
Meanwhile, studies in recent decades have shown that miRNA is closely related to the occurrence and development of cancer [6,7]. For HCC, current research has shown that miR-122 could be a biomarker for HCC, which was a significantly lower expression in HBV-related HCC liver tissues [8]. Increased expression of miR-452 predicted poor overall survival of HCC patients. Others, including miR-15b, miR-18a, miR-122, miR-223, and miR-375 have been shown to be involved in the pathological development of HCC [9]. LncRNA exerts its biological function mainly by combining DNA, RNA, and protein. Current research proves that lncRNA is involved in a variety of cancer pathological processes, such as proliferation, evasion of apoptosis, accelerating angiogenesis, invasion, and metastasis [10]. In lncRNA, the hypothesis of ceRNA occupies an important position that reveals a mechanism of interaction between RNAs. miRNA interferes with gene expression by binding to mRNA, leading to translational arrest and mRNA degradation and ceRNA can regulate gene expression by competitively binding miRNA. LncRNA can act as ceRNA and combined with miRNA through microRNA response elements (MREs) to modulate the expression of miRNA-targeted genes [11]. Some studies have shown that hepatitis virus can regulate lncRNAs transcription in the process of causing HCC. For example, HBV X protein (HBx) can up-regulate HUR1, and HUR1 can block p53 to promote HCC growth [12]. For HCV infection, studies have shown that it will upregulate the expression of various lncRNAs such as IFI6, CMPK2, and EGOT, resulting in immunosuppression [13,14].
Studies also proved the potential of lncRNA serves as HBV/ HCV-related HCC diagnostic or prognostic biomarkers [15]. The current research on the ceRNA network in HCC is mostly focused on the study of HBV / HCV infection-related mechanisms. As far as we know, there is no clear research on alcohol-related HCC. However, long-term drinking (drinking> 40g of pure alcohol per day) can significantly increase the risk of alcoholic liver disease (ALD) [16]. Some people will develop into Alcoholic Steatohepatitis (ASH), and persistent chronic liver injury will eventually lead to HCC. Studies have also demonstrated that longterm drinking of more than 80 g/day of pure alcohol over 10 years would increase the hazard of HCC by about 5 times. The global drinking situation in the future is not optimistic. Some studies predict that the global consumption of alcohol will still show an upward trend in the next decade [17]. With the increased number of alcoholics, the future HCC caused by alcohol-related factors will further increase. Therefore, it is of great importance to study the mechanism of alcohol in HCC, establish predictive models and screen effective biomarkers.
Materials and Methods
Identification of differentially expressed genes
In order to screen the high-throughput sequencing data of alcohol-related HCC, we searched all HCC sample data in The Cancer Genome Atlas (TCGA) and Integrative Molecular Database of Hepatocellular Carcinoma (HCCDB) databases, the inclusion criteria were patients pathologically diagnosed with HCC with alcohol abuse history; the exclusion criteria were HBV or HCV infection history. Differentially expressed genes (DEGs) between HCC and normal tissues were identified using the limma package in R software (version 3.6.2), the inclusion criteria were log2FC> 1and p value <0.05. The HCC-related genes predicted in the Gene Cards database (integrating data of about 125 network-sourced genes) were used to exclude non-tumor-related mRNAs, and the intersection of the three databases was selected as DEGs of alcohol-related HCC. Venn graph was produced by online tools (http://bioinformatics.psb.ugent.be/webtools/Venn/). STRING database was used to build a PPI network [18]. Select PPI nodes with a comprehensive score ≥ 0.4 for further analysis. Using the MCODE function of Cytoscape software (version 3.7.2), according to the degree of node enrichment, to identify the core module.
Gene set enrichment analysis (GESA)
Using Web Gestalt (WEB-based Gene SeT Analysis Toolkit) which is a functional enrichment analysis online tool (http:// www.webgestalt.org/) to conduct DEG GO and KEGG pathway enrichment analysis [19]. GO’s analysis results are three types of analysis including biological process (BP), cell component (CC) and molecular function (MF) to screen the genes with important biological functions in the core modules, p value<0.05 was considered statistically significant.
Kaplan–meier curve analysis of DEGs
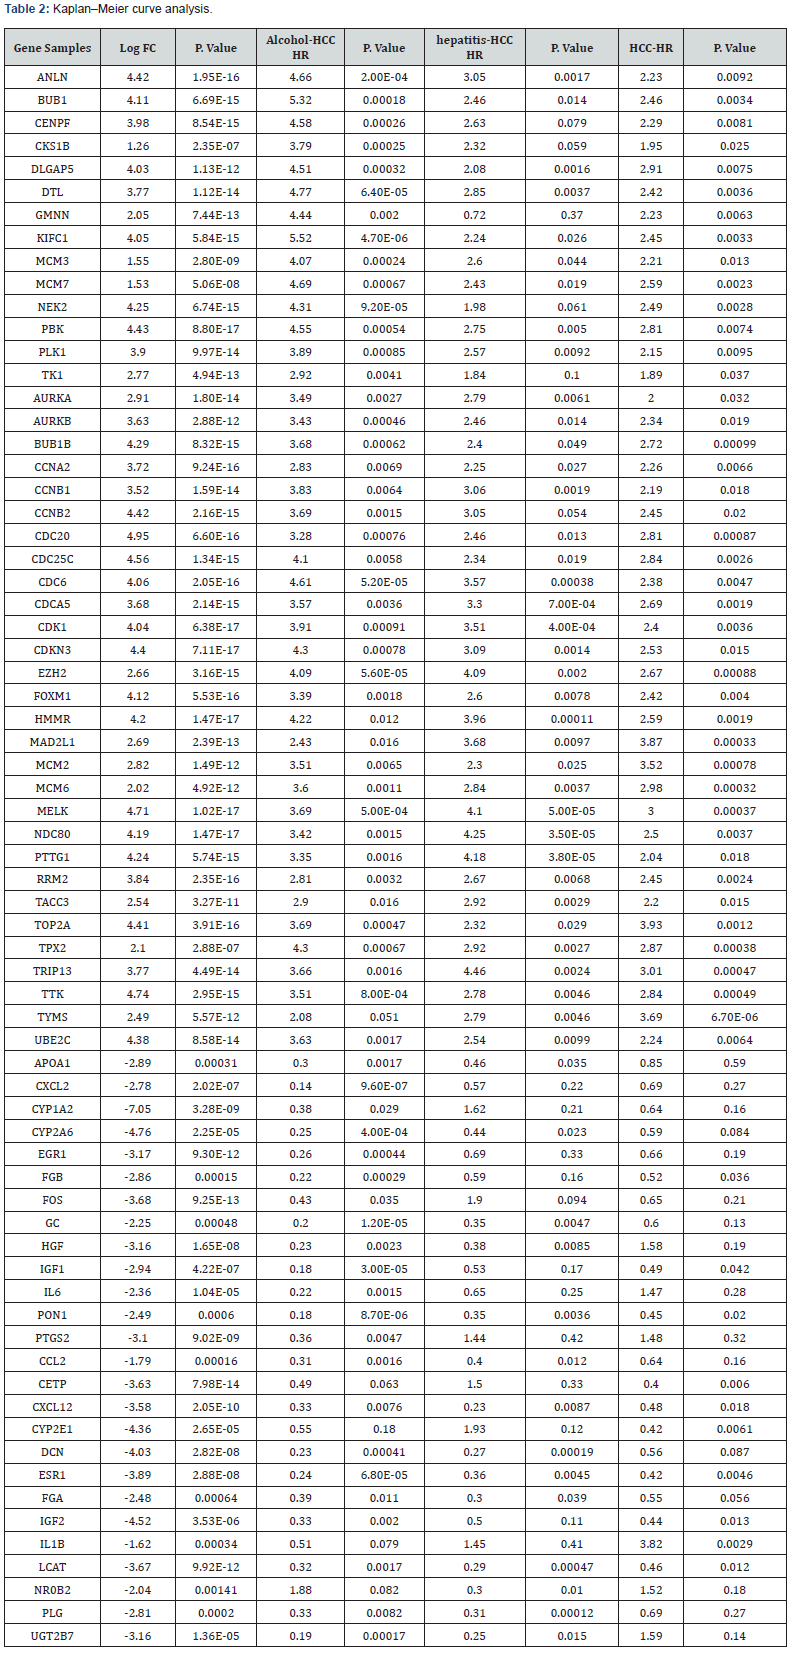
Survival analysis was performed on DEGs screened by GESA. Because the survival information of patients in the HCCDB database was incomplete, Kaplan-Meier Plotter based on the survival data of the TCGA database was used for survival analysis. Cancer samples were divided into three groups based on Clinical data: alcohol-related HCC group (with alcohol abuse history without HBV and HCV), Hepatitis virus infection-related HCC group (with HBV and HCV infection without alcohol abuse history), HCC group (without HBV/HCV infection and alcohol abuse history) based on the expression of genes to plot survival curves. p value < 0.05 was regarded as statistically significant [20]. The DEGs whose HR value in the OS analysis of the alcohol-related HCC group was more than 1.5 times that of the other two groups were selected to construct mRNA-miRNA prediction model.
Identification of differentially expressed miRNAs and differentially expressed lncRNAs
According to the selected alcohol-related HCC sample information, download miRNA and lncRNA sequencing data from the TCGA database, and use the “LIMMA” package in R software to identify differentially expressed miRNAs (DE-miRNAs) and differentially expressed lncRNAs (DE-lncRNAs) between tumor tissue and normal tissue, log2FC> 1 and p value <0.05 were set as the selection criterion.
Combination prediction of miRNA and mRNA
Use the miRNet website online tool to predict the probable binding relationship between DE-mRNA and miRNA. This tool is a network tool for visual statistical analysis and functional research. Its prediction results are based on the miRTarBase database (based on the experimentally verified miRNA-mRNA binding relationship) [21]. Through the same expression analysis between the predicted results and the results screened in the TCGA database, using the reverse regulation relationship between miRNA and mRNA, miRNAs with the same expression trend were selected for further analysis.
Combination prediction of miRNA and lncRNA
Perform survival analysis on the selected DE-miRNAs, select the statistically significant miRNAs to establish the association with lncRNAs, and use the starBase database to predict the potential binding relationship between DE-lncRNAs and miRNAs, which collected gene expression data of 32 cancers and from multi-dimensional sequencing data, more than 1.1 million miRNAncRNA binding relationships have been identified. Through the same expression analysis between the predicted results and the results screened by the TCGA database, using the positive regulation relationship between lncRNA and mRNA, lncRNAs with the same expression trend were selected to construct the lncRNAmiRNA- mRNA regulatory network.
Construction of lncRNA-miRNA-mRNA regulatory network
Based on the predicted relationship results of miRNA-mRNA and miRNA-lncRNA, the lncRNA-miRNA-mRNA network was constructed and visualized using Cytoscape software (version 3.8.2). Because lncRNA can only serve as a node of the ceRNA network in the cytoplasm, we use the LncExpDB database to subcellular localization of lncRNA (LncExpDB is a comprehensive database for lncRNA expression. It currently houses expression profiles of 101,293 high-quality human lncRNA genes derived from 1,977 samples of 337 biological conditions across nine biological contexts) [22,23]. We further performed Kaplan–Meier curve analysis of DE-lncRNAs located in the cytoplasm.
Establish a ceRNA regulatory network for alcoholrelated HCC
Finally, the alcohol-related HCC ceRNA regulatory network was constructed according to the regulatory relationship between miRNA-mRNA and miRNA-lncRNA and the predicted mRNA-lncRNA binding relationship in the LncExpDB database. In checking the expression of mRNA in the ceRNA network, we retrieve all expression matrix data related to mRNA in HCC from the GEO database. We only selected samples diagnosed as HCC with alcohol abuse history and no history of hepatitis B and C infections.
Finally, only the microarray dataset GSE50579 met our criteria for subsequent analysis. Dataset GSE50579 was based on the platform of GPL4550 (Agilent-028004 Sure Print G3 Human GE 8x60K Microarray). The genome-wide gene expression of 61 human HCCs was analyzed, which contained 10 alcohol-related HCC samples and 10 health samples.
Statistical analysis
Most of the statistical results have been done through R software and online tools, and log2FC> 1 and p value <0.05 were considered statistically significant when performing Gene expression differential analysis. HR>1 and p value <0.05 was considered as statistically significant for Kaplan–Meier curve analysis. GraphPad Prism 9 software was used for t-test, and the visual display was mainly based on Cytoscape software.
Results
Screening for DEGs from TCGA and HBCCD databases
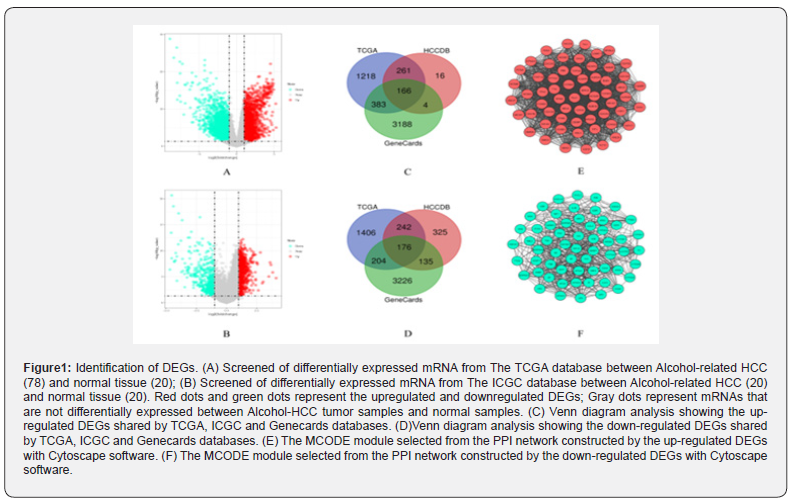
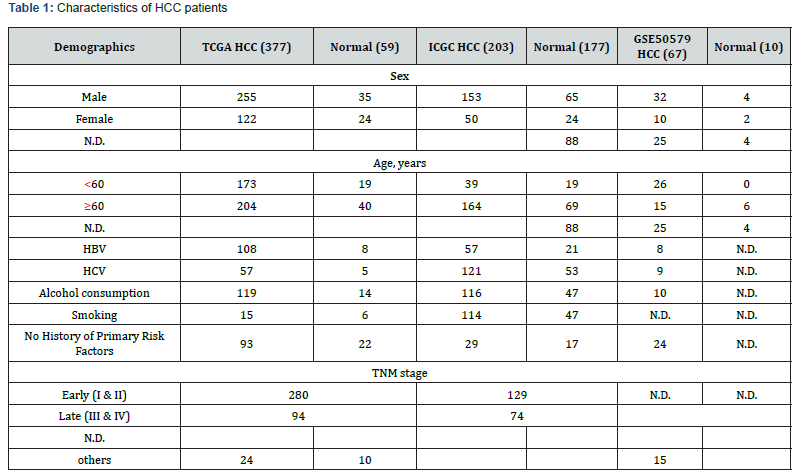
Download the original RNA-seq data from the TCGA database which contains 92 normal samples and 377 HCC tumor samples. There are 78 tumor tissue samples that satisfy the inclusion criteria. The HCCDB database contains 177 normal samples and 203 HCC tumor samples. There are 20 tumor tissue samples included in the standard and detailed clinical data of HCC samples are shown in Table 1. DEGs analyses in tumor tissue and adjacent normal liver-tissue samples from the TCGA and HCBBD data sets were performed using R with Limma Package (Log2FC >1 and p value<0.05). We identified 4056 DEGs in TCGA data set and 1325 DEGs in HCBBD data set. We selected liver cancer as keywords to screen for HCC-related genes in the Gene Cards database by using HCC, hepatocellular carcinoma and selected the genes with relevance score> median (1.62). We identified 3741 HCC-related genes. Venn diagram tool was used to screen overlapping DEGs. Finally, a total of 342 alcohol related DEGs were screened out, consisting of 166 upregulated genes and 176 downregulated genes. DEGs were submitted to STRING tool to construct a PPI network. We screened out the core modules in the PPI network through the MCODE function in Cytoscape software, which contains 61 up-regulated DEGs and 64 down-regulated DEGs, as shown in Figure 1.
Functional enrichment analysis and Kaplan–Meier curve analysis
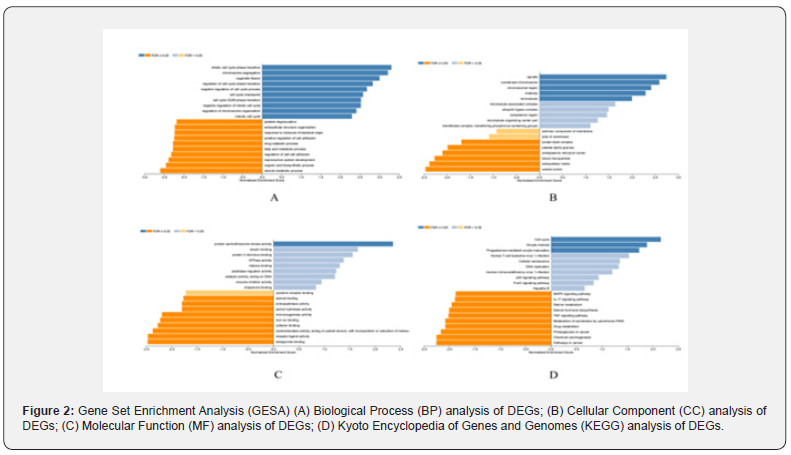
We used Web Gestalt to make a functional enrichment analysis of candidate target genes. GO functional annotation analysis results show these functions in a concentrated way. For the upregulated mRNAs, it displayed that ‘mitotic cell cycle phase transition’, ‘regulation of cell cycle phase transition’ and ‘cell cycle G2/M phase transition’ were more enrichment in the biological process (BP), ‘spindle’ and ‘condensed chromosome’ were more enrichment in the cellular component (CC), and ‘protein serine/ threonine kinase activity’ were enrichment in the molecular function (MF). For the downregulated-mRNAs, it also shown that ‘steroid metabolic process’ and ‘regulation of cell-cell adhesion’ were enriched in the BP, ‘vesicle lumen’ and ‘extracellular matrix’ were enriched in the CC, and ‘monooxygenase activity’ and ‘receptor ligand activity’ were enriched in the MF. KEGG pathway analysis showed the most enriched pathways were ‘cell cycle’, ‘p53 signaling pathway’, ‘FoxO signaling pathway’, ‘JAK-STAT signaling pathway’, ‘Chemical carcinogenesis’, ‘Pathways in cancer’ and ‘Proteoglycans in cancer’ for the downregulated and upregulated DE-mRNAs successively, as shown in Figure 2. Based on the results of gene enrichment analysis, we selected 69 mRNAs with important biological functions for Kaplan–Meier curve analysis. According to the selection criteria of alcohol-related groups, a total of 27 DEGs were screened out, consisting of 14 upregulated genes and 13 downregulated genes. As shown in Table 2.
Screening for DE-miRNAs and DE-lncRNAs
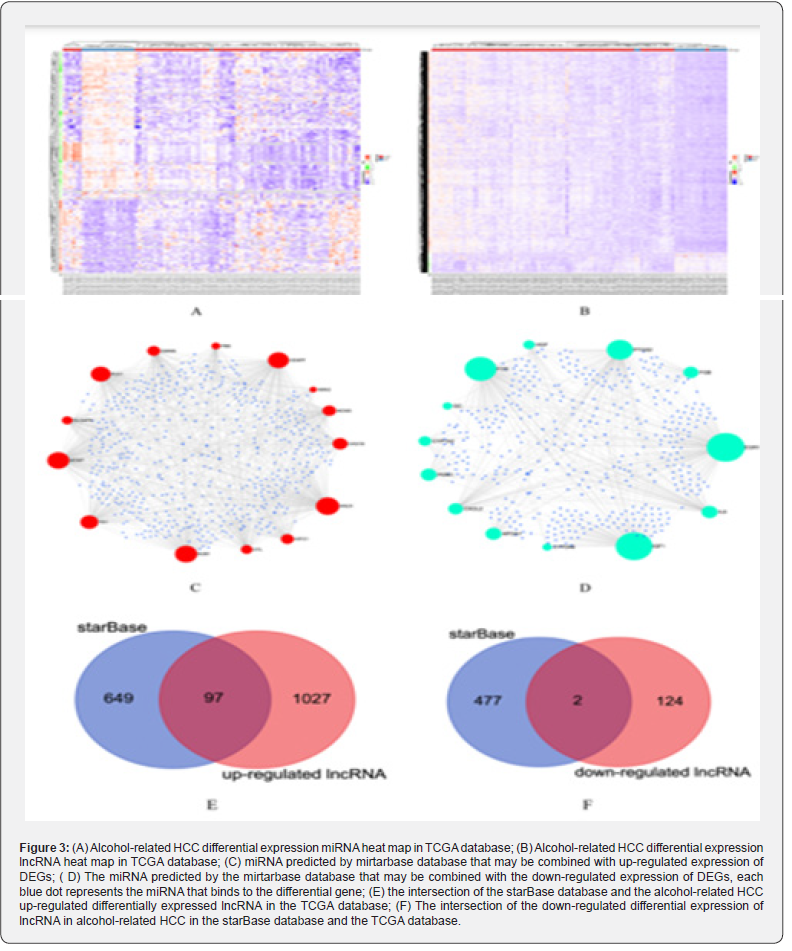
We used the Limma package to perform differential expression analysis to compare the HCC tumor samples with alcohol abuse history and the normal samples and the inclusion criteria were log2FC> 1and p value <0.05. We screened out 131 DE-miRNAs which consisted of 33 upregulated miRNAs and 98 downregulated miRNAs and 1250 DE-lncRNAs consisting of 1124 upregulated lncRNAs and 126 downregulated lncRNAs. Figure3A and 3B show the Heatmap of DE-miRNAs and DE-lncRNAs, respectively.
Prediction of mRNAs targeted by miRNAs.
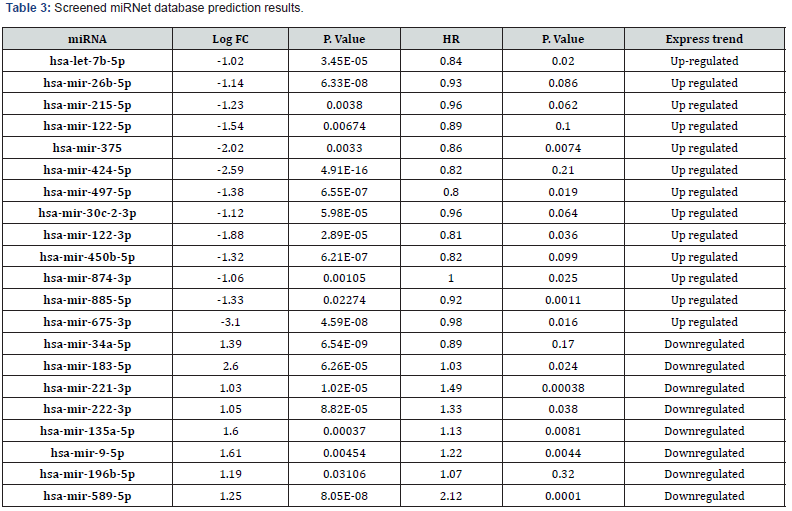
Figure 3C and Figure 3D show the prediction results of the binding relationship between DEGs, and miRNAs based on the miRTarBase database. Each blue dot represents the miRNAs that have been verified by experiments that can be bound to DEG. We compare the predicted results with those screened from the TCGA database. Finally, we got 21 DE-miRNAs (8 up-regulated expression, 13 down-regulated expression) and the results were shown in Table 3.
Prediction of mRNAs targeted by miRNAs and subcellular targeting of lncRNA
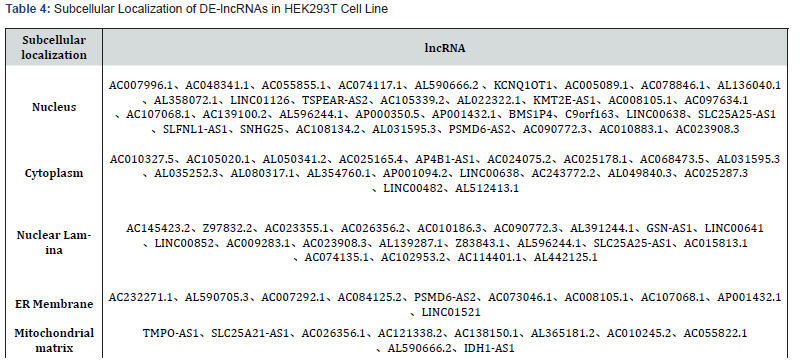
Figure 3E and Figure 3F show the prediction results of the binding relationship between DE-miRNAs and lncRNAs based on the starBase database. We compare the predicted results with those screened from the TCGA database. Finally, we got 99 DE-lncRNA (97 up-regulated expression, 2 down-regulated expression). Because only lncRNAs located in the cytoplasm can serve as nodes of the ceRNA network and we used the LncExpDB database to subcellular location of those selected DE-lncRNAs. A total of 29 lncRNAs located in the cytoplasm were screened. The detailed results are presented in Table 4.
Construction of mRNA-miRNA-lncRNA regulatory network
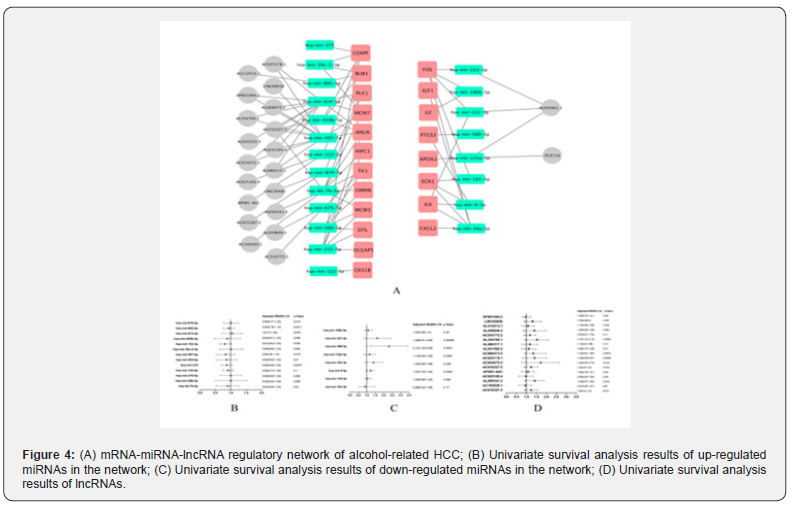
Based on the binding relationship of mRNA, miRNA and lncRNA, we initially constructed the mRNA-miRNA-lncRNA regulatory network of alcohol-related HCC, as shown in Figure 4A. Because miRNAs play an intermediate regulatory role in the network, we further performed a single-factor survival analysis on the miRNAs in the network. The results are shown in Figure 4B and Figure 4C. We obtained a total of 13 miRNAs with statistically significant HR values (6 up-regulated expression, 7 down-regulated expression). Then, univariate survival analysis was performed on these 13 miRNA-related lncRNAs, and finally we obtained 9 statistically significant lncRNAs, the results were shown in Figure 4D.
Construction of a ceRNA regulatory network for alcohol-related HCC
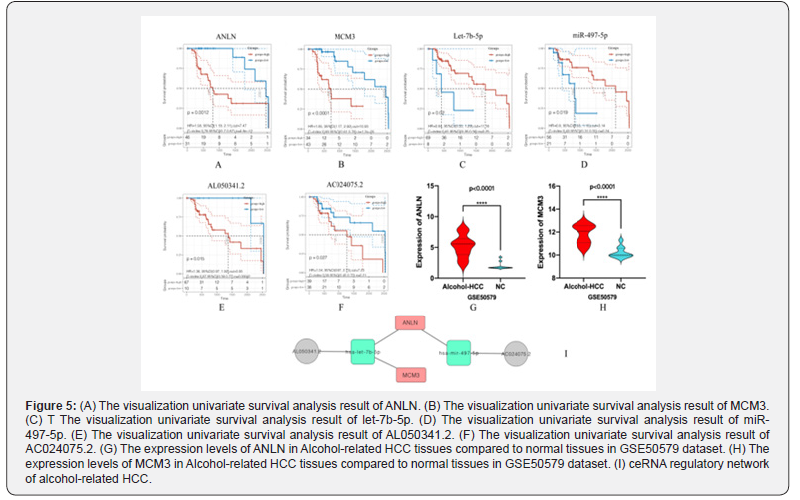
We finally screened two miRNAs (let-7b-5p, mir-497-5p) in the constructed mRNA-miRNA-lncRNA regulatory network. These two miRNAs were involved in regulating mRNA: ANLN, MCM3, MCM7, GMNN, TK1 and the expression of PLK1, and its regulation process may involve lncRNA (AC010327.5, AL050341.2, AC010327.5, AC024075.2, AC025178.1, AC068473.5, AL354760.1, AC243772.2, AL049840.3). To determine the regulatory relationship between lncRNA and mRNA, we analyzed the possibility of lncRNA-mRNA interaction through the LncExpDB database (LncExpDB predicts lncRNA-mRNA interactions based on co-expression networks. Co-expressions relationships between lncRNAs and mRNAs are identified using the Pearson correlation coefficient (adjusted p value < 0.01 and r>=0.5). It is noted due to the extremely small sampling size (n = 4). Finally, we constructed an alcohol-related HCC ceRNA regulation network that consisting of two lncRNAs (AL050341.2, AC024075.2), two miRNAs (let-7b-5p, miR-497-5p) and two mRNAs (ANLN, MCM3), detailed regulation relationships were shown in Figure 5I. Figures 5A-5F showed the results of univariate survival analysis of genes involved in the ceRNA network. To further determine the expression of mRNA in the network, we use the GSE50579 data set to verify the expression of MCM3 and ANLN. The results show that MCM3 and ANLN were significantly highly expressed in alcohol-related HCC samples, as shown in Figure 5G and Figure 5H.
Discussion
The Lancet published a review of the risks between alcohol intake, mortality, disability, and disease from more than 694 data sources of 195 countries and regions from 1990 to 2016. This research has shown that alcohol is a major health hazard, and there is no so-called safe zone for drinking [24]. Drinking is the seventh leading cause of human death and disability. Among 15-49-year-olds, alcohol is the biggest killer. On a global scale, the average pure alcohol consumption (for those over 15 years old) is 6.2 liters per person per year. The per capita consumption in the WHO European Region is 10.9 liters per person per year [16]. As estimated by the Global Burden of Disease organization, there were 30% of death caused by HCC associated with alcohol [25]. Alcohol abuse can not only directly increase the risk of liver cancer, but also increases the impact of other risk factors. Studies have shown that alcohol abuse can significantly increase the risk of HCC of the patients who have HBV or HCV infection history. Due to late diagnosis and poor therapy response, the five-year survival rate of HCC patients lowers than 20% [2]. Growing evidence supports a significant link between mRNA-miRNA-lncRNA regulatory network and the pathological development of tumors. Meanwhile, it has great value for the occurrence, development, and prediction of HCC. However, most studies have focused on the study of the mechanism of HCC caused by hepatitis virus infection, and there is no clear research on alcohol-related HCC [8,9,26- 29]. Combined with the growing alcohol abuse burden across the world, we finally established a ceRNA regulatory network for alcohol-related HCC. The genes involved in the network were involved in the pathological process of alcohol-related HCC and can predict the prognosis of alcohol-related HCC patients.
We searched multiple databases including GEO, TCGA, HCDDB, and finally screened out hub mRNAs related to the prognosis of alcohol-related HCC through a variety of methods. MCM3 belongs to the MCM2-7 complex. Previous studies have shown that in oral squamous cell carcinoma, osteosarcoma, glioma and other tumors and up-regulated expression of MCM3 indicates a poor prognosis which may be related to its ability to promote cell migration and invasion [30]. Although many studies support that MCM3 can be used as a prognostic marker of HCC. However, these studies did not distinguish the main pathogenic factors of HCC in detail and did not consider alcohol intake as an independent risk factor. At the same time, these studies only judge whether MCM3 can be used as a prognostic factor of HCC, but the mechanism of MCM3 in HCC progression is far from being adequately elucidated [31,32,33]. ANLN is an evolutionary conserved actin binding protein, which can be used as a key mediator of cytokinesis. It can bind all three types of actin filaments and other cytoskeleton components, and act as a scaffold protein to participate in cytokinesis [34]. Studies have shown that overexpression of ANLN promotes tumor growth and can be used as an independent prognostic marker for the prognosis of breast cancer patients [35]. In HCC, ANLN may mediate abnormal cell division in the cell cycle and participate in the pathological process of HCC. Blocking the expression of ANLN will reduce tumor occurrence and growth and may extend overall survival [36,37]. The functions of the above two mRNAs were basically the same as the results of our gene function enrichment analysis. In our study, although the up-regulated expression of MCM3 and ANLN in the hepatitis virus infection and alcoholrelated HCC groups both indicate a poor prognosis.
Some studies have shown that mir-497-5p and let-7b-5p were involved in the growth and metastasis of HCC. For mir-497- 5p, studies have shown that its down-regulation can cause CRIF1 overexpression in HCC cells. CRIF1 can play a carcinogenic effect by activating the ROS/NFKB pathway, suggesting a poor prognosis for HCC patients [38]. The study by Min et al. proved that miR- 497-5p can interact with LG1-AS1, and down-regulated miR-497- 5p will increase the growth and migration of HCC cells promoted by LG1-AS1[39]. Currently, it is known that the let-7 family was involved in the occurrence and development of a variety of cancers, including breast cancer, glioma, pancreatic cancer, and reproductive system tumors, but there was no research on let-7b- 5p in HCC [40-42]. Studies demonstrated that miR-497 and let-7 were involved in alcohol-induced liver damage. Research by Yong Deuk Kim et al showed that the overexpression of miR-497 can reduce the excessive production of bile acids in the liver caused by alcohol stimulation and inhibiting the expression of miR-497 can reverse this process, which may be regulated by miR497- BTG2-YY1 signaling pathway [43]. Kelly et al. reported that let-7/ Lin28 axis participates in the process of liver damage caused by alcohol. Alcohol abuse can significantly reduce the expression of let-7 family (including let-7a, let-7b and let-7g) in liver tissues. The low expression of let 7 will cause the increase of Lin28B, and the over-expressed Lin28B will further induce the fibrosis of human hepatic stellate cells (HSCs) and aggravate liver damage [44]. In our research, it can be observed that in the alcohol-related HCC group, the Let-7 family (let-7g-3p, let-7c-5p, let-7c-3p, let- 7i-3p, let-7b-3p, let -7b-5p) were significantly low expression. The above results were not obtained in the hepatitis-related HCC group and the HCC group, suggesting the correlation between the let-7 family and alcohol-related HCC. Finally, we determined that mir-497-5p and let-7b-5p as biomarkers of alcohol-related HCC and intermediate regulatory miRNAs in the ceRNA network.
LncRNA has a variety of biological functions, and its biological function is mainly related to the position in the cell. Only lncRNA located in the cytoplasm can serve as a node of the ceRNA network. Through univariate survival analysis of lncRNAs located in the cytoplasm, and then based on the prediction function of the lncRNA-mRNA co-expression network in the LncExpDB database. We finally determined that AL050341.2 and AC024075.2 as miRNA sponges competing with mRNA. We speculate that lncRNAs (AL050341.2, AC024075.2) overexpressed in tumor samples of alcohol-related HCC can adsorb let-7b-5p and mir-497- 5p and reduce their expression levels. Down-regulation of let-7b- 5p and mir-497-5p can lead to the overexpression of MCM3 and ANLN, and activate various biological processes including tumor cell migration, invasion, and cell cycle G2/M phase transition to accelerate tumor progression.
There were some limitations to this study.
i. The analysis results of the ceRNA network are lacking in
vivo and in vitro experiments to verify.
ii. The biological process of alcohol participating in HCC is
not yet clear, it is necessary to further establish a reliably related
liver cancer model to verify this hypothesis.
iii. Due to the small sample size involved in the study and
the lack of some clinical data, a complete predictive model cannot
be established to detect the predictive performance of ceRNA.
In this study, we established a ceRNA regulatory network for alcohol-related liver cancer, which was involved in the pathological process of alcohol-induced HCC, and the network can be used as a biomarker to predict the prognosis of alcohol-related HCC. Different from previous studies. We used HBV/HCV infection and no risk factors as research variables when studying the mechanism of alcohol-related HCC. We screen out the genes most related to alcohol intake through a variety of effective methods. Finally, a ceRNA regulatory network for HCC related to alcohol intake was constructed. The genes involved in this network have important biological functions and can be used as biomarkers to predict the prognosis of alcohol-related HCC. Our study provides a kind of potential target for diagnosis and therapy of patients with alcohol-related HCC.
Declarations
Funding: No fund for this paper Conflicts of interest: No actual or potential Conflicts of interests/Competing interests exist for any authors on this paper Ethics approval: Not applicable Consent to participate: Not applicable Availability of data and material: Not applicable Code availability: Not applicable.
References
- Montagner A, Le Cam L, Guillou H (2019) β-catenin oncogenic activation rewires fatty acid catabolism to fuel hepatocellular carcinoma. Gut 68(2): 183-185.
- Klingenberg M, Matsuda A, Diederichs S, Patel T (2017) Non-coding RNA in hepatocellular carcinoma: Mechanisms, biomarkers, and therapeutic targets. J Hepatol 67(3): 603-618.
- Lou W, Liu J, Gao Y, et al. (2018) MicroRNA regulation of liver cancer stem cells. Am J Cancer Res 8(7): 1126-1141.
- Morceau F, Chateauvieux S, Gaigneaux A, Dicato M, Diederich M (2013) Long and short non- coding RNAs as regulators of hematopoietic differentiation. Int J Mol Sci 14(7): 14744-14770.
- Giovannetti E, Erozenci A, Smit J, Danesi R, Peters GJ (2012) Molecular mechanisms underlying the role of microRNAs (miRNAs) in anticancer drug resistance and implications for clinical practice. Crit Rev Oncol Hematol 81(2):103-122.
- Sun Z, Shi K, Yang S, et al. (2018) Effect of exosomal miRNA on cancer biology and clinical applications. Mol Cancer. 17(1): 147.
- Khan AQ, Ahmed EI, Elareer NR, Junejo K, Steinhoff M, Uddin S (2019) Role of miRNA-Regulated Cancer Stem Cells in the Pathogenesis of Human Malignancies. Cells 8(8): 840.
- Luo J, Chen M, Huang H, et al. (2013) Circulating microRNA-122a as a diagnostic marker for hepatocellular carcinoma. Onco Targets Ther 6: 577-583.
- Klingenberg M, Matsuda A, Diederichs S, Patel T (2017) Non-coding RNA in hepatocellular carcinoma: Mechanisms, biomarkers, and therapeutic targets. J Hepatol 67(3): 603-618.
- Huang Z, Zhou JK, Peng Y, He W, Huang C (2020) The role of long noncoding RNAs in hepatocellular carcinoma. Mol Cancer 19(1): 77.
- Tay Y, Rinn J, Pandolfi PP (2014) The multilayered complexity of ceRNA crosstalk and competition. Nature 505(7483): 344-352.
- Liu N, Liu Q, Yang X, Zhang F, Li X, Ma Y, et al. (2018) Hepatitis B virus-upregulated LNC-HUR1 promotes cell proliferation and tumorigenesis by blocking p53 activity. Hepatology 68(6): 2130–2144.
- Liu X, Duan X, Holmes JA, Li W, Lee SH, Tu Z, et al. (2019) A Long noncoding RNA regulates hepatitis C virus infection through interferon alpha-inducible protein 6. Hepatology 69(3): 1004-1019.
- Carnero E, Barriocanal M, Prior C, Pablo Unfried J, Segura V, Guruceaga E, et al. (2016) Long noncoding RNA EGOT negatively affects the antiviral response and favors HCV replication. EMBO Rep 17(7): 1013–1028.
- Lau CC, Sun T, Ching AK, He M, Li JW, Wong AM, et al. (2014) Viral-human chimeric transcript predisposes risk to liver cancer development and progression. Cancer Cell 25(3): 335–349.
- Seitz HK, Bataller R, Cortez-Pinto H, et al. (2018) Alcoholic liver disease. Nat Rev Dis Primers 4(1):16.
- Morgan TR, Mandayam S, Jamal MM (2004) Alcohol and hepatocellular carcinoma. Gastroenterology 127(5 Suppl 1): S87-S96.
- Szklarczyk D, Morris JH, Cook H, et al. (2017) The STRING database in 2017: quality-controlled protein-protein association networks, made broadly accessible. Nucleic acid Res 45(D1): D362-d368.
- GSEA was plotted by http://www.webgestalt.org/, an online platform for data analysis and visualization.
- Nagy A, Lánczky A, Menyhárt O, Győrffy B (2018) Validation of miRNA prognostic power in hepatocellular carcinoma using expression data of independent datasets, Scientific Reports 8: 9227
- Fan Y, Siklenka K, Arora SK, et al. (2016) miRNet - dissecting miRNA-target interactions and functional associations through network-based visual analysis. Nucleic acids research 44(W1): W135-141.
- (2021) LncExpDB: an expression database of human long non-coding RNAs. Nucleic Acids Res 49(D1).
- Database Resources of the National Genomics Data Center, China National Center for Bioinformation in 2021 Nucleic Acids Res 49(D1): D18-D28.
- (2018) GBD 2016 Alcohol Collaborators. Alcohol use and burden for 195 countries and territories, 1990-2016: a systematic analysis for the Global Burden of Disease Study 2016 [published correction appears in Lancet 392(10152): 1015-1035.
- Akinyemiju T et al. (2017) The burden of primary liver cancer and underlying etiologies from 1990 to 2015 at the global, regional, and national level. JAMA Oncol 3(12): 1683-1691.
- Dai M, Li L, Qin X (2019) Clinical value of miRNA-122 in the diagnosis and prognosis of various types of cancer. Oncol Lett 17(4): 3919-3929.
- Xu F, Zha G, Wu Y, Cai W, Ao J (2018) Overexpressing lncRNA SNHG16 inhibited HCC proliferation and chemoresistance by functionally sponging hsa-miR-93. Onco Targets Ther 11: 8855-8863.
- Roy S, Hooiveld GJ, Seehawer M, et al. (2018) microRNA 193a-5p Regulates Levels of Nucleolar- and Spindle-Associated Protein 1 to Suppress Hepatocarcinogenesis. Gastroenterology 155(6): 1951-1966.e26.
- Lou W, Liu J, Ding B, et al. (2019) Identification of potential miRNA-mRNA regulatory network contributing to pathogenesis of HBV-related HCC. J Transl Med 17(1): 7.
- Lau KM, Chan QK, Pang JC, Li KK, Yeung WW, et al. (2010) Minichromosome maintenance proteins 2, 3 and 7 in medulloblastoma: overexpression and involvement in regulation of cell migration and invasion. Oncogene 29(40): 5475–5489.
- Wang L, Zhou L, Hou J, Meng J, Lin K, Wu X, Chen X (2021) Three novel circRNAs upregulated in tissue and plasma from hepatocellular carcinoma patients and their regulatory network. Cancer Cell Int 21(1): 72.
- Li HT, Wei B, Li ZQ, Wang X, Jia WX, Xu YZ, et al. (2020) Diagnostic and prognostic value of MCM3 and its interacting proteins in hepatocellular carcinoma. Oncol Lett 20(6): 308.
- Yang Q, Xie B, Tang H, Meng W, Jia C, et al. (2019) Minichromosome maintenance 3 promotes hepatocellular carcinoma radio resistance by activating the NF-κB pathway. J Exp Clin Cancer Res 38(1): 263.
- Zhang S, Nguyen LH, Zhou K, Tu HC, Sehgal A, et al. (2018) Knockdown of Anillin Actin Binding Protein Blocks Cytokinesis in Hepatocytes and Reduces Liver Tumor Development in Mice Without Affecting Regeneration. Gastroenterology 154(5): 1421-1434.
- Magnusson K, Gremel G, Ryden L, et al. (2016) ANLN is a prognostic biomarker independent of Ki-67 and essential for cell cycle progression in primary breast cancer. Bmc Cancer 16(1): 904.
- Li L, Huang K, Zhao H, Chen B, Ye Q, Yue J. (2020) CDK1-PLK1/SGOL2/ANLN pathway mediating abnormal cell division in cell cycle may be a critical process in hepatocellular carcinoma. Cell Cycle 19(10): 1236-1252.
- Zhang S, Nguyen LH, Zhou K, Tu HC, Sehgal A, et al. (2018) Knockdown of Anillin Actin Binding Protein Blocks Cytokinesis in Hepatocytes and Reduces Liver Tumor Development in Mice Without Affecting Regeneration. Gastroenterology 154(5): 1421-1434.
- Chang H, Li J, Qu K, Wan Y, Liu S, et al. (2020) CRIF1 overexpression facilitates tumor growth and metastasis through inducing ROS/NFκB pathway in hepatocellular carcinoma. Cell Death Dis 11(5): 332.
- Min J, Jin D, Zhang F, Kang Y, Qi Y, Du P (2021) DLG1-AS1 is activated by MYC and drives the proliferation and migration of hepatocellular carcinoma cells through miR-497-5p/SSRP1 axis. Cancer Cell Int 21(1): 16.
- Li M, Zou X, Xia T, et al. (2019) A five-miRNA panel in plasma was identified for breast cancer diagnosis. Cancer Med 8(16): 7006-7017.
- Xi X, Chu Y, Liu N, et al. (2019) Joint bioinformatics analysis of underlying potential functions of hsa-let-7b-5p and core genes inhuman glioma. J Transl Med 17(1): 129.
- Gonzalez Dos Anjos L, de Almeida BC, Gomes de Almeida T, et al. (2018) Could miRNA Signatures be Useful for Predicting Uterine Sarcoma and Carcinosarcoma Prognosis and Treatment. Cancers (Basel) 10(9): 315.
- Kim YD, Hwang SL, Lee EJ, Kim HM, Chung MJ, et al. (2017) Melatonin ameliorates alcohol-induced bile acid synthesis by enhancing miR-497 expression. J Pineal Res 62(2).
- McDaniel K, Huang L, Sato K, Wu N, Annable T, et al. (2017) The let-7/Lin28 axis regulates activation of hepatic stellate cells in alcoholic liver injury. J Biol Chem 292(27): 11336-11347.


