




 CRDOJ Home




Abstract
Background and Objective: The Triglyceride-To-High-Density Lipoprotein Cholesterol (TG/HDL-C) ratio may help identify metabolic abnormalities. This study evaluated its association with insulin resistance and its discriminatory performance and optimal cutoff in young Mexican adults.
Materials and Methods: This cross-sectional study included 346 university students aged 18–30 years from the University of Guadalajara. Insulin resistance was defined as a homeostatic model assessment of insulin resistance (HOMA-IR) value >2.5. Associations were assessed using correlation and linear regression analyses. Discriminatory performance and the optimal cutoff were evaluated using Receiver Operating Characteristic (ROC) analysis and the Youden index.
Results: Participants had a mean age of 20.8 ± 2.0 years, and 73.7% were women. Overall, 23.1% met the criterion for insulin resistance. The TG/HDL-C ratio was higher in participants with insulin resistance than in those without it (2.35 ± 1.61 vs. 1.70 ± 1.00, p < 0.001) and was positively correlated with HOMA-IR (ρ = 0.246, p < 0.001). The area under the ROC curve was 0.635 (95% CI: 0.559–0.705). The optimal cutoff was 2.558, with 37.5% sensitivity and 86.8% specificity. In sex-stratified analyses, the AUC was 0.656 in women and 0.579 in men.
Conclusion: The TG/HDL-C ratio showed a modest association with insulin resistance and limited discriminatory ability. The cutoff had low sensitivity despite relatively high specificity; external validation is needed before application in other populations.
Keywords: Triglyceride-HDL-C ratio; Insulin resistance; HOMA-IR; Young adults; Metabolic risk
Abbreviations
AUC: Area under the receiver operating characteristic curve; BMI: Body mass index; CI: Confidence interval; HDL-C: High-density lipoprotein cholesterol; HOMA-IR: Homeostatic Model Assessment of Insulin Resistance; IR: Insulin resistance; NPV: Negative predictive value; PPV: Positive predictive value; ROC: Receiver operating characteristic; SD: Standard deviation; TG: Triglycerides; TG/HDL-C: Triglyceride-to-high-density lipoprotein cholesterol ratio; ρ: Spearman's rank correlation coefficient; β: Regression coefficient
Introduction
Metabolic syndrome is characterized by the coexistence of metabolic abnormalities, including insulin resistance, atherogenic dyslipidemia, central obesity, and arterial hypertension. The presence of these conditions increases the risk of cardiovascular disease and type 2 diabetes mellitus [1]. In recent decades, the increasing prevalence of overweight and obesity, together with unhealthy dietary habits and sedentary lifestyles, has contributed to the growing burden of metabolic disorders. Therefore, preventive strategies aimed at reducing these risk factors and their associated complications are essential [2].
Several biomarkers have been investigated to assess cardiometabolic risk. Among them, the Triglyceride-To-High-Density Lipoprotein Cholesterol Ratio (TG/HDL-C), calculated by dividing serum triglyceride concentrations by HDL-C concentrations, has emerged as a simple and accessible marker. Previous studies have reported associations between elevated TG/HDL-C ratios, insulin resistance, metabolic syndrome, and cardiovascular risk [3].
In a study of young Mexican adults, Murguía-Romero et al. [4] reported a metabolic syndrome prevalence of 13.4%. The authors evaluated several indicators associated with this condition, including the TG/HDL-C ratio, and reported diagnostic performance measures supporting its potential utility in cardiometabolic risk assessment [5]. These findings highlight the relevance of investigating this ratio in young populations, although its performance for identifying insulin resistance should be evaluated separately from its ability to identify metabolic syndrome.
However, TG/HDL-C cutoff values and diagnostic performance may vary across populations [3,6]. Establishing population-appropriate thresholds is therefore important for assessing the potential utility of this ratio in young Mexican adults. Accordingly, this study aimed to evaluate the association between the TG/HDL-C ratio and insulin resistance and to determine its discriminatory performance and optimal cutoff value in young Mexican adults, using a HOMA-IR value >2.5 as the operational criterion for insulin resistance.
Materials and Methods
Study Design and Population
An analytical cross-sectional study was conducted among university students at the Centro Universitario de Ciencias Exactas e Ingenierías (CUCEI), Universidad de Guadalajara, in the Guadalajara Metropolitan Area, Jalisco, Mexico. Participants were recruited through an open invitation between November 2025 and March 2026.
Eligible participants were university students aged 18–30 years who agreed to participate, provided informed consent, and had the information and biological samples required for the study. Individuals with a previous diagnosis of diabetes mellitus, those receiving pharmacological treatment for obesity or diabetes, and participants with incomplete data were excluded.
A total of 346 participants met the eligibility criteria and were included in the final analysis.
Anthropometric and Clinical Measurements
Body weight and body composition were assessed using a bioelectrical impedance analyzer (TANITA 30A). Height was measured using a stadiometer. Body Mass Index (BMI) was calculated as body weight in kilograms divided by height in meters squared (kg/m²). Waist circumference was measured using a measuring tape at the level of the umbilicus.
Blood pressure was measured using a digital sphygmomanometer in accordance with the applicable Mexican Official Standard for the prevention, treatment, and control of arterial hypertension [7]. The blood pressure cuff was placed on the upper arm above the elbow crease.
Anthropometric and clinical measurements were recorded for subsequent statistical analysis. Obesity was defined as a BMI ≥30 kg/m².
Biochemical Measurements
Fasting venous blood samples were collected for biochemical analyses. Serum glucose, Triglyceride (TG), and High-Density Lipoprotein Cholesterol (HDL-C) concentrations were determined using a Biosystems A15 automated clinical chemistry analyzer based on wet chemistry methods.
Fasting insulin concentrations were measured using an Enzyme-Linked Immunosorbent Assay (ELISA) manufactured by Mexlab.
Calculation of the TG/HDL-C Ratio and HOMA-IR
The triglyceride-to-high-density lipoprotein cholesterol ratio (TG/HDL-C) was calculated by dividing the fasting serum TG concentration by the fasting serum HDL-C concentration. Both measurements were expressed in mg/dL.
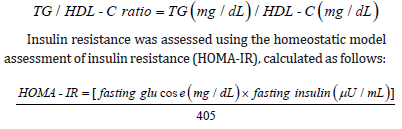
Insulin resistance was operationally defined as a HOMA-IR value >2.5. Participants were classified into two groups: those with insulin resistance (HOMA-IR >2.5) and those without insulin resistance (HOMA-IR ≤2.5).
Statistical Analysis
Continuous variables were summarized as means and standard deviations, whereas categorical variables were expressed as frequencies and percentages. Differences in continuous variables between participants with and without insulin resistance were assessed using Student's t-test.
The association between the TG/HDL-C ratio and HOMA-IR was evaluated using Spearman's rank correlation coefficient and Pearson's correlation coefficient. Linear regression analysis was performed with log-transformed HOMA-IR as the dependent variable and the TG/HDL-C ratio as the independent variable.
The discriminatory performance of the TG/HDL-C ratio for identifying insulin resistance was assessed using Receiver Operating Characteristic (ROC) curve analysis. The area under the ROC curve (AUC) and its 95% Confidence Interval (CI) were calculated. The optimal cutoff value was determined using the Youden index, calculated as sensitivity + specificity − 1. At the selected threshold, sensitivity, specificity, positive predictive value (PPV), negative predictive value (NPV), and overall classification accuracy were calculated.
Exploratory subgroup analyses were conducted according to obesity status, defined as BMI ≥30 kg/m², to examine the association between the TG/HDL-C ratio and HOMA-IR among participants with and without obesity. The Spearman and Pearson correlation coefficients were calculated separately for each subgroup. An exploratory comparison of the Spearman correlation coefficients between obesity strata was also performed.
Additional sex-stratified ROC analyses were conducted to evaluate the discriminatory performance of the TG/HDL-C ratio separately in women and men. For each sex-specific analysis, the AUC, 95% CI, optimal cutoff value, sensitivity, specificity, and Youden index were determined. The 95% CIs for the sex-specific AUC estimates were calculated using stratified bootstrap resampling.
All statistical analyses were performed using Python. All statistical tests were two-sided, and a p-value <0.05 was considered statistically significant.
Ethical Considerations
The study was conducted in accordance with the ethical principles applicable to research involving human participants. The research protocol was reviewed and registered by the Ethics Committee of the Western Biomedical Research Center (Centro de Investigación Biomédica de Occidente, CIBO), under registration number R-2023-1305-011. All participants provided informed consent before enrollment in the study.
Results
Characteristics of the Study Population
A total of 346 young adults were included in the analytical sample. The mean age was 20.8 ± 2.0 years, and 255 participants (73.7%) were female. Based on the predefined HOMA-IR criterion (>2.5), 80 participants (23.1%) were classified as having insulin resistance, whereas 266 (76.9%) were classified as not having insulin resistance. The characteristics of the study population, stratified according to insulin resistance status, are presented in (Table 1).
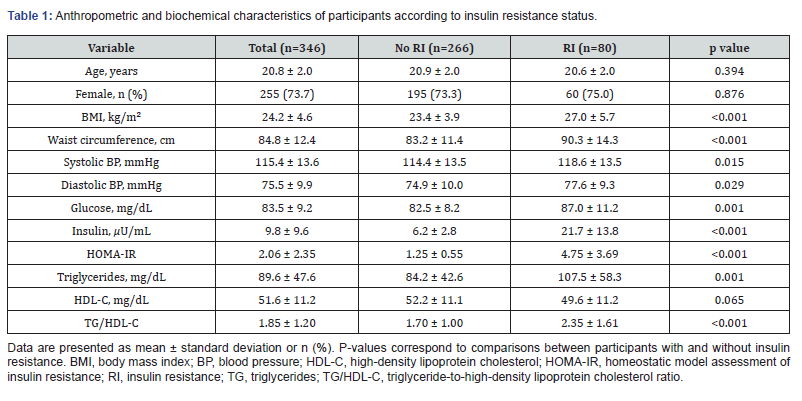
Participants with insulin resistance showed a less favorable anthropometric and biochemical profile than those without insulin resistance. BMI and waist circumference were higher among participants with insulin resistance (27.0 ± 5.7 vs. 23.4 ± 3.9 kg/m² and 90.3 ± 14.3 vs. 83.2 ± 11.4 cm, respectively; both p < 0.001). Systolic and diastolic blood pressure were also higher in the insulin-resistant group (p = 0.015 and p = 0.029, respectively).
Regarding biochemical variables, participants with insulin resistance had higher fasting glucose (87.0 ± 11.2 vs. 82.5 ± 8.2 mg/dL, p = 0.001) and markedly higher fasting insulin concentrations (21.7 ± 13.8 vs. 6.2 ± 2.8 μU/mL, p < 0.001). Triglyceride concentrations were also higher among participants with insulin resistance (107.5 ± 58.3 vs. 84.2 ± 42.6 mg/dL, p = 0.001), whereas HDL-C concentrations did not differ significantly between groups (49.6 ± 11.2 vs. 52.2 ± 11.1 mg/dL, p = 0.065).
Importantly, the TG/HDL-C index was higher among participants with insulin resistance than among those without insulin resistance (2.35 ± 1.61 vs. 1.70 ± 1.00, p < 0.001). These findings indicate that higher TG/HDL-C values were observed in participants with insulin resistance and provide the basis for evaluating its association with HOMA-IR and its discriminatory performance in subsequent analyses.
Association between TG/HDL-C and HOMA-IR
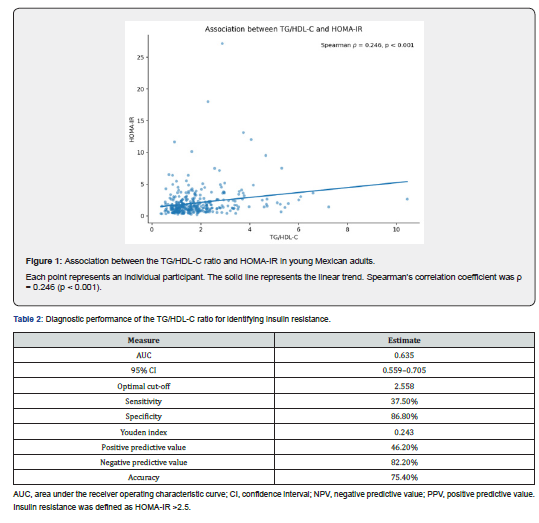
The association between the TG/HDL-C index and HOMA-IR was evaluated in the 346 participants included in the analytical sample. A positive and statistically significant correlation was observed between TG/HDL-C and HOMA-IR (Spearman’s ρ = 0.246, p < 0.001), indicating that higher TG/HDL-C values were associated with higher levels of insulin resistance. Pearson’s correlation analysis yielded a similar positive association (r = 0.199, p < 0.001).
In the linear regression analysis using log-transformed HOMA-IR as the dependent variable, TG/HDL-C remained positively associated with the outcome (β = 0.158, p < 0.001), although the proportion of explained variance was limited (R² = 0.066). Overall, these findings indicate a positive but modest association between TG/HDL-C and HOMA-IR (Figure 1).
Diagnostic Performance of TG/HDL-C for Insulin Resistance
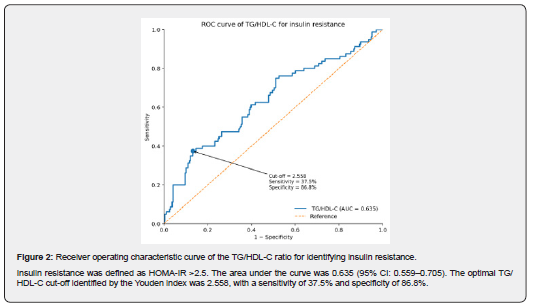
The discriminatory performance of the TG/HDL-C index for identifying insulin resistance was evaluated using Receiver Operating Characteristic (ROC) curve analysis. The area under the curve (AUC) was 0.635 (95% CI: 0.559–0.705), indicating a modest discriminatory capacity of TG/HDL-C for insulin resistance in this population.
The optimal TG/HDL-C cut-off identified using the Youden index was 2.558. At this threshold, the sensitivity was 37.5% and the specificity was 86.8%, yielding a Youden index of 0.243. The positive and negative predictive values were 46.2% and 82.2%, respectively, with an overall accuracy of 75.4% (Table 2) (Figure 2).
Exploratory Analysis According to Obesity Status
To explore whether obesity status influenced the association between TG/HDL-C and HOMA-IR, participants were stratified according to BMI, using a threshold of ≥30 kg/m² to define obesity. Among the 346 participants, 41 (11.8%) met the criterion for obesity, whereas 305 (88.2%) did not.
A positive correlation between TG/HDL-C and HOMA-IR was observed in both groups. Among participants with obesity, the Spearman correlation coefficient was ρ = 0.242 (p = 0.128), whereas among those without obesity, the correlation was ρ = 0.186 (p = 0.001). Thus, although the magnitude of the correlation was numerically higher among participants with obesity, it did not reach statistical significance, likely reflecting the smaller sample size of this subgroup.
Pearson correlation analyses showed a similar pattern, with r = 0.090 (p = 0.577) among participants with obesity and r = 0.169 (p = 0.003) among those without obesity. An exploratory comparison of the Spearman correlation coefficients between the two groups did not identify a statistically significant difference (p = 0.733) (Table 3).
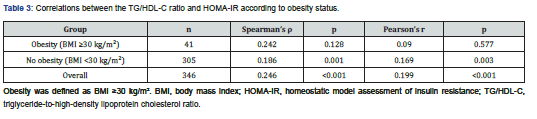
Overall, these findings do not provide evidence that obesity status substantially modifies the association between TG/HDL-C and HOMA-IR in this population.
Sex-Stratified Diagnostic Performance of TG/HDL-C
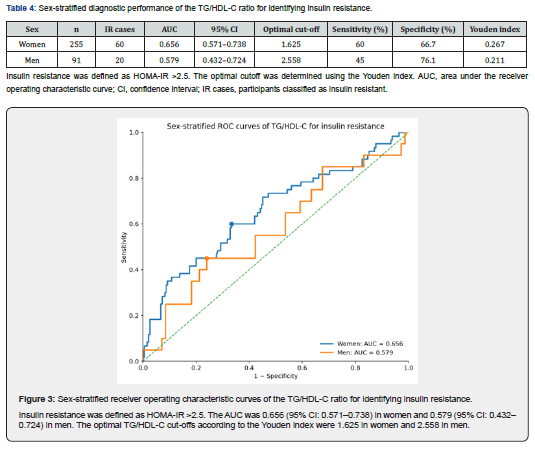
Finally given the known sex-related differences in HDL-C concentrations, the diagnostic performance of TG/HDL-C was additionally evaluated separately in women and men. Among women (n = 255), 60 participants met the criterion for insulin resistance. The AUC was 0.656 (95% CI: 0.571–0.738), with an optimal TG/HDL-C cut-off of 1.625 according to the Youden index. At this threshold, sensitivity was 60.0% and specificity was 66.7%, yielding a Youden index of 0.267.
Among men (n = 91), 20 participants were classified as having insulin resistance. The AUC was 0.579 (95% CI: 0.432–0.724). The optimal cut-off was 2.558, with a sensitivity of 45.0% and specificity of 76.1%, resulting in a Youden index of 0.211.
Overall, the sex-stratified analysis showed differences in the discriminatory performance and optimal threshold of TG/HDL-C between women and men, with a lower optimal cut-off and higher AUC observed in women. These findings suggest that the performance of TG/HDL-C may vary according to sex; however, the estimates, particularly among men, should be interpreted cautiously given the smaller number of participants with insulin resistance (Table 4) (Figure 3).
Discussion
Principal Findings
In this sample of 346 young adults, 23.1% met the study criterion for insulin resistance (HOMA-IR >2.5). Participants classified as insulin resistant showed higher BMI, waist circumference, blood pressure, fasting glucose, fasting insulin, and triglyceride concentrations than those without insulin resistance, whereas HDL-C concentrations did not differ significantly. These findings indicate a less favorable anthropometric and biochemical profile among participants with insulin resistance. However, the cross-sectional design precludes establishing temporal or causal relationships between these variables.
The greater general and central adiposity observed among participants with insulin resistance is consistent with previous evidence linking waist circumference to HOMA-IR. In a nationwide Korean study of 20,202 adults, waist circumference remained positively associated with HOMA-IR in both sexes after multivariable adjustment [7]. Similarly, a study of young adults aged 18–24 years reported higher BMI, waist circumference, and blood pressure among participants with elevated TG/HDL-C ratios [8]. These findings provide context for the anthropometric differences observed in the present study, although they do not establish whether adiposity precedes insulin resistance or whether both develop concurrently.
Regarding the biochemical profile, higher triglyceride concentrations contributed to the pattern observed in the TG/HDL-C ratio, whereas HDL-C concentrations did not differ significantly between groups. Because the ratio is calculated from both lipid components, their independent contributions cannot be established from these findings alone. In a study of 2,244 Mexican university students aged 17–24 years, Murguía-Romero et al. [4] reported associations between the TG/HDL-C ratio, insulin resistance, and cardiometabolic risk, using sex-specific thresholds [4]. Mederos-Torres et al. [8] likewise reported associations between the ratio and HOMA-IR, BMI, waist circumference, and blood pressure in young adults [8]. Together, these studies support investigating TG/HDL-C as a complementary marker of metabolic abnormalities in young populations.
In the present study, TG/HDL-C was positively associated with HOMA-IR, although the correlations were modest (Spearman's ρ = 0.246; Pearson's r = 0.199). The linear regression model also showed a positive association with log-transformed HOMA-IR (β = 0.158; p < 0.001), but explained only 6.6% of its variability (R² = 0.066). Thus, TG/HDL-C was associated with insulin resistance but accounted for only a small proportion of the observed variation in HOMA-IR.
Comparison with Previous Studies
Previous studies have reported stronger associations and better discriminatory performance in some populations. In a multiethnic primary prevention cohort, Gašević et al. [9] reported correlations between TG/HDL-C and insulin resistance ranging from 0.372 to 0.597 across groups, with AUC values ranging from 0.676 to 0.777 [9]. A review of 32 studies involving 49,782 participants also concluded that the performance and cutoff values of the ratio may vary according to sex and ethnicity [10]. Compared with these findings, the association and discriminatory performance observed in the present sample were more limited, emphasizing the importance of population characteristics when interpreting the ratio.
ROC analysis yielded an AUC of 0.635 (95% CI: 0.559–0.705), indicating modest discriminatory ability for identifying insulin resistance. The Youden-derived cutoff of 2.558 showed a sensitivity of 37.5% and a specificity of 86.8%. Although specificity was relatively high, the low sensitivity indicates that many participants meeting the HOMA-IR criterion would not be identified at this threshold. Therefore, this cutoff should not be used alone to rule out insulin resistance.
The predictive values should also be interpreted in the context of the 23.1% prevalence of insulin resistance in this sample. The PPV was 46.2%, and the NPV was 82.2%. Overall classification accuracy was 75.4%, slightly below the 76.9% proportion of participants without insulin resistance. Consequently, accuracy alone does not demonstrate an advantage over classifying every participant as not insulin resistant. These findings support considering TG/HDL-C as a complementary indicator rather than a stand-alone screening test.
The AUC in the present study was lower than the value of 0.88 reported by Sigudu et al. [11] in 781 South African adults aged 20–29 years, in whom sensitivity was 82.1% and specificity was 85.0% for identifying insulin resistance defined as HOMA-IR ≥2.5 [11]. However, 39.1% of participants in that study had diabetes, making direct comparison difficult. Differences in population characteristics, the distribution of metabolic variables, and the operational definition of insulin resistance may have contributed to the differing estimates. The discrepancy cannot be attributed to a single factor.
Cutoff values reported in other populations also illustrate the importance of context. Murguía-Romero et al. [4] used TG/HDL-C thresholds above 2.5 in women and 3.5 in men among Mexican university students [4]. Gašević et al. [9] also reported differences in the ratio's performance across ethnic groups [9]. These thresholds are not directly interchangeable with the cutoff derived in the present study because populations and definitions of insulin resistance differ. Accordingly, the value of 2.558 should be considered exploratory and requires external validation.
Sex- and Obesity-Stratified Analyses
The exploratory analysis by obesity status did not provide sufficient evidence that obesity modified the association between TG/HDL-C and HOMA-IR. The Spearman correlation was statistically significant among participants without obesity (ρ = 0.186; p = 0.001), but not among those with obesity (ρ = 0.242; p = 0.128). However, the direct comparison between correlation coefficients was not statistically significant (p = 0.733). A significant association in one subgroup and a nonsignificant association in another does not establish a difference between the groups. Moreover, the obesity subgroup included only 41 participants, limiting the precision of its estimate. These findings therefore do not demonstrate that the association is identical across obesity strata, but they also do not establish effect modification.
In sex-stratified analyses, the AUC was numerically higher in women than in men (0.656 vs. 0.579), and the optimal cutoffs were 1.625 and 2.558, respectively. However, both AUC estimates indicated limited discrimination, and the 95% CI for men included 0.5. Only 20 men met the insulin resistance criterion, further limiting precision. Because no formal comparison of the AUCs was reported, these findings do not establish that discriminatory performance differed significantly by sex.
Previous studies have proposed sex-specific thresholds. Salazar et al. [12] studying adults predominantly of European ancestry, reported TG/HDL-C thresholds above 2.5 in women and 3.5 in men, with sensitivity close to 40% and specificity close to 80% [12,13]. These values are not directly comparable with those obtained here because of differences in population characteristics and the operational definition of insulin resistance. The review by Baneu et al. [10] similarly highlighted variation in the ratio's performance across sex and ethnic groups [10]. Further studies are therefore needed to determine whether sex-specific thresholds provide meaningful improvements in discrimination.
Strengths and Limitations
A strength of this study is the comparative evaluation of the TG/HDL-C ratio in relation to HOMA-IR in a sample of young Mexican adults, a population in which early metabolic alterations warrant further investigation. The study also assessed the ratio's discriminatory performance using ROC analysis and explored its behavior according to sex and obesity status, providing complementary information on its potential applicability and limitations in this population [14,15].
Several limitations should be acknowledged. First, the cross-sectional design prevents causal inference. Second, recruitment from a single university center may limit the generalizability of the findings to other young Mexican adults. The relatively small numbers of men with insulin resistance and participants with obesity also limit the precision of subgroup estimates. In addition, the cutoff was derived and evaluated in the same sample, which may result in optimistic estimates of diagnostic performance. External validation in larger and more diverse populations is therefore necessary to assess the reproducibility and generalizability of the proposed cutoff. Future studies should also include formal comparisons of diagnostic performance across sex and obesity strata to determine whether subgroup-specific thresholds provide meaningful improvements in discrimination.
Conclusion
In young Mexican adults, the TG/HDL-C ratio was positively associated with HOMA-IR, although the magnitude of this association was modest and its discriminatory ability for identifying insulin resistance was limited. The overall cutoff of 2.558 showed relatively high specificity but low sensitivity, limiting its utility as a stand-alone screening tool. Exploratory analyses suggested differences in discriminatory performance according to sex; however, these findings do not establish statistically significant differences between women and men. The TG/HDL-C ratio may therefore be considered a complementary indicator of metabolic abnormalities rather than a substitute for HOMA-IR or an independent diagnostic test. Further studies in larger and more diverse populations are needed to validate the proposed cutoff and assess its applicability in other settings.
Acknowledgement
The authors thank Universidad de Guadalajara for its institutional support in conducting this study.
References
- Swarup S, Ahmed I, Grigorova Y, Zeltser R (2024) Metabolic syndrome. In StatPearls. StatPearls Publishing.
- Nájera, N, López DY, Meaney A, Ortiz VP, Pérez IG, et al. (2025) El índice TG/c-HDL, marcador de dislipidemia aterogénica, es un factor significativo en el perfil epidemiológico contemporáneo de Mé Cardiovascular and Metabolic Science 36(4): 197-208.
- Kosmas CE, Rodriguez PS, Bousvarou MD, Papakonstantinou EJ, Peña GE, et al. (2023) The triglyceride/high-density lipoprotein cholesterol (TG/HDL-C) ratio as a risk marker for metabolic syndrome and cardiovascular disease. Diagnostics 13(5): 929.
- Murguía RM, Jiménez FJR, Sigrist FSC, Espinoza CMA, Jiménez MM, et al. (2013) Plasma triglyceride/HDL-cholesterol ratio, insulin resistance, and cardiometabolic risk in young adults. Journal of Lipid Research 54(10): 2795–2799.
- Murguía RM, Jiménez FJR, Sigrist FSC, Tapia PDC, Ramos JA, et al. (2015) Prevalence of metabolic syndrome in young Mexicans: A sensitivity analysis on its components. Nutr Hosp 32(1): 189-195.
- Baez DBG, Zamora GI, Rodríguez RSO, Pesqueda CK, García AKH (2022) TG/HDL index to identify subjects with metabolic syndrome in the Mexican population. Gaceta Médica de México 158(5): 469-475.
- Lim SH, Lee T, Oh J, Hwang KH, Choi EH, et al. (2025) Waist circumference as an independent marker of insulin resistance: Evidence from a nationwide Korean population study. Journal of Clinical Medicine 14(22): 7957.
- Mederos TCV, Díaz BY, Muñoz AML, García ZAG, Uvalle NRL, et al. (2024) Triglyceride/high-density cholesterol ratio as a predictor of cardiometabolic risk in young population. Journal of Medicine and Life 17(7): 722-727.
- Gašević D, Frohlich JJ, Mancini GBJ, Lear SA (2012) The association between triglyceride to high-density-lipoprotein cholesterol ratio and insulin resistance in a multiethnic primary prevention cohort. Metabolism 61(4): 583-589.
- Baneu P, Văcărescu C, Drăgan SR, Cirin L, Lazăr HAI, et al. (2024) The triglyceride/HDL ratio as a surrogate biomarker for insulin resistance. Biomedicines 12(7): 1493.
- Sigudu TT, Mkhatshwa TN, Monyeki KD, Matshipi M (2025) The role of triglycerides and HDL in predicting insulin resistance in diabetic and non-diabetic young adults in Lephalale, Limpopo Province South Africa. Critical Public Health 35: 1-9.
- Salazar MR, Carbajal HA, Espeche WG, Leiva SCE, Balbín E, et al. (2012) Relation among the plasma triglyceride/high-density lipoprotein cholesterol concentration ratio, insulin resistance, and associated cardio-metabolic risk factors in men and women. The American Journal of Cardiology 109(12): 1749-1753.
- Sasaki N, Maeda R, Ozono R, Yoshimura K, Nakano Y, et al. (2022) Adipose tissue insulin resistance predicts the incidence of hypertension: The Hiroshima Study on Glucose Metabolism and Cardiovascular Diseases. Hypertension Research, 45(11): 1763-1771.
- Barboza CEP (2022) Relación del estado nutricional e índice triglicéridos/c-HDL en adultos atendidos en un hospital público. Acta Médica Peruana 39(3): 240-246.
- Ministry of Health (2010) Amendment to the Official Mexican Standard NOM-030-SSA2-1999—reissued as Official Mexican Standard NOM-030-SSA2-2009—for the prevention, detection, diagnosis, treatment, and control of systemic arterial hypertension. Official Gazette of the Federation.