




 CRDOJ Home



Abstract
Backgrounds: Anthropometric measurements play a vital role in clinical assessment, decision making and diagnosis.
Methods: This is a cross-sectional, case-controlled, multicenter study. A purposeful sampling technique was used to recruit 50 newly diagnosed type 2 DM subjects within 3 weeks of their diagnosis. Also, apparently healthy 50 non-diabetic with no significant medical history were recruited as controls. Waist Circumference (WC) was measured and Waist to Height Ratio (WHtR) was calculated.
Results: There were 32 males and 68 females, with Male: Female ratio of 1:2. A Multiple linear regression analysis model was not statistically significant, F (2,97) = 0.884, p = .416, with an R² of .018 and an adjusted R² of −.002. WC and WHtR jointly explained approximately 1.8% of the variance in glycated hemoglobin (HbA1c).The lowest mean of HbA1c was in the control group (5.4%), then total (general ) population group (6.9%) while the new onset type 2 DM patients group had the highest (8.3%).WHtR was not a significant independent predictor (B = 13.889, β = .393, p = .292, 95% CI: −12.125 to 39.903) of HbA1c.A Sudanese study also reported no significant correlation between WHtR and HbA1c.
Conclusion: WC and WHtR decreases in size and number as we move from a cohort of new onset type 2 DM patient to the general population and then to a control group.
Keywords: Waist circumference; Waist to height ratio; Glycated hemoglobin; New onset type 2 diabetes mellitus
Introduction
Anthropometric measurements play a vital role in clinical assessment, decision making and diagnosis [1-4]. It is a simple but significant indices that furnishes clinical information that can be used as a surrogate marker of some internal composition of man [5-9]. Waist to height ratio is a surrogate marker of metabolic risk in the body [10,11]. It is easy to estimate in different setting both within and outside the health ecosystem making it a user-friendly measurement in the community and also easy for patients and all categories of health workers to estimate. The measurement gives more information than measuring height alone which will majorly give information on short stature and gigantism and their differential diagnosis [12-17].
Waist circumference measurement is an index measured with different landmark by different clinician. Some used the umbilicus as landmark of measurement while others use the lower boarder of the rib cage in full expiration for the measurement. The World Health Organization recommend the midpoint between the iliac crest and the lower boarder of the ribcage as landmark for measurement with the patient in erect position, the hand by the sides ,the legs together, the patient on a light clothing with the arm by the sides [18-20].Waist circumference as a clinical assessment has been recommended to be a routine measurement in clinical practice through a consensus statement by the International Atherosclerosis Society and International Chair on Cardio-metabolic Risk Working Group on Visceral Obesity [18].
Physiologically, because of body habitus, waist circumference is different between men and women with males having a bigger waist circumference measurement than women especially early in life and in premenopausal women matched for age with their male counterpart. The redistribution of fats in female post menopause causes increase in intra-abdominal fat post menopause and decreases subcutaneous fat in women [21,22] There is ethnic variability in waist circumference [23].
Due to westernization, the incidence and prevalence of type 2 diabetes mellitus is on the rise in Nigeria and most part of Africa [24]. This necessitates a need to study new onset type 2 diabetes mellitus in the context of African and Nigerian community setting. In a study in Port-Harcourt, River’s state, Nigeria, among hypertensives and non-hypertensives, waist circumference was not statistically associated with glycated hemoglobin. The study only studied 11 newly diagnosed type 2 diabetes mellitus patients among the 400-patient studied to arrive at that finding. This sample size is small and needs further evaluation to cover that knowledge gap which this study attempts to cover [25].
What is the association between waist to height ratio and glycated hemoglobin in blacks with new onset type 2 diabetes mellitus? What is the association between waist circumference and glycated hemoglobin in new onset type 2 diabetes mellitus? Can WHtR be used as a surrogate marker of high glycated hemoglobin in new onset type 2 diabetes mellitus? Can waist circumference be used as a surrogate marker of high glycated hemoglobin in new onset type 2 diabetes mellitus? Which is a better surrogate marker, if any, between waist to height ratio and waist circumference to glycated hemoglobin in new onset type 2 diabetes mellitus?
Methods
This is a cross sectional, case-controlled multicenter study. A non- probability technique, purposeful sampling technique was used to recruit 50 newly diagnosed type 2 diabetes mellitus subjects out of which 47 subjects had glycated hemoglobin of 6.5% and above while 3 newly diagnosed type 2 diabetes mellitus patient had HbA1c less than 6.5% but meeting fasting blood sugar criteria of 126mg/dl for diagnosis of new onset type 2 diabetes mellitus. All the 50 subjects were within their first three weeks of their initial diagnosis. Also, 50 control participants who are apparently healthy with no significant medical history and not living with diabetes mellitus and has glycated hemoglobin less than 6.5% were recruited. This makes it a total of 100 participants in the study. Waist circumference was measured using World Health Organization criteria and waist to height ratio was calculated by dividing waist circumference in centimeters by height in centimeters. It is a multicenter study on new-onset type 2 diabetes mellitus patients attending healthcare in tertiary and secondary hospitals: Lagos State University Teaching Hospital, Ikeja, Lagos, (LASUTH) and General Hospital, Gbagada. Lagos, Nigeria. A questionnaire was used to extract necessary information from the patients. The questionnaire was also used for data collection. The questionnaire is in three stages, section A collects demographic data including laboratory identifier number and hospital number, body weight, body height, waist circumference etc., excluding name. Section B collects laboratory parameters like value of blood sugar at diagnosis of new onset type 2 diabetes mellitus whether by point of care POC or laboratory analysis and also time testing was done was recorded. It also records, analytic value of HbA1c in percentages using gold standard of measurement of glycated hemoglobin, high performance liquid chromatography. Section C collects clinical information like type of diabetes, family history of type 2 diabetes mellitus, previous medical history and co-morbidity, type of glucose lowering agent patient is commenced on, if any, whether insulin, oral hypoglycemic agents or a combination of insulin and oral hypoglycemic agent and other relevant health history.
Glycated hemoglobin concentration estimation was done at Lagos State University Teaching hospital Laboratory. Point of care testing was through a brand-new glucometer that uses glucose oxidase as its active reagent in order to have a high sensitivity yield.
Research procedure includes collection through venipuncture of 5-7mls of venous whole blood in an Ethylenediaminetetraacetic Acid (EDTA) bottle and mixed with anticoagulant after which glycated hemoglobin estimation was done using high performance liquid chromatographic technique.
Inclusion and exclusion criteria
The inclusion criteria include new onset type 2 diabetes mellitus on pharmacologic therapy or not within 3 weeks of diagnosis with glycated hemoglobin of 6.5% and above. In addition, three new onset type 2 diabetes mellitus patients that does not have HbA1c value up to 6.5% but meet the American Diabetes Association fasting blood sugar level of 126mg/dl for diagnosis of new onset type 2 diabetes mellitus were recruited as subjects in this study to make up sample size of 50 subjects in the study that employs purposive sampling technique to recruit patient.
Exclusion criteria include new onset type 2 diabetes mellitus diagnosed by fasting blood sugar values without corresponding HbA1c equaling 6.5% or above (except the 3 patients mentioned above). New onset type 2 diabetes mellitus diagnosed by random blood sugar with values 200mg/dl and above but with glycated hemoglobin less than 6.5% were also excluded. Newly diagnosed type 2 diabetes mellitus of more than 3 weeks were excluded. Other exclusion criteria were non- diabetes hyperglycemia, previously diagnosed type 2 diabetes mellitus, gestational diabetes mellitus, maturity onset diabetes of the young MODY, Latent Autoimmune Diabetes of Adulthood (LADA), unconscious new-onset type 2 diabetes mellitus patient with confounding cause of unconsciousness,
Sample size
The sample size is 100 participants, 50 newly diagnosed type 2 diabetes mellitus and 50 apparently healthy non diabetics spread across the two centers.
Diagnosis of new-onset type 2 diabetes mellitus will be by fasting blood sugar of 126mg/dl or above, random blood sugar or by 2 hours post -prandial glucose measurement of 200mg/dl and above or by glycated hemoglobin value of 6.5% or above according to American Diabetes Association diagnostic criteria.
Ethical approval was obtained from the ethical committees of the two centers. Lagos State University Teaching Hospital (LASUTH} with reference number LREC/06/26/3114 and General Hospital Gbagada Lagos with reference number GBGH/750/VOL.IV/782.
The World Medical Association (WMA) Declaration of Helsinki as a statement of ethical principles for medical research involving human subjects, including research on identifiable human material and data was observed. A consent was duly obtained with signing of consent forms. The data was recorded in an excel sheet and stored in google drive file till sample size was completed. This data was later populated on SPSS version 26 for data analysis using descriptive statistics and multiple linear regression analysis.
Results
There were 100 participants, 32 males and 68 females, with an approximate male to female ratio of 1:2.
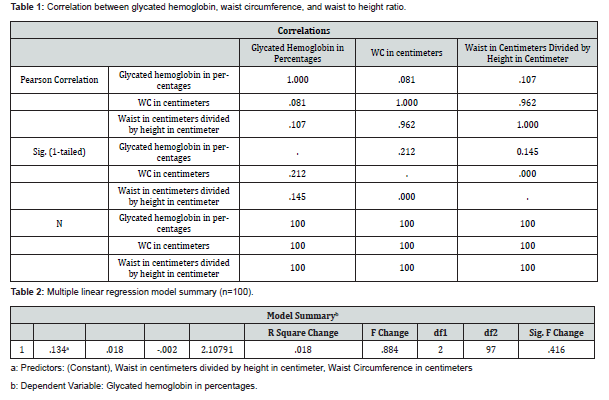
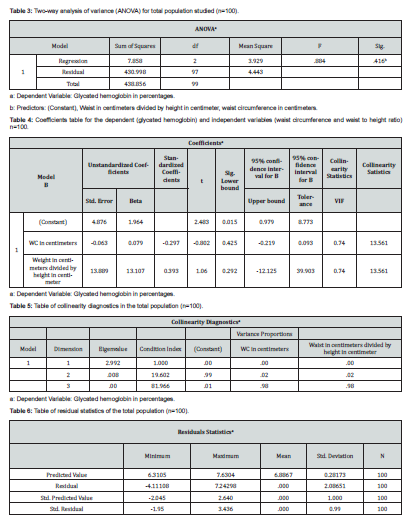
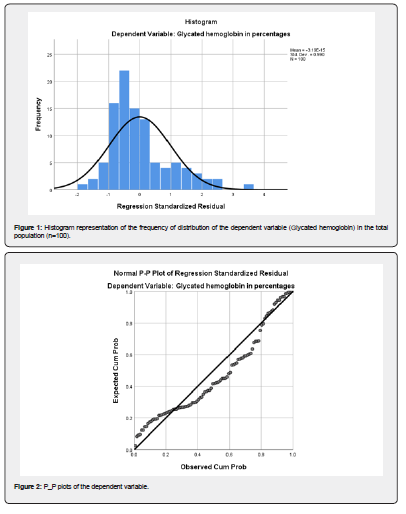
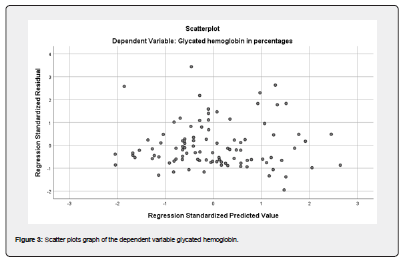
A multiple linear regression analysis was conducted to determine whether waist circumference and waist-to-height ratio were associated with glycated haemoglobin (HbA1c) in the total study population (n = 100). The overall regression model was not statistically significant, F (2,97) = 0.884, p = .416, with an R² of .018 and an adjusted R² of −.002. Thus, waist circumference and waist-to-height ratio jointly explained approximately 1.8% of the variance in HbA1c. Waist circumference was not a significant independent predictor of HbA1c (B = −0.063, β = −.297, p = .425, 95% CI: −0.219 to 0.093), while waist-to-height ratio was also not a significant independent predictor (B = 13.889, β = .393, p = .292, 95% CI: −12.125 to 39.903). Substantial multicollinearity was observed between waist circumference and waist-to-height ratio, as evidenced by a Pearson correlation of r = .962, tolerance of .074 and VIF of 13.561 for both predictors. Consequently, the individual regression coefficients should be interpreted with caution. See (Tables 1-6) and (Figures 1-3).
Multiple linear regression analysis was performed to determine whether waist circumference and waist-to-height ratio predicted glycated haemoglobin (HbA1c) among the 50 subjects. The overall regression model was not statistically significant, F (2,47) = 0.679, p = .512, with an R² of .028 and an adjusted R² of −.013. Thus, waist circumference and waist-to-height ratio jointly accounted for 2.8% of the variance in HbA1c. Waist circumference was not a statistically significant independent predictor of HbA1c (B = −0.089, β = −.398, p = .385, 95% CI: −0.293 to 0.115), while waist-to-height ratio was also not statistically significant (B = 10.427, β = .267, p = .559, 95% CI: −25.215 to 46.070). Substantial multicollinearity was observed between waist circumference and waist-to-height ratio (r = .949, p < .001; tolerance = .100; VIF = 9.967). Therefore, the individual regression coefficients should be interpreted with caution.
Among the 50 control participants, waist circumference was positively correlated with HbA1c (r = 0.252, p = 0.039), whereas waist-to-height ratio was not significantly correlated with HbA1c (r = 0.213, p = 0.069). However, when waist circumference and waist-to-height ratio were entered simultaneously into a multiple linear regression model, the overall model was not statistically significant, F (2,47) = 2.124, p = 0.131, R² = 0.083. Neither waist circumference (β = 0.831, p = 0.172) nor waist-to-height ratio (β = −0.595, p = 0.325) was an independent statistically significant predictor of HbA1c. The interpretation of the individual regression coefficients is limited by severe multicollinearity between waist circumference and waist-to-height ratio (r = 0.972, VIF = 18.357, tolerance = 0.054).
Discussion
In a Chinese study of young and middle aged Chinese with early onset type 2 diabetes mellitus, the poor glycemic control group (n=155) with glycated hemoglobin equal to or greater than 7% had higher waist to height ratio compared to the good control group. Also, waist to height ratio correlated well with HbA1c in the Chinese study and after adjustment for confounders, weight to height ratio remained associated independently with glycated hemoglobin, there is ethnic variability compared to this study as participants are blacks compared to the Asian Chinese study. May be phenotypic, geographic, epigenetic reasons could account for these differences, but this was not tested in this study. A comparative study in weight to height ratio and its effect in blacks versus Asian population is suggested as a way forward. In this study in black, in new onset type 2 diabetes mellitus patients, weight to height ration is negatively correlated to glycated hemoglobin and weight to height ratio did not show a significant association with glycated hemoglobin in blacks with new onset type 2 diabetes mellitus [26].
One difference between the black and Chinese study is that all the Chinese cases were early onset type 2 diabetes mellitus occurring in young and middle-aged subjects under 40 years, while this black study was in both early and late-stage type 2 diabetes mellitus that were new onset cutting across young, middle and elderly ages in African population.
Akarsu et al. Also found lower values for body mass index and waist hip ratio in the control group in their study. The European study showed a positive correlation between glycated hemoglobin and waist circumference and also demonstrate an independent strong association between HbA1c and waist circumference like the Chinese study by Shen et al. But being a cross-sectional study, the strong association between waist circumference and glycated hemoglobin by Akarsu et al could not be said to be causal [27].
In this study in blacks, the mean waist circumference was lowest in the control group (without type 2 diabetes population) followed by the waist circumference mean in the total (general) population comprising of control and new onset type 2 diabetes mellitus, while the highest mean of waist circumference was found between the new onset type 2 diabetes mellitus group. This finding was found similarly by Akarsu et al in 2026 working on an European population in Turkey, he found that waist circumference values were significantly lower in the control group of their study compared to the values in prediabetes and type 2 diabetes mellitus.
In a Sudanese study done in 2022 and published in 2025, also reported no significant correlation between weight to height ratio and glycated hemoglobin, though, the waist circumference significantly correlated with glycated hemoglobin in the study. The Sudanese study had 396 participants which is almost four times compared to 100 in this study, yet the finding of no significant association of weight to height ratio to glycated hemoglobin was the same [28].
The waist circumference median values were higher in the type 2 diabetes mellitus group (107) in the Sudanese study than in the non-diabetes mellitus group. Also in this study, the waist circumference mean value was highest in the new onset type 2 diabetes mellitus group with 90.6cm, followed by the waist circumference of the general population with value 88.9cm and then the control waist circumference with 87.3cm. Similarly, the waist to height ratio in this study was highest with the new onset type 2 diabetes mellitus group with 0.56, followed by the waist to height ratio of the general population of 0.55 and then that of the control, 0.54. Similarly the median values of the waist to height ratio was higher in the type 2 diabetes compared to non-type 2 diabetes group. The study concluded that body mass index, waist circumference and weight to height ratio had poor predictive value in detecting type 2 diabetes among Sudanese [28].
In a similar finding as waist circumference mean in this study in blacks, the lowest mean of glycated hemoglobin was in the control group (5.4%), followed by the mean of glycated hemoglobin in the total (general) population consisting of control and subjects (6.9%) while the new onset type 2 diabetes mellitus patients had the highest mean of glycated hemoglobin which was (8.3%).
The finding in literature between association of waist circumference to glycated hemoglobin varies with the majority establishing an association between waist circumference and glycated hemoglobin, especially large studies. However, some reports also found no association between waist circumference and glycated hemoglobin just as is seen in this study. One major reason that can be adduced to this is the small sample size of this study. The small sample size in no way invalidates the larger study findings which put waist circumference as a predictor of glycated hemoglobin. The substantial multicollinearity between waist to height ratio and waist circumference is another reason why the analysis on effect of waist circumference on glycated hemoglobin variance could not be well delineated. Also, this was a cross-sectional study with a one-off measurement of waist circumference and glycated hemoglobin and not a longitudinal study that observes waist circumference in relation to glycated hemoglobin over time.
Though the association of waist circumference and waist to height ratio was not significant in both total population and subjects with glycated hemoglobin of new onset type 2 diabetes mellitus in this study, it explains more of variation in value of glycated hemoglobin in new onset type 2 diabetes mellitus patient than in the total (general) population studied.
In two large Asian cohort study in 2025 by Wang et al. ,The study included 14,468 participants from NAGALA and 8,978 participants from CHARLS who were followed up for 13 years, the researchers developed an indicator for waist-to-height-HbA1c (WHH) indicator and then compared it to body mass index, waist to height ratio and glycated hemoglobin, it was found that higher WHH was found to be associated with incident diabetes though the relationship was not linear [29].
Nathan et al. too in 2007 describe the relationship between glycated hemoglobin and mean glucose level over time to be curvilinear [30].
In addition, WHH has been found to demonstrate superior predictive performance for stroke than waist to height ratio and glycated hemoglobin [31].
In a relatively large male cohort study in South Korea, the group with high weight to height ratio was noticed to have high glycated hemoglobin compared to group with low weight to height ratio with significant positive correlation with glycated hemoglobin [32].
In 2025, Huang et al demonstrated in a large European population of 7,979 followed up for a median of 16 years that among five adiposity-based indicators involving body mass index, waist circumference, waist to height ratio, waist-by-height 0.5 (WHT.5R) and a body shape index (ABSI), waist-based indicators were superior to body mass index in identifying diabetes. High weight to height ratio also had the highest multivariable-adjusted hazard ratio [2.64 (95 % CI 2.29, 3.03)]. The study hypothesizes that weight to height ratio with a sex and race-independent cut-point may be useful for diabetes prevention [33].
A national trend in type 2 diabetes mellitus was described among south Koreans between 2005-2022 by stratification using central obesity and waist to height ratio with data from the Korea National Health and Nutrition Examination Survey KNHANES (2005-2022). The study involving 79,368 participants had groups of healthy central adiposity group and increased central adiposity group and high central adiposity group. All the 3 groups experienced increase in the prevalence of type 2 diabetes mellitus over the study period with the high central adiposity group recording most cases of incident type 2 diabetes [34].
The healthy central adiposity group experienced an increase in prevalence from 3.3% to 5.8%. The increased central adiposity group had an increase of diabetes prevalence from 11.2 to 17.1% while the high central adiposity group had an increase from 18% to 26.7%. The high adiposity group had more susceptibility to develop type 2 diabetes in the overweight and obese participants in their group than those that were underweight. In Nigeria, there is a need to determine the susceptibility of Nigerian to develop type 2 diabetes mellitus by using weight to height ratio which is an easy to use, cost effective and less manpower training requiring parameter to national advantage. Having such data will help economic and budget planning, policy formulation and appropriate prevention of economic loss through type 2 diabetes mellitus which affects the working class of the Nigerian economy [34].
In an American study, four indices were found to be useful in predicting cardiovascular disease ability which are waist circumference, Waist to Height Ratio (WHtR), waist divided by height0.5 (WTH.5R), and Weight-Adjusted Waist Index (WWI) and of this waist to height ratio has the highest predictive application [35].
In the pediatric age group study of 12,318 Indian children, it was reported that waist to height ratio was the strongest determinant of development of prediabetes and diabetes in children and adolescent aged 10 to 19 years in a national nutrition survey using machine learning algorithm [36].
Conclusion
Waist circumference and waist to height ratio decreases in size and number as we move from a cohort of new onset type 2 diabetes mellitus patient to the general population and then to a cohort without new onset type 2 diabetes mellitus. Both waist circumference and waist to height ratio are not independent predictors of glycated hemoglobin in general population, control and new onset type 2 diabetes mellitus cohorts.
Data Availability
Some or all datasets generated during and/or analyzed during the current study are not publicly available but are available from the corresponding author on reasonable request.
Acknowledgement
I thank all the patients that participated in the study without which the study will not be possible.
All procedures followed were in accordance with the ethical standards of the responsible committee on human experimentation (institutional and national) and/or with the Helsinki Declaration of 1964 and later versions. Informed consent or substitute for it was obtained from all patients for being included in the study.
References
- Casadei K, Kiel J (2022) Anthropometric Measurement. StatPearls [Internet]. Treasure Island (FL): StatPearls Publishing.
- Kiisk L, Kaarma H, Rosenberg OM (2012) Impact of anthropometric measurements in clinical practice. Coll Antropol 36(4): 1325-33.
- Pazarlı AC (2022) The role of anthropometric measurements in identifying cardiometabolic diseases in obstructive sleep apnea syndrome. Tuberk Toraks 70(3): 287-292.
- Utkualp N, Ercan I (2015) Anthropometric Measurements Usage in Medical Sciences. Biomed Res Int 2015: 404261.
- Vasan SK, Thomas N, Christopher S, Geethanjali FS, Paul TV, et al. (2011) Anthropometric measurements for the prediction of the metabolic syndrome: a cross-sectional study on adolescents and young adults from southern india. Heart Asia 3(1): 2-7.
- Scafoglieri A, Clarys JP, Cattrysse E, Bautmans I (2013) Use of anthropometry for the prediction of regional body tissue distribution in adults: benefits and limitations in clinical practice. Aging Dis 5(6): 373-93.
- Sintayehu E, Sintayehu Y, Oumer A, Berhane A (2023) Identification of anthropometric surrogate measurements and their cut-off points for the detection of low birth weight and premature newborn babies using ROC Analysis. J Nutr Sci 12: e32.
- Roscoe S, Allen SP, McDermott C, Stavroulakis T (2025) Exploring the role of anthropometric measurements to assess nutritional status in amyotrophic lateral sclerosis: a longitudinal prospective cohort study. Amyotroph Lateral Scler Frontotemporal Degener 26(3-4): 225-238.
- Ping Z, Pei X, Xia P, Chen Y, Guo R, et al. (2018) Anthropometric indices as surrogates for estimating abdominal visceral and subcutaneous adipose tissue: A meta-analysis with 16,129 participants. Diabetes Res Clin Pract.
- Shin KA, Kim YJ (2019) Usefulness of Surrogate Markers of Body Fat Distribution for Predicting Metabolic Syndrome in Middle-Aged and Older Korean Populations. Diabetes Metab Syndr Obes.
- Gupta N, Lteif A, Creo A, Iqbal AM, Pittock S, et al. (2019) Improved utilization of waist-to-height ratio in cardiometabolic risk counselling in children: Application of DMAIC strategy. J Eval Clin Pract.
- Sharma L, Rani D, Kanchan T, Krishan K (2025) Short Stature. In: StatPearls [Internet]. Treasure Island (FL): StatPearls Publishing.
- Cheetham T, Davies JH (2014) Investigation and management of short stature. Arch Dis Child 99(8): 767-71.
- Sada V, Puliani G, Feola T, Pirchio R, Pofi R, et al. (2024) Tall stature and gigantism in transition age: clinical and genetic aspects-a literature review and recommendations. J Endocrinol Invest 47(4): 777-793.
- Beckers A, Petrossians P, Hanson J, Daly AF (2018) The causes and consequences of pituitary gigantism. Nat Rev Endocrinol 14(12): 705-720.
- George MM, Eugster EA, Chernausek SD, Feingold KR, Adler RA, et al. (2000) Pituitary Gigantism. Endotext [Internet] South Dartmouth (MA): MDText.com Inc.
- Donato S, Regala C, Marques P (2026) Gigantism. Vitam Horm 131: 195-234.
- Ross R, Neeland IJ, Yamashita S, Shai I, Seidell J, et al. (2020) Waist circumference as a vital sign in clinical practice: a Consensus Statement from the IAS and ICCR Working Group on Visceral Obesity. Nat Rev Endocrinol 16(3): 177-189.
- World Health Organisation (1995) Physical status: the use and interpretation of anthropometry: report of a WHO Expert Committee.
- NHLBI Obesity Education Initiative (2000) The practical guide to the identification, evaluation and treatment of overweight and obesity in adults.
- Toth MJ, Tchernof A, Sites CK, Poehlman ET (2013) Menopause-related changes in body fat distribution. Ann N Y Acad Sci 904: 502-6.
- Leeuw VDJ, Wassink AM, Graaf VDY, Westerveld HE, Visseren FL (2013) Second Manifestations of ARTerial Disease (SMART) Study Group. Age-related differences in abdominal fat distribution in premenopausal and postmenopausal women with cardiovascular disease. Menopause 20(4): 409-17.
- Bolanle AA (2017) Waist circumference disparity: a comparison of American, European and Asian cut offs among Africans. J Appl Biotechnol Bioeng 4(3): 605-608.
- Sobngwi E, Jarvis MF, Vexiau P, Mbanya JC, Gautier JF (2001) Diabetes in Africans. Part 1: epidemiology and clinical specificities. Diabetes Metab 27(6): 628-34.
- Nkpozi MO, Bozimo GE (2024) Correlations between Glycated Hemoglobin and Oral Glucose Tolerance Test, (and Some Cardiovascular Risk Factors) in a Cohort Population of Patients at the University of Port Harcourt Teaching Hospital (UPTH), Niger Delta Region of Nigeria. Asian Pac J Health Sci 11(1): 17-21.
- Shen D, Xiong H, Deng G, Jiang X, Zeng Q (2026) Association and diagnostic efficacy of waist-to-height ratio with glycemic control in young and middle-aged adults with early-onset type 2 diabetes mellitus. BMC Endocr Disord 26: 250.
- Akarsu GC, Dağ A, Erişmiş B, Oğuz EF, Şahiner ES (2026) Association of HbA1c levels with anthropometric measures and body composition: Emphasis on waist-to-hip ratio as a marker of glycemic impairment. Clin Sci Nutr 8(2): 90-97.
- Musa IR, Osman OE, Khair AM, Adam I (2025) The ability of anthropometric indices in detecting type 2 diabetes mellitus in Sudanese adults: a cross-sectional study. Scientific reports 15(1): 45513.
- Wang L, Wang W, Ji Y, Zong G (2025) The product of waist-to-height ratio and glycated hemoglobin, a novel predictor of diabetes in East Asian populations: insights from two large East Asian cohort studies. Diabetol Metab Syndr 17: 274.
- Nathan DM, Turgeon H, Regan S (2007) Relationship between glycated haemoglobin levels and mean glucose levels over time. Diabetologia 50: 2239-2244.
- Qin Z, Qin S, Li X, Liang B (2026) Predictive value of the waist-to-height ratio and HbA1c product for incident stroke: a stratified analysis by blood pressure status. Journal of stroke and cerebrovascular diseases 35(8): 108692.
- Lee JW, Ha GC, Kwak TJ (2025) The relationship between waist-to-height ratio, health-related physical fitness, and metabolic disease factors in middle-aged men in South Korea. Journal of Men's Health 21(6): 41-52.
- Huang C, Lopes A, Britton A. (2025) Which adiposity index is best? Comparison of five indicators and their ability to identify type 2 diabetes risk in a population study. Diabetes research and clinical practice, 225: 112268.
- Kim H, Park S, Park J, Son Y, Kim S, et al. (2024) National trends in type 2 diabetes mellitus stratified by central adiposity using waist-to-height ratio in South Korea, 2005–2022. Sci Rep 14: 24273.
- Liao J, Wang L, Duan L, Gong F, Zhu H, et al. (2025) The association between waist circumference, weight-adjusted waist index, waist-to-height ratio and waist divided by height0.5 and the prevalence of cardiovascular diseases in patients with diabetes. BMC Public Health 25(1): 2835.
- Chauhan K, Sathyapalan T, Malabu U, Joshi SR, Singh SK, et al. (2025) Machine learning identifies waist-height ratio (WHtR) as the strongest determinant of diabetes and prediabetes in children and adolescents: A comprehensive national nutrition survey. Int J Diabetes Dev Ctries.C

























