Near Infrared Spectrum for Non-Invasive Glucose Measurement
Ghozzi Dorsaf*, Manai Yacine and Nouri Khaled
National school of carthage engineer, Tunisia
Submission: April 04, 2019; Published: June 12, 2019
*Corresponding author: Ghozzi Dorsaf, National school of carthage engineer, N6 Abou Rauhan Bayrouni, Ariana, Tunisia
How to cite this article: Ghozzi D, Manai Y, Nouri K. Near Infrared Spectrum for Non-Invasive Glucose Measurement. Curre Res Diabetes & Obes J. 2019; 11(1): 555801. DOI: 10.19080/CRDOJ.2019.11.555801
Abstract
This paper deals with novel approach for non-invasive glucose monitoring based on NIR spectroscopy. The technique was demonstrated on 300 human serums of different concentrations range of 08-297 mg/dl. In order to compare the proposed approach to a standard one, a regression analysis was performed and used to predict glucose concentration overall range of values. In vitro experiments showed a strong correlation between noninvasively device result and real glucose concentration. The correlation was 0.97 and Clarke error grid analysis showed that 97.33% of the measured fall within the clinically acceptable regions. Results showed that the created model can open a new path to a real-time, painless and a portable device that would well-being the lives of millions of diabetics in the world.
Keywords:Non-invasive blood glucose measurement; Regression analysis; Near-infrared spectroscopy; In vitro; Diabetes; Insulin; Chronic disease; Insulin section; Blood sugar levels; Cellular energy; Coronary heart disease; Blood vessels
Abbreviations: SE: Standard Error; PLS: Partial Least Squares; RMSE: Root Mean Square Error; SECV: Standard Error of Cross-Validation; ANN: Artificial Neural Networks; SVR: Support Vector Regression; GP: Genetic Programming; RF: Random Forests; KNN:K-Nearest Neighbors; GE: Grammatical Evolution; FLR: Fuzzy Lattice Reasoning; NIR: Near-Infrared; LR: Linear Regression
Introduction
Diabetes is considered today the evil of the century. In just a few years, diabetes has become an epidemic affecting more than 422 million people worldwide [1]. Diabetes is a chronic disease hither to incurable, caused by a dysfunction of the insulin section. Insulin is produced by the pancreas, its interaction with glucose allow body’s cellular energy. Our body does not produce insulin accurately throughout the day, hence the importance of insulin to regulate blood sugar levels and assures balance from getting too high or too low [2].
Therefore, diabetes is a degenerative disease that without treatment can have very serious consequences, such as blindness, kidney failure and nerve damage. We cite also accelerating the hardening and narrowing of the arteries leading to strokes and coronary heart disease and blood vessels [3].
The latest technologies give every diabetic the chance to survive their life. Hence, they can control their blood glucose levels continuously and non-invasively [4]. In order to reach this goal, several techniques have been proposed, such as mathematical modeling, Artificial intelligence and advanced signal processing techniques.
Amneh et al. [5] proposed the technique of principal compo nent regression combined with a digital bandpass filter to predict blood glucose concentration. These approaches have decreased the standard error (SE) from 40 mg/dL using unfiltered spectra to 15.63 mg/dL using a Chebyshev filter.
JS Parab et al. [6] used the partial least squares (PLS) regression model to design a noninvasive glucometer. The experimental results were satisfying with the values of 3.459 for the root mean square error (RMSE).
In Yasuhiro et al. [7] exploited logistic regression analysis for identifying the factors affecting development of non-invasive blood glucose calibration model. As well, PLS is used to relate data with blood glucose concentration. These statistical approaches were successfully developed with the mean standard error of cross-validation (SECV) of 25.0 mg/dL and 80% of the validation samples fell within zone A of the Clarke error grid.
Artificial neural networks (ANN) have also been applied in the prediction of blood glucose concentrations. Indeed, Stavroula G et al. [8], Perez-Gandia et al. [9], Gavin Robertson et al. [10], Scott MP et al. [11] & Chiara Zecchin et al. [12] exploited ANN to provide short term prediction of blood glucose levels. The RMSE of model predictions was reported as 13.65, 9.7, 10.09, 43.9 and 14 mg/dL respectively.
More elaborate research based on support vector regression (SVR) have been also proposed for real-time glucose prediction [13-16].
In order to choose the best calibration Ming & Raveendran [17] used two different techniques: PLS and feed-forward backpropagation neural network. The RMSE is around 0.5282mmol/L and 0.2952mmol/L, respectively. Therefore, ANN proved its effectiveness correlation factor of 0.9863.
Hidalgo et al. [18] proposed a comparative analysis of several machine learning techniques. The four models are based on genetic programming (GP), random forests (RF), k-nearest neighbors (KNN), and grammatical evolution (GE). For the analysis of experimental results, authors used the Clarke error grid in different forecasting horizons (t+30min, t+60min, t+90 min and t+120 min). Results show that GE and GP are better than KNN and RF since it performs well for short term forecast (30 min and 60 min).
The work of Falco et al. [19] in exploited GP based a type of symbolic regression called Multigene symbolic regression. This technique evolves linear model of the transformations of the input variables. Experimental results showed that this combination could predict blood glucose levels since they were sensitive to 91.03% of the points being in A and B zones of the Clarke error grid analysis.
To develop a solid prediction, a recent work based on the linear ARMAX model was advanced in Turksoy et al. [20] suggested Savitzky-Golay filter and a Kalman filter to treat the problem of noise in patient data. Results showed that the proposed alarm system gives a good performance with the value of 11.7 mg/dL for RMSE.
Simon et al. [21] proposed the technique of Fuzzy Lattice Reasoning (FLR) to predict blood glucose concentration. The experimental results were satisfying with the values of 0.93 for accuracy
Changsheng et al. [22] used the Logistic regression model to predict blood glucose using the Pima Indians Diabetes dataset. The accuracy and precision are around 0.9739 and 0.97, respectively.
In Han et al. [23] exploited K-means algorithm and Logistic regression algorithm to utilize the regression model for more than one dataset. The experimental results were successfully developed with 95.42% for accuracy to have 3.04% higher accuracy compared to other researchers.
The work of Christian et al. [24] in exploited partial least squares and neural network regression models to predict blood glucose concentration. Their invented sensor is based near-infrared (NIR), bioimpedance and skin temperature measurements. Experimental results showed that this combination could predict blood glucose levels since they were sensitive to 88% of the points being in A and B zones of the Clarke error grid analysis.
Other better prediction performance was obtained in [25,26]. Thus Jensen et al. suggested an optimized real time hypoglycemia detection using linear regression (LR). The results showed that LR was able for obtaining a good performance with a sensitivity of 81%. Using the same technique LR Anas et al. present the prediction of blood glucose levels for 10 patients. Although these results are promising, the technique needs to be validated with the Clarke error grid.
This research suggests the reliability of different types of regression in the prediction of blood glucose. The aim of this paper is to propose a regression predictor model that used near infrared (NIR) spectroscopy for self-monitoring blood glucose levels overall range values. Hence, the technique will be demonstrated on 300 human serum of different concentration range.
The rest of the paper is organized as follows: section 2 explains the different materials and methods used in this work. Section 2 presents the main results, the novel model and prediction results performed on data. Section 3 illustrates the discussion and comparison with other research. Conclusion and prospects are exposed in sections 4.
Materials and Methods
For years, researchers seeking to advance their work to avoid the painful measure of glucose level for diabetics. The development begins in 1980 while the execution comes after twenty years [27,28].
Several body parts were used to detect blood glucose, such as tears, saliva, earlobe etc. An American team at PERDUE University compared the different body zone and proved that glucose measurement system is more effective in blood than in saliva, tears or urine. Therefore, we are interested in our work to study the blood glucose concentration as a function of light variation through human serum.
Methodology
Among the invented sensor for continuous glucose monitoring, NIR spectroscopy obtained a big attention. Thus far, many researchers essayed to prove the feasibility of NIR spectroscopy [29,30]. In addition, recent research has shown that the most informative region for blood glucose concentration prediction is 2050-2300 nm regions [31]. Hence, this is why the NIR spectroscopy is used throughout this paper.

The designed device is based on NIR spectroscopy which is a proprietary technology aimed to ensure painless, comfort and accuracy. The measurement is achieved using NIR light source and a detector.
The NIR led is positioned in parallel with the photodiode, such that almost all emitted light reaches the photodiode. Thus, an invisible line is created between the two sides going through the test tube or fingertip.
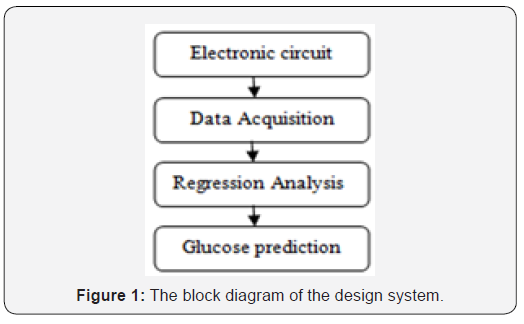
To illustrate briefly, blood glucose prediction is divided into four main parts as shown in Figure 1.
Database description
The quality of data from which an experiment setup is given affects the predictive capability of the sensor. In vitro experiment setup is highly important in the accuracy of noninvasive glucose measurement sensor. Thus, the engineering and algorithmic concepts can be validated. In this work, we will test the designed sensor in vitro.
The study was performed in accordance with BIOMAGHREB Tunisia which has been assessed and found to meet the requirement of ISO 9001. It is a private industrial company specialized in the manufacture of laboratory reagent and reagent for medical analysis. All experiments set up were carried out in accordance with the guidelines approved by doctors and biologists of BIOMAGHREB. Serum samples were obtained from 300 patients with different health status to present a comprehensive offer to glucose tests. Therefore, we assure top-level quality, reliable diagnosis and easy interpretation.

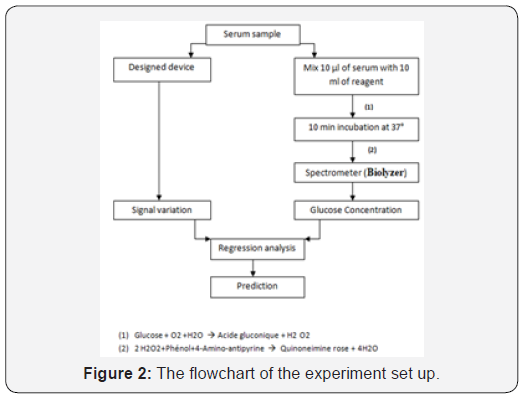
Prior to the experiments with the serum samples, test tubes were gently rinsed out with distilled water before measurement. All procedures and conditions were exactly identical. In the process to develop the system, kindly it is divided into two main parts as explained in Figure 2. First part shows the non-invasive technique to measure serum glucose by sensing the change in output signal. In the second part, a conventional spectrometer (Biolyzer 100) was used as reference to acquire the exact serum glucose concentration.
Main Results
Non linear regression model
Divers mathematical functions were tested to represent several relationships. They are not always sufficient to accurately reflect the uncertainly and the inaccuracy of the reality [32]. In this work, we use the nonlinear regression model to predict blood glucose concentration.
Our experience is based on the Beer-Lambert law given in Equation (1).

Where A is the Absorbance; I and o I are the incident and transmitted light intensity; α is the specific extinction coefficient of the compound; C is the concentration of the absorbing compound; finally, d is the optical path length. The law relates the blood glucose concentration to the path length of NIR light through human serum.
In order to more intuitively understand the influence of glucose concentration on the output voltage, lower glucose concentrations were taken into account in this paper. Thus, human serums were used to create a set of dilutions using deionized water. Therefore, the glucose concentrations considered in this experience are not representative of the blood glucose concentrations in humans. Specifically, the value of the glucose concentrations was varied from 8 mg/dL to 297 mg/dL. For modeling, we used 23 samples. The nonlinear regression model (equation 2) to the given data is measured through MATLAB version 8.5.0 (R2015a).


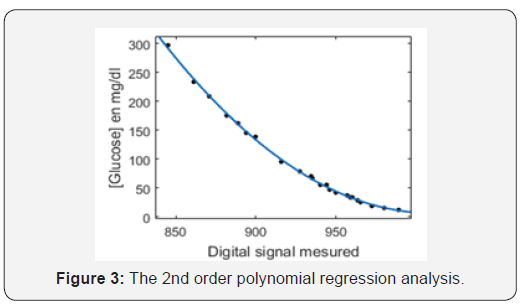
A nonlinear regression with only one independent variable X (Digital signal) and a dependent variable Y (Blood glucose concentration, (mg/dL)) is shown in Figure 3.

In this study, we fixed the Root Mean Square Error (RMSE), R-square, sum of squared errors and correlation coefficient. According to the literature, these measures are necessary for blood glucose prediction as well as the designed sensor’s accuracy [33]. These measures are listed in Table 1.
The correlation between serum glucose concentration and the measured digital signal was 0.97, demonstrating the ability to predict glucose concentration precisely due to strong physiological interferences. In addition, The RMSE analysis and the R-squared of regression model are found to be satisfactory with the values of 3.1 and 0.98, respectively.
Application of nonlinear regression model for blood glucose prediction
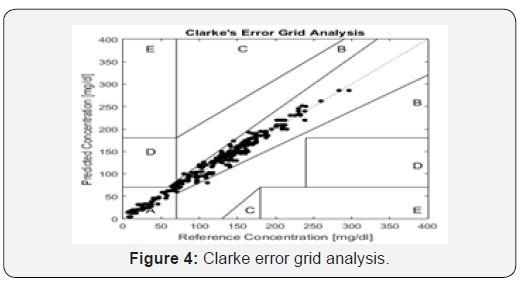
In this work, we report the detection of glucose over a concentration range from 8-297 mg/dL spiked in human serum. For the estimation of glucose in human serum, 3 ml of serum samples collected from healthy and diabetic patients was applied into invasive and non invasive glucometer. To evaluate the clinical accuracy, we applied the standard Clarke error grid analysis.

First, the glucose values are calculated from the human serum glucose concentrations, where all sampling procedures and conditions were identical. These glucose values are plotted as the predicted human serum concentrations on the y-axis, and the invasive glucose values that are measured by a Biolyzer 100 spectrometer are plotted as the reference concentrations on the x-axis. In Figure 4, the human serum glucose concentrations predicted from the design glucometer are plotted along with the reference values, where 97.33% of the results fall into the clinically acceptable zone A. We note that results show that the invented glucometer permits the monitoring of blood glucose concentrations noninvasively with good clinical accuracy. Furthermore, the analysis of biofluids, such as serum, using nonlinear regression model, produces high quality spectra with clearly defined spectral features.
Noninvasive blood glucose monitoring is needed to ensure a healthy life for diabetic patients. A spectroscopic glucose sensor was designed here in order to detect very low levels of glucose in human serum that may arise from the success of choice of the regression model as well as the components sensor and the accuracy of wavelengths used that was implemented in this study. Compared to the previous spectroscopic glucose sensors, there are three major differences in our new sensor design. The accuracy is guaranteed for prediction results for unknown samples in a short time. Indeed, validation of the result by incorporating the samples obtained from different patient population: different ages, sex type, blood group, cultural variation, daily dietary habits, etc. The above results open the scope for validating the model for in vivo setup and satisfying the Clarke error grid.
Discussion
We have presented the technology of the non-invasive glucose monitoring, which is based on near infrared spectroscopy. In vitro experiments setup results showed a strong correlation between calculated invasive glucose measurement and non invasive glucose concentrations in the presence of strong sensitivity.
To evaluate the performance of the device, in vitro setup was performed. The root mean square error analysis and the R-squared was 3.1 and 0.98, respectively. Clarke grid error consisting of 300 non invasive human serum values compared to reference invasive measurements using the Biolyzer 100 spectrometer showed that 97.33% of the measurements fall within the clinically acceptable A region.
This study indicates the potential use of the designed device as a noninvasive sensor for continuous blood glucose monitoring. In addition to showing acceptable accuracy, results demonstrate that this method has a high classification accuracy rate for prediction glucose concentration, and the detection is safe, painless, rapid and sensitive. Development of the designed device is currently focused on improving the performance.
Our model provides the chance of detecting blood glucose concentration in real time. This is useful for all diabetics people since the sensor was tested in serum collected from different populations.
Moreover, the choice of a good technique for the glucometer design affects the quality of results. To have the best results numerous glucometer are developed and improved in several research. Section 1 presents the best results in the literature. Based on these results, our experimental results prove that our chosen technique as well as the model is better than the other method [6- 8,10] expecting Changsheng et al. in [22]. However, experimental results of our study were in vitro. The advantages offered by the proposed results are the increase of percentage of success of the results in vivo.
Conclusion and Prospects
In this study, a novel approach is proposed for non-invasive glucose monitoring based on NIR spectroscopy. The technique was demonstrated on 300 human serums of different concentrations range of 08-297 mg/dl. A nonlinear regression model is suggested to predict blood glucose concentration. Compared to mathematical modeling described in the literature, our results have an important accuracy.
In conclusion, the rapid and noninvasive detection of glucose levels based on NIR spectroscopic combined with regression analysis provides an auxiliary tool for the early diagnosis of diabetes complications.
As future work, we will validate our glucometer in vivo. Further, we will focus on expanding our dataset with different patients states. More, we will connect our designed device to smart phone and applying the latest technologies to improve the quality of life and health.
References
- (2018) World health organization.
- Joseph JJ, Golden SH (2014) Type 2 diabetes and cardiovascular disease: what next? Curr Opin Endocrinol Diabetes Obes 21(2): 109-120.
- (2011) Standards of medical care. Diabetes care 34(1): 11-61.
- Omar S Khalil (1999) Spectroscopic and Clinical Aspects of Noninvasive Glucose Measurement. Clinical Chemistry 45(2): 165-177.
- Amneh A Al, Tanzilur R, Mohammed B (2010) Determination of glucose concentration from near-infrared spectra using principle component regression coupled with digital bandpass filter. IEEE pp. 243-248.
- JS Parab, RS Gad, GM Naik (2010) Noninvasive glucometer model using partial least square regression technique for human blood matrix. Journal of applied physics 107: 104-701.
- Yasuhiro U, Ayaka S, Akifumi I, Keiko F, Yoshio N, et al. (2015) Logistic regression analysis for identifying the factors affecting development of non-invasive blood glucose calibration model by near-infrared spectroscopy. Chemometrics and Intelligent Laboratory Systems 148: 128-133.
- Stavroula GM, Aikaterini P, Dimitra I, Konstantina SN, Andriani V, et al. (2006) Neural Network based Glucose – Insulin Metabolism Models for Children with Type 1 Diabetes. Conf Proc IEEE Eng Med Biol Soc 1: 3545-3548.
- Perez-Gandia C, Facchinetti A, Sparacino G, Cobelli C, Gomez EJ, (2010) Artificial neural network algorithm for online glucose prediction from continuous glucose monitoring. Diabetes Technol Ther 12(1): 81-88.
- Gavin R, Eldon DL, William S, David H (2011) Blood Glucose Prediction Using Artificial Neural Networks Trained with the AIDA Diabetes Simulator: A Proof-of-Concept Pilot Study. Journal of Electrical and Computer Engineering.
- Scott MP, Brent DC, Paul MR, Raymond EB, Thomas JP, et al. (2011) Neural Network-Based Real-Time Prediction of Glucose in Patients with Insulin-Dependent Diabetes. Diabetes Technol Ther 13(2): 135-141.
- Chiara Z, Andrea F, Giovanni S, Giuseppe N (2012) Neural Network Incorporating Meal Information Improves Accuracy of Short-Time Prediction of Glucose Concentration. IEEE Trans Biomed Eng 59(6): 1550-1560.
- Eleni IG, Vasilios CP, Diego A, Michela M, Ivana Z, et al. (2013) Multivariate Prediction of Subcutaneous Glucose Concentration in Type 1 Diabetes Patients Based on Support Vector Regression. IEEE J Biomed Health Inform 17(1): 71-81.
- Razvan B, Nigel S, Cindy M, Jay S, Frank S (2013) Blood glucose level prediction using physiological models and support vector regression. 12th International Conference on Machine Learning and Applications pp. 135-140.
- Takwa H, Jaouher BA, Véronique DC, Farhat F, Eric M, et al. (2018) Accurate prediction of continuous blood glucose based on support vector regression and differential evolution algorithm. Biocybernetics and Biomedical engineering 38(2): 362-372.
- Eleni IG, Vasilios CP, Demosthenes P, Dimitrios IF (2015) Evaluation of short‑term predictors of glucose concentration in type 1 diabetes combining feature ranking with regression models. Med Biol Eng Comput 53(12): 1305-1318.
- Chuah ZM, P (2009) Comparison Analysis Between PLS and NN in Noninvasive Blood Glucose Concentration Prediction. International Conference for Technical Postgraduates.
- Ignacio HJ, Manuel C, Gabriel K, Stephan MW, Oscar G, et al. (2017) Data Based Prediction of Blood Glucose Concentrations Using Evolutionary Methods. J Med Syst 41(9): 142.
- De Falco I, Cioppa AD, Giugliano A, Marcelli A, Koutny T, et al. (2019) A genetic programming-based regression for extrapolating a blood glucose-dynamics model from interstitial glucose measurements and their first derivatives. Applied soft computing journal 77: 316-328.
- Kamuran T, Elif SB, Lauretta Q, Elizabeth L, Derrick R, et al. (2013) Hypoglycemia Early Alarm Systems Based on Multivariable Models. Ind Eng Chem Res 52(35): 12329-12336.
- Simon F, Sabah M, Jinan F, Chee KK (2013) Using causality modeling and fuzzy lattice reasoning algorithm for predicting blood glucose. Expert System with applications 40(18): 7354-7366.
- Changsheng Z, Christian UI, Wenfang F (2019) Improved logistic regression model for diabetes prediction by integrating PCA and K-means techniques. Informatics in medicine unlocked pp. 2352-9148.
- Han W, Shengqi Y, Zhangqin H, Jian H, Xiaoyi W (2017) Type 2 Diabetes Mellitus Prediction Model Based on Data Minin. Informatics in Medicine Unlocked 10: 100-107.
- Christian T, Ole E, Odd MS, Håvard K, Jan OH (2018) Non-invasive prediction of blood glucose trends during hypoglycemia. Analytica Chimica Acta (18): 31444-31442.
- Morten HJ, Toke FC, Lise T, Edmund S, Mette DJ, et al. (2013) Real-Time Hypoglycemia Detection from Continuous Glucose Monitoring Data of Subjects with Type 1 Diabetes. Diabetes Technol Ther 15(7): 538-543.
- Anas MN, Syafirah A, Norali AN, Normahira M (2012) Non-invasive blood glucose measurement: Application of near infrared optical measurement. IEEE conference on sustainable utilization and development in engineering and technology pp. 258-261.
- Djakouré-Platonoff C, Radermercker R, Reach G, Slama G, Selam J (2003) Accuracy of the continuous glucose monitoring system in inpatient and outpatient conditions. Diabetes and Metabolism 29(2): 159-162.
- Benhamou PY, Catargi B, Delenne B, Guerci B, Hanaire H (2012) Real-time continuous glucose monitoring (CGM) integrated into the treatment of type 1 diabetes: consensus of experts from SFD, EVADIAC and SFE. Diabetes Metab 38(4): 67-83
- XF Lu, TL Zhang, F Xiao, G Li, Y Wang (2016) Noninvasive Blood Glucose Analysis Based on Near-Infrared Reflectance Spectroscopy. Spectroscopy and Spectral Analysis 36(7): 2312-2317.
- M Goodarzi, S Sharma, H Ramon, W Saeys (2015) Multivariate calibration of NIR spectroscopic sensors for continuous glucose monitoring. Trac-Trends in Analytical Chemistry 67: 147-158.
- MN Islam (2015) Near-infrared lasers for non-invasive monitoring of glucose, Ketones, HBA1C, and other blood constituents. US 2015/0305658 A1.
- Xizhao W, Minghu H (1992) Fuzzy Linear Regression Analysis. Fuzzy sets and systems 51(2): 179-188.
- Han J (2006) Accuracy and error measures Concepts and Techniques. Data mining. United States of America: Elsevier, pp. 770.


