


A Note on Preliminary Test Estimator in High Dimensional Regression Model
Arashi M* and Norouzirad M
Department of Statistics, Shahrood University of Technology, Iran
Submission: October 06, 2018; Published: February 25, 2019
*Corresponding author: M. Arashi, Department of Statistics, Faculty of Mathematical Science, Shahrood University of Technology, Shahrood, Iran
How to cite this article: Arashi M, Norouzirad M. A Note on Preliminary Test Estimator in High Dimensional Regression Model. Biostat Biometrics Open Acc J. 2019; 9(2): 555756. DOI: 10.19080/BBOAJ.2019.09.555756
Abstract
In this note, we show how to construct the well-known preliminary test estimator to be practical in the high dimensional linear regression model. The strategy is to use a high dimensional test when it is a priori suspected that the parameter may be equal to zero.
Keywords: High dimension; Preliminary test estimator; Regression model
Abbrevations: UE: Unrestricted Estimator; PTE: Preliminary Test Estimator; DLBCL: Diffuse Large B-Cell Lymphoma; CLL: Chronic Lymphocytic Leukemia; FL: Follicular Lymphoma
Introduction
In genomic studies the collected data have a challenging feature that the number of variables is relatively large to the number of sample. Genetic epidemiology, apparently is a suitable example of such data sets, where the number of subjects, ,n is in the thousands, while the number of variables, ,p ranges from tends of thousands to hundreds of thousands of genetic features. In the high dimensional regression model three goals may be considered. According to Wasserman and Roeder [1], the first and second are finding models with good prediction error and estimating the true sparsity pattern. The second goal deals with the set of covariates  with non-zero regression coefficient. However, there is another goal that has attracted considerable attention among researchers. It is refining the sample covariance matrix in some sense, that can be invertible to construct the test statistic and do the related inferential issues. This goal does not incorporate variable selection methods to map the data into a subset of
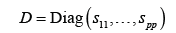
The methodology that we use to follow the third goal is adopted from Srivastava [2]. The idea is that in high dimensional setup, since n is smaller than ,p the sample covariance matrix, ,S may be singular, however the diagonal matrix constructing from diagonal elements of S is non-singular and the natural inferential analysis can be considered using this diagonal matrix under some mild regularity conditions.
In this paper, we deem to extend the estimation theory of mean parameter in multivariate regression models by incorporating non-sample prior information under a high dimensional setup.
High Dimensional Preliminary Test Estimator
Consider the high dimensional regression model given by.
where, is the p-vector response, with ,p>N,
  is the p-vector of disturbances,
  is the location vector. We do not assume any specific distributional assumption for the error term, however it has the following characteristics,

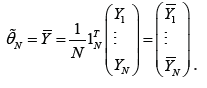
The unrestricted estimator (UE) of θ is given by
Define the matrix 1,SVn= 1,nN=− where
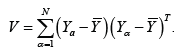
In the high dimensional regression, the matrix V may be singular. However, the diagonal matrix consisting of only the diagonal elements of V=(v
is a non-singular matrix. To construct the test statistics for testing we use the test statistic
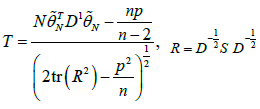
We reject the null-hypothesis as soon as T≥Z1-α where Z1-α is the upper α critical value from the distribution of T.
We make use of the following result for the distribution of the test statistic .T
Theorem 1. [2]
 following asymptotic distribution
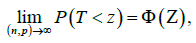
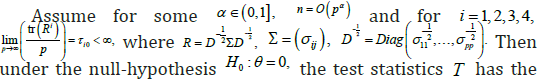
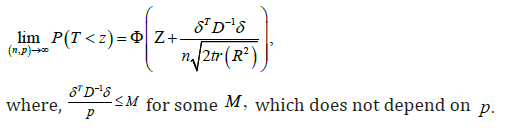
Where ()Φ⋅ is the cumulative distribution function of the standard normal distribution. Further, suppose that under the alternative hypothesis ,AH the local assumption  for some constant vector δ holds, Then the test statistics T has the following asymptotic distribution.
Following Saleh [3], the high dimensional preliminary test estimator (PTE), is defined as
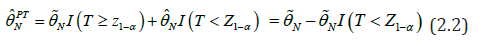
where  is the restricted estimator (RE).
Vision of the risk
In this section, we provide a graphical illustration of the risk function, from the asymptotic view point. We display the graphs of the risk functions for the three proposed estimator. For our purpose, we assume  and
and  the regularity conditions of Theorem 1 satisfy. Since the error term in the multivariate model is distribution free, we prefer not to generate Y and therefore, to incorporate a singular matrix V in our computation we generate ()1pp−× random matrix and let the thp row be the sum of the others. From Figure 1 it is clear that the risk functions of the RE and PTE have increasing trend with respect to
  TθθΔ= It can be also seen as p increases, domination nature of the PTE over the UE covers for a bigger range of 2,Δ which again suggests the superiority of this estimator over the UE.
Blood Cancer Data
The lymphoma leukemia dataset provides expression for 4,026p=genes across 62N=patients with 42 samples of diffuse large B-cell lymphoma (DLBCL), 9 samples of follicular lymphoma (FL), and 11 samples of chronic lymphocytic leukemia (CLL). This data is taken from the package “spls” [4]. Lymphoma is a type of cancer that begins in immune system cells called lymphocytes. Like other cancers, lymphoma occurs when lymphocytes are in a state of uncontrolled cell growth and multiplication. Lymphocytes are white blood cells that move throughout the body in a fluid called lymph. Also, lymphocytes Lymphoma is the most common form of hematological malignancy, or “blood cancer”, in the developed world. The value of the test statistics is equal to 4.972658 that compared to 0.951.96,z= suggests that the PTE is reduced to the UE, from an asymptotic viewpoint.
References
- Wasserman L, Roader K (2009) High-dimensional variable selection. Ann Statist 37(5A): 2178-2261.
- Sirvastava MS (2009) A test for the mean vector with fewer observation than the dimension under non-normality. J Mult Anal 100(3): 518-532.
- Saleh AK Md Ehsanes (2006) Theory of Preliminary Test and Stein-Type Estimation with Applications, John Wiley, New York.
- Chung D, Chun H, Keles S, (2012) spls: Sparse Partial Least Squares (SPLS) Regression and Classification. (R package version 2.1-2).


