


Assessment of Diabetic Patients Among Adults in Maiduguri, Using Multivariate Discriminant Model
Umar Yusuf Madaki1, Singh VV2* and Musa Dalah Chiwa3
1,3Department of Mathematics and Statistics,Yobe State University, Nigeria.
2Department of Mathematics Yusuf Maitama Sule University, Kano, Nigeria
Submission: September 04, 2018; Published: February 06, 2019
*Corresponding author: VV Singh, Department of Mathematics Yusuf Maitama Sule University, Kano, Nigeria
How to cite this article: Umar Y M, Singh VV. Musa D C. Assessment of Diabetic Patients Among Adults in Maiduguri, Using Multivariate Discriminant Model. Biostat Biometrics Open Acc J. 2019; 9(1): 555754. DOI: 10.19080/BBOAJ.2019.09.555754
Abstract
This paper assesses the study that has carried out based on the broad objective of using the multivariate discriminant model for tackling diabetic patients among adults in Maiduguri, Borno state Nigeria. In this research work, data collected from the University of Maiduguri teaching hospital for ten (10) consecutive years from (2002-2011) of 987 patients. The data analyses were done using Fisher’s method and Omnibus Chi-Square test. The Diabetic patient’s responses categorized into two groups which include: Healthy (“0”) and Diabetic (“1”). Various variables (predictors), i.e., Age, Sex, Weight, Blood sugar and Urine sugar are used based on discriminant analysis. Using Fisher’s method of discriminant analysis, classification table that we got by selecting that option in the results obtained. The Overall % correctly classified = 88.2% for the male counterparts and 89.4% for the female counterparts. By relating actual groups to predicted groups percentage correct predictions without percentage accurate predictions and cross validation. In addition to that, the omnibus Chi-square test is a log-likelihood ratio test for investigating the Discriminant model coefficients (Age and Sex). The model coefficients are statistically significant as we reject H0 if p<0.05 at the 5% level of significance. The study concluded that Base on the analysis it shows female are mostly affected by the disease and the kinds of misclassification that took place. It also recommended that the Discriminant model built should be used for capable of tackling diabetes mellitus cases in (UMTH), Maiduguri, and Borno state [1-4].
Keywords: Discriminant analysis; Fisher’s Method; Diabetes mellitus; Maiduguri
Introduction
Discriminant analysis was introduced by [5] as a statistical method for separating two groups of populations [4]. Extended this multivariate technique to multiple populations. At the basis of observations with known group membership–the training data–so-called discriminant functions are constructed aiming at separating the groups as much as possible. These discriminant functions can then used for classifying new observations to one of the populations. We distinguish linear and quadratic discriminant analysis, and this terminology refers to the discriminant function that is to build. In this case, we focus on Fisher’s method (for two or more populations) leading to linear discriminant functions [6]. The problem can formulate as a simple eigenvector/Eigenvalues problem, and the plan is attractive and frequently used in practice. The discriminant analysis used in situations where the clusters are known a priori.
The discriminant analysis aims to classify an observation, or several views, into these known groups [7]. The discrimination rule has to organize the customer into one of the two existing groups, and the discriminant analysis should evaluate the risk of a possible “bad decision.” Multivariate methods are relevant in virtually every branch of applied medicine, pharmacy, and public health [8]. They come into play either when we have a medical theory to test or when we have a relationship in mind that has some importance for medical decision or policy analysis in public health. According to [9], classification of observation into one of the several populations is discriminant analysis, while relating quantitative variables to other variables through a logistic (cumulative density function) function form is a logistic regression. The estimates generated from one of these methods often used in the other. However, the conditions for the application of both are not the same.
Discriminate function estimators have commonly been used in logistic regression in both theory and implementation [7] reported that when discriminant function estimators were compared empirically with maximum likelihood estimators for logistic regression; problems, they were found to be generally inferior, although not always by a substantial amount. According to [10], the issue of classification arises when an investigator makes some measurements on an individual and wishes to classify the individual into one of several categories by these measurements. The investigator cannot identify the individual with a group directly but must be used. In many cases, it can be assumed that there are a finite number of groups or population from which individual may have come, and each community characterized by a probability distribution of the measurements [10]. The discrimination problem is distinct from the logistic regression problem and, as might be expected, solutions generally proposed for the one are different from those for the other, although they are related. In some situations (such as when at least one variable is qualitative), the differences in solution become substantial [7].
Diabetes Mellitus is a group of metabolic conditions characterized by high blood sugar or hyperglycemia, and by both underand- over secretion of insulin, the hormone that transports glucose across cell membranes [2,11]. It is a chronic disorder of carbohydrate metabolism resulting from insufficient production of insulin or the inadequate utilization of this hormone by the body’s cells. Diabetes is a significant health matter globally. There is a need for planning to reduce the threat of this disease. Change in lifestyle and using balanced food can reduce the rate and danger of diabetes in patients [12]. This disease disturbed not only the economy of third world countries, yet a list of more advanced nations are expanding a more significant amount of their budget for preventing and curing against this disease. Complications from diabetes include blindness, renal disease, high B.P and stress, CHD, high or low cholesterol level in blood, damage of nerves, arterial affected problems, and stroke therefore, there is a need for advertising, consulting and liaison with adults above 40 years of age, so as to know the implication, cause, and prevention and control the disease. Within this framework, the paper seeks to achieve this study aims to develop discriminant models that are capable of tackling diabetes mellitus patients among adults based on weight, age, gender, blood and urine sugar levels and the following objectives. The scope of this research is concentrated on following three significant predictions;
a) To determine the number of patients that are correctly classified using Fisher’s method.
b) To identify if other variables apart from the significant variables selected are substantial.
c) Assess the dependence of the discriminant functions (Age and sex) in a group separation.
Materials and Methods
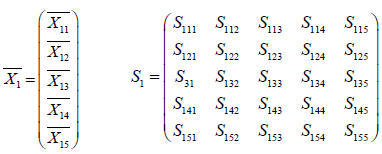
In this research design, we have considered all the factors which involved in; the simple random sampling is the chosen sampling design. The five (5) selected predictor variables which are capable of characterizing a Diabetic patient have analyzed [13]. The experience and records of medical practice, these variables are also believed to vary significantly between normal healthy (π1) and people with diabetes (π2) . The following vectors are required for the Euclidean distance; we need the mean vectors and the covariance matrices of a sample of both normal healthy (π1) and people with diabetes (π2) .
X =Sex, where 2 x is coded as 1 for male and 2 for female.
X = Age
X = Weight (kg)
X = Blood sugar (mill moles per liter)
X = Urine sugar (mill moles per liter)
For normal healthy patients,
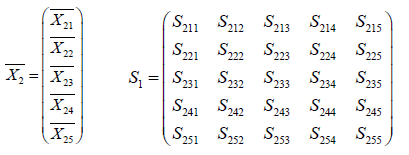
For Diabetic patients
The Euclidean distance of the population of normal healthy ( ) 1 π is
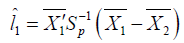
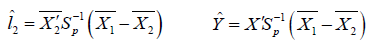
S is the pooled covariance matrix. The mean Euclidean distance is given by [12]. Similarly, the Euclidean distance of the population of diabetic ( ) 2 π is
The discriminant function, therefore, obtained as follows:
The mean Euclidean distance for populations ( ) 1 π and ( ) 2 π is given by

The discrimination function can get by 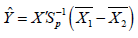
Making use of some empirical data, the classification rule for the person with diabetes ( ) 2 π if otherwise, and the patient is standard ( ) 1 π can be categorized as Yˆ ≥ Mˆ is a diabetic ( ) 2 π otherwise normal ( )
The following table exemplified in the following for the health status of a diabetic or healthy person [14].
Omnibus chi-square test
The omnibus Chi-square test is a log-likelihood ratio test for investigating the Discriminant model coefficients for the given Hypothesis
H : The model coefficients are not statistically significantH :The model coefficients are statistically significant
H :The model coefficients are statistically significant
Test statistic
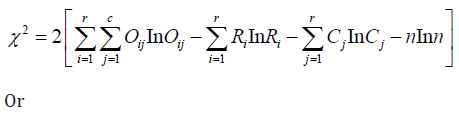
Or
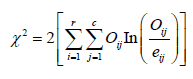
Where
ijO ,iR ije are observed value, row total, column total and expected values respectively
Decision rule
Reject H0 if 0.05p< otherwise accept H0 at the 5% level of significance. The primary importance of the model coefficient is in the Discriminant model. Hence, the Omnibus test is applied.
Plans and methods of data collection
Secondary means of data collection employed through a suitable design clinical survey, and the study conducted in Maiduguri with data obtained from University Of Maiduguri Teaching Hospital, (UMTH) Maiduguri. The age, sex, blood sugar level, urine sugar level, and weight were recorded, collected and tabulated for diabetics’ patients respectively. Statistical package for social sciences (SPSS) version 17 employed for the analysis based on recorded data of (987) Diabetic patients at the University of Maiduguri Teaching Hospital, (UMTH) from the year (2002-2011) [15,16].
Results and Discussion
Interpreting the printout results
In the discriminant analysis we are trying to predict group membership, so firstly we examine whether there are any significant differences between groups on each of the independent variables using group means and ANOVA results data. Table 1 test of equality of group means the results of univariate ANOVA’s carried out for each independent variable are highly significant they differ (Sig.=.000) (Table 2). The Pooled Within-Group Matrices also supports the use of these IV’s as covariance, Age and Weight are highly significant while intercorrelations are moderately good.

Table 3 Provides an index of the importance of each predictor like the standardized regression coefficients (beta’s) did in multiple regression. The sign indicates the direction of the relationship. Blood sugar was the strongest predictor while Urine sugar was next in importance as a predictor. These two variables with large coefficients stand out as those that strongly predict allocation to the Diabetic or Healthy group. Age, absence from work and Weight were less successful as predictors. These “discriminant function coefficients” work just like the beta-weights in regression. Based on these, we can write out the equation for the discriminant function:
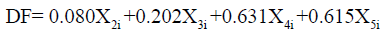
Using this equation, given the Diabetic variables on Age, Weight, Blood sugar, and Urine sugar, we can calculate their score on the discriminant function. The standardized canonical discriminant function coefficients table. The interpretation of the discriminant coefficients (or weights) is like that in multiple regressions.


Group centroids
A further way of interpreting discriminant analysis results is to describe each group regarding its profile, using the group means of the predictor variables. These group means are called centroids.

These display in the Group Centroids table (Table 4). Healthy patients have a mean of -1.200 while Diabetic patient produces an average of 1.161. Cases with scores near to centroids predicted as belonging to that group.
Unstandardized Canonical Discriminant Functions Evaluated At Group Means. Here are the group centroids. If someone’s response on the discriminant function is closer to –1.200, then the data came for is patient is healthy “response (0)”. If the reaction on the DF is closer to 1.161, then the data probably came from a Diabetic patient. In practical terms, we usually figure out which group a person is in by calculating a cut score halfway between the two centroids:
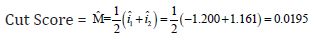
If an individual patient on the DF (calculated by plugging in their scores on Age, Weight, and Blood sugar and Urine sugar to the DF equation we wrote out above) is above 0.0195, then they were probably Diabetic patients. If their DF score is below 0.0195, then they were perhaps healthy patients (Table 5).

Fisher’s linear discriminant functions
The Fishers linear discriminant model for each group is computed as follows:
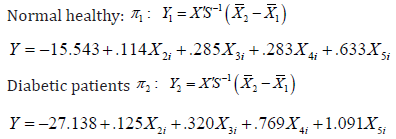
The classification rule is to substitute into the Fishers linear discriminant model for each group evaluate; then classified into the group whose model produced the higher discrimination score. This criterion is entirely equivalent to the standardized linear discriminant model (Table 6).
a) 2% of selected original grouped cases correctly classified.
b) 88.5% of unselected original grouped cases correctly classified.
Here’s the classification table that we got by selecting that option in the SPSS dialog box. It gives information about actual group membership vs. predicted group membership. Overall % correctly classified = 88.2%. This part of the table shows you what kinds of misclassification took place. By relating actual groups to predicted groups Percentage correct predictions without percentage correct predictions without cross-validation.

The classification rule that is as follows:
• Classify as Group 0 (Normal Healthy) if Y<0.0195
• Classify as Group 1 (Diabetic patient) if Y≥0.0195

The model also tested for goodness of fit and classificatory power for new observations. The discriminant model has some few patients with the misclassified case for UMTH, Maiduguri which proves to be very good. This model is used to analyze the date which could be collected from other hospitals and other regions of the country. The predictions will be helpful for a cure for other patient and will be in welfare or Nigerian society.
Discriminant analysis on female responses
The Table 7 shows the means that we asked for it gives means on each variable for people in each sub-group, and also the overall mean on each variable. A rough idea of variables that may be significant can obtained by inspecting the group means and Standard deviations. The mean differences between Weight and Age depicted in to suggest that these may be good discriminators as the separations are large in Table 7 above ‘test of equality of group means the results of univariate ANOVA’s carried out for each independent variable are highly significant, they differ (Sig.=.000) (Table 8). The covariance matrix has 443 degrees of freedom. Table 9 gives us the standardized coefficients for each discriminant function.


These “discriminant function coefficients” work just like the beta-weights in regression. Based on these, we can write out the equation for the discriminant function:
Using this equation, given the Diabetic variables on Age, Weight, Blood sugar, and Urine sugar. We can calculate their score on the discriminant function. To figure out what that DF score means, look at the group centroids, below

Unstandardized canonical discriminant functions evaluated at group means.

Table 10 tells us the correlation between each item and the discriminant function. Those come from the table called “standardized canonical discriminant function coefficients.” Here are the group centroids. If someone’s response on the discriminant function is closer to –1.085, then the data came for is patient is healthy “response (0)”. If the response on the DF is closer to 1.23, then the data probably came from a Diabetic patient. In practical terms, we usually figure out which group a person is in by calculating a cut score halfway between the two centroids:

If an individual patient on the DF (calculated by plugging in their scores on Age, Weight, and Blood sugar and Urine sugar to the DF equation we wrote out above) is above 0.059, then they were probably Diabetic patients. If their DF score is below 0.059, then they were perhaps healthy patients (Table 11).

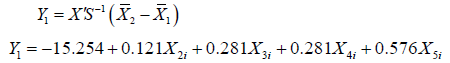
Fisher’s linear discriminant functions
The Fishers linear discriminant model for each group is computed as follows:
Normal healthy π1
Diabetic patients π2
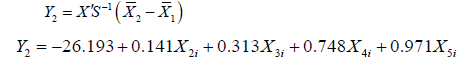
The classification rule is to substitute into the Fishers linear discriminant model for each group and evaluate; then classified into the group whose model produced the higher discriminant score. This criterion is equivalent to the standardized linear discriminant mode (Table 12).

a. 89.4% of selected original grouped cases correctly classified
b. 88.4% of unselected original grouped cases correctly classified
Non-parametric tests
(Table 13)

Chi-square test frequencies
a. 0 cells (.0%) have expected frequencies less than 5. The minimum expected cell frequency is 493.5.
b. 0 cells (.0%) have expected frequencies less than 5. The minimum expected cell frequency is 12.3 (Table 14-16).


Conclusion
The consistent high hit rates for all the analysis on the Diabetic Mellitus responses. The overall percentage of correct classifications which is 88.2 and 89.4%, as seen in the classification results for this study (Tables 6 and 12), which is a measure of predictive ability shows that discriminant analysis can be used to predict the patient’s knowledge or disability the diabetic responses of the variable(s) that have a relationship with cause of the disease. This study tends to illustrate the logicality and wisdom in examining related statistical technique used for prediction. The use of discriminant analysis in this manner that is, conducting discriminant analysis for predictive purpose enables us to identify the patient’s condition either he/she is healthy (“0” response), or diabetic (“1” response) termed at risk; as well as brought to light the difficulty in understanding its concept. Therefore, there is a need for instructional intervention.
In conclusion, this study shows that discriminant analysis provides results that are both more interpretable and statistically sound, in addition to being a statistically correct procedure for prediction purpose than traditional measures. Discriminant analysis classification is found to be vital and useful for diagnoses in any hospital. A multivariate normal distribution assumption holds for the response variables. This means that each of the dependent variables is generally distributed within groups, that any linear combination of the dependent variables normally distributed, and that all subsets of the variables must be multivariate normal.
I. Each group must have a sufficiently large number of cases.
II. Different classification methods may be used depending on whether the variance-covariance matrices are equal (or very similar) across groups.
III. Non-parametric discriminant function analysis, called kth nearest neighbor, can also be performed.
Recommendations
As this study focused on collected data from varies sources and analysis predicts the recommendations which would be beneficial for Doctors and hospitals in other part of country in African commitment we have following recommendations. The present analysis leads suggestion for the investigator working in health sector to control diseases named Diabetes.
i. In the light of the above, it recommended that Doctors and Clinics should adopt the use of the models built by this research to detect the prevalence of Diabetics among adults so that adequate measures for prevention and control of Diabetics can take early enough to alert the danger of the full manifestation of the disease.
It is also recommended that the Discriminant model built should be used for capable of tackling diabetes mellitus cases in (UMTH), Maiduguri, and Borno state.

References
- Efron B (1983) Estimating the error rate of a prediction rule: Improvement on cross-validation. Journal of the American Statistical Association (78): 316-331.
- Barry B, Hardin R (1982) Rational Man and Irrational Society, Sage Publications: Newbury Park, USA.
- Beléndez M, Méndez FX (1995) Adherencia al tratamiento de la diabetes: características y variables determinants. Revista de Psicología de la Salud, 7(1): 63-82
- Rao CR (1948) The utilization of multiple measurements in problems of biological classification. Journal of the Royal Statistical Society, Series B, 10: 159-203.
- Fisher, RA (1938) The Statistical Utilization of Multiple Measurements. Annals of Eugenics 8: 376 -386.
- Grimm LG, Yarnold PR (1995) Reading and Understanding Multivariate Statistics. Washington, D.C., American Psychological Association, USA.
- Halperin M, Balckwelder WC, Verter JI (1971) Estimation of the multivariate Logistic risk function: A comparison of the Discriminant function and Maximum likelihood approaches. Journal of chronic diseases 14(20): 125-158.
- Huberty CJ, Olejnik S (2006) Applied MANOVA and Discriminant Analysis, (2nd Edn). Hoboken, New Jersey: John Wiley and Sons, Inc. USA.
- James H Steiger (2011) Discriminant Analysis Department of Psychology and Human Development Vanderbilt University. African Journal Analysis Department of Psychology of Business Management 4(9): 312
- Liberman, Leslie Sue (2004) Diabetes mellitus, and medical anthropology, In Encyclopedia of Medical Anthropology. In: Carol R Ember, Melvin Ember (Eds.), NY: Kluwer Academic/Plenum, New York, USA Pp. 335-353.
- Singh RK (2011) Multivariate Statistical Analysis. IAENG 39(1): 1-6.
- Stevens JP (2002) Applied Multivariate Statistics for the Social Sciences, (4th Edn). Mahwah, New Jersey: Lawrence Erlbaum Associates, Inc. USA.
- Usman A (2015) Statistical Methods for Biometric & Medical Research. Millennium Printing and Publishing Company Limited, Kaduna, Nigeria, Pp: 486-495.
- Abba Badamasi, Singh VV (2018) New Odd Generalized Exponential-Exponential Distribution: Its Properties and Application. BBOAJ 6(3): 1-6.
- Chiwa, Musa Dalah, Singh VV, Abdulla Elton Abdalla Mohamad (2018) Statistical Survey Of HIV/AIDS, And Its Impact On Economic Development in Northern Nigeria During the Period 2010 – 2015. Journal of Statistical and Econometric Methods 7(3): 35-62
- Musa Chiwa Dalah, Singh VV (2018) A Study towards Awareness and Corrective Measures of HIV/AIDS in North-Western Part of Nigeria through Statistical Assessment. GJORM 5(3): 1- 8.


