


An Application of a New and Exact Generalized Chi-Square Test to Real Data
Sascha Worz*
Chair for Agricultural Systems Engineering, Technical University of Munich, Germany
Submission: June 12, 2018; Published: December 07, 2018
*Corresponding author: S Worz, Chair for Agricultural Systems Engineering, Technical University of Munich, Am Staudengarten 2, 85354 Freising, Germany
How to cite this article: Sascha W. An Application of a New and Exact Generalized Chi-Square Test to Real Data. Biostat Biometrics Open Acc J. 2018; 8(5): 555746. DOI: 10.19080/BBOAJ.2018.08.555746
Abstract
In this short communication, a new and exact generalized chi-square test which generalizes the famous chi-squared test is applied to real data.
Keywords: Applied hypothesis testing; Application of a new generalized chi-square test to real data
Mathematics Subject Classification 2010 62G10
Introduction and Short Literature Review
The famous chi-squared test homogeneity test can only be applied to absolute frequencies and underlies some restrictions on the sample size, the absolute frequencies and the expected frequencies. The former should be greater than 30, the absolute frequencies should attain a minimum of 10 and the expected frequencies should be bounded from below by 1, where at least 80 percent of them should be greater than 5, see [1,2]. In this short communication, a new and exact homogeneity test which generalizes the well-known chi-square test is applied to real data for the first time [3]. It generalizes the famous chi-squared test by assuming that the real data are realizations , of normally distributed random variables
  with unknown means μij > 0 unknown variances σij2>0 and
  whose squared sum obeys after standardization a chi-squared distribution with ,mn degrees of freedom. Especially, the test does not underlie any restrictions as reported in [1, 2].
Methodology
For the whole short communication, assume m,n ∈ N Suppose that the normally distributed and random variables  with unknown means μij>0 and unknown variances σij2>0 with
  are given, where the index i identifies the i-th are given, where the index i identifies the i-th sample and the index jidentifies the j-th characteristic and in addition
  and variances
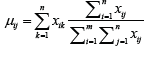
  have to be estimated from the available realizations
  This can be done in the following way: Define the well-defined mean
 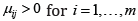 and j=1,.....,n by
and the well-defined variances 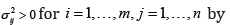
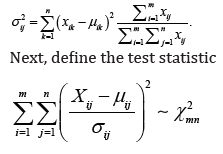
which is on the one hand exactly chi-squared distributed with mn degrees of freedom and on the other hand represents the squared sum of absolute standardized mean percentage errors. Finally, the following hypothesis test is considered: Let the null hypothesis 0H comprise the hypothesis that the characteristic random variables vectors 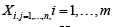 are identically distributed and the alternative hypothesis 1H the hypothesis that at least both of the characteristic random variables vectors are not identically distributed. Then, the null hypothesis 0His rejected or the alternative hypothesis H1 is accepted if and only if

where 0<α< 1 denotes the significance level. For details see [3].
Statistical example
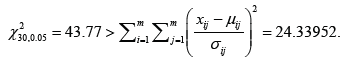
Consider the following deviations from skew diameters in [m] originating from 5 different samples and 6 different production machineries in biomedical engineering (Table 1). Then, for m=5 and n=6 and a significance level 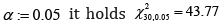 and calculating (1) yields that the alternative hypothesis 1H cannot be accepted or the null hypothesis 0H cannot be rejected since

Conclusion
In this short communication, a generalized chi-squared test which does not underlie any statistical parameter restrictions was applied for the first time to real data by considering a computational example which cannot be treated with the common chi-squared test.
Acknowledgement
This research work is/was funded by Bundesministerium fur Landwirtschaft und Erna¨hrung, Deichmanns Aue 29, 53168 Bonn.


