


Different Parameter Estimation Methods for Exponential Geometric Distribution and Its Applications in Lifetime Data Analysis
Feyza Günay1* and Mehmet Yilmaz2
1Graduate School of Natural and Applied Sciences, Ankara University, Turkey
2 Department of Statistics, Faculty of Science, Ankara University, Turkey
Submission: July 19, 2018; Published: September 25, 2018
*Corresponding author: Feyza Günay, Graduate School of Natural and Applied Sciences, Ankara University, Ankara, Turkey; Email: fgunay@ankara.edu.tr
How to cite this article: Feyza G, Mehmet Y. Different Parameter Estimation Methods for Exponential Geometric Distribution and Its Applications in Lifetime Data Analysis. Biostat Biometrics Open Acc J. 2018; 8(2): 555735. DOI: 10.19080/BBOAJ.2018.08.555735
Abstract
The new compound distributions which are started to be used with the study of Adamidis, et al. [1] still take place in recent studies. Exponential Geometric distribution, introduced by them, is a flexible distribution for modeling the lifetime data sets. They have used maximum likelihood method with expectation-maximization algorithm to estimate unknown parameters. In this paper, we use maximum likelihood and also least squares, weighted least squares, maximum product of spacings and l-moments methods to estimate the unknown parameters of exponential geometric distribution family. Then we compare the efficiency of these estimators via a simulation study for different sample sizes and parameter settings. At the end of the study, two lifetime data sets such as coal mine data and medical data about occupational safety and duration hospitalization studies are illustrated for application.
Keywords: Exponential geometric distribution; Maximum likelihood; Least squares; Weighted least squares; Maximum product of spacings; I-moments; Lifetime data analysis
Abbrevations:EG: Exponential Geometric; EP: Exponential Poisson; DFR: Decreasing Failure Rate; PE: Poisson-Exponential; CEG: Complementary Exponential Geometric; ML: Maximum Likelihood; EM: Expectation-Maximization; LS: Least Squares; WLS: Weighted Least Squares; MPS: Maximum Product of Spacings; LM: L-moments; AIC: Akaike Information Criterion
Introduction
Survival analysis includes modeling the time until the occurrence of an event of interest. It is generally considered as time until death or failure. In recent years, various compound distributions are proposed by using well known lifetime distributions. Firstly, the Exponential Geometric (EG) distribution proposed by [1] became the focus point of various studies [2-9]. In the same way with EG, [10] also proposed Exponential Poisson (EP) distribution which has decreasing failure rate (DFR). Barreto, et al. [4] generalized EP with the help of a power parameter and investigated its properties. [5] studied Poisson-Exponential (PE) distribution and its properties. [11] examined Complementary Exponential Geometric (CEG) distribution and its characteristics [12]. Similarly, [13-18] conducted various studies on compound distributions.
In this study, our aim is to estimate the unknown parameters of EG distribution family by using Maximum Likelihood (ML) estimation with Expectation-Maximization (EM) algorithm and Least Squares (LS), Weighted Least Squares (WLS), Maximum Product of Spacings (MPS) and L-moments (LM) estimation methods. We then compare the efficiencies of these estimators via a simulation study for different sample sizes and parameter settings. It should be noted that we have used different estimation methods from earlier studies. Additionally, we have illustrated the performance of fitting two data sets into the EG distribution.
To the best of our knowledge, this is the first study to obtain LS, WLS, MPS, LM estimators in the context of parameter estimation for EG distribution family. [1] have used ML estimators using the EM algorithm to estimate unknown parameters of EG distribution. So we compare the efficiency of estimators that we use with ML estimators used by them. The remaining sections of this paper are organized as follows. In Section 1, EG distribution is introduced briefly. Parameter estimation methods are presented in detail in Section 2. Results for an extensive simulation study to compare the performances of parameter estimation methods are presented in Section 3. Section 4 illustrates real data applications. Finally, main results are summarized in Section 5.
Exponential geometric distribution
Let N be a random variable has a geometric distribution with parameter p (probability for failure) and 12,,...,NYYY be random variables from exponential distribution with independent parameter .β For 1,i≥ iY and N are independent from each other; Let X be a random variable defined as 12{,,...,}NXYYY= then it follows a (),EGpβ distribution. The cumulative distribution function (cdf) is given as follows.

The survival and hazard functions of (),EGpβ distribution are

respectively. The probability density function (pdf) of X is given by

The probability density and hazard functions plotted for different parameter values for EG distribution are shown in Figure 1 and 2.


Parameter estimation
In this study ML, MPS, LS, WLS and LM methods are used to estimate the parameters of the EG distribution. In this section, we give details of these methods for estimation of parameters of the EG distribution.
ML estimation method
Let 12,,...,mXXX be a random sample from (),EGpβ distribution. In order to estimate the parameters of the EG distribution, the log-likelihood function is maximized with respect to the parameters. The likelihood and log-likelihood function can be written as

From these equations, the ML estimators of parameters cannot be obtained in an analytical form. So this nonlinear equations are solved by a numerical methods such as EM. [7] used a method called EM to obtain ML estimates in case of missing data. The EM algorithm gives remarkable results by computing the ML estimates at each renewal and repeating steps E and M until convergence occurs. Thus, an EM iteration, taking

In case of convergence, ML estimators are obtained for the parameters of EG distribution.
MPS method
This method which was proposed as an alternative to the maximum likelihood method, was first introduced by [6]. For the MPS and ML estimators emphasized that they are asymptotically equal and have asymptotic sufficiency, consistency and efficiency properties. The definition of uniform spacings for the MPS of the EG distribution as follows.

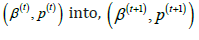
Where 1.iD=Σ The MPS method maximizes the geometric mean of intervals for finding the estimates of parameters. Let geometric mean G and its logarithm S are given by
β and ˆMPSp are obtained by equating the nonlinear derivative equations to zero.

The analytical solution of these equations cannot be obtained, but the estimates can be reached by iterative methods.
LS estimation method
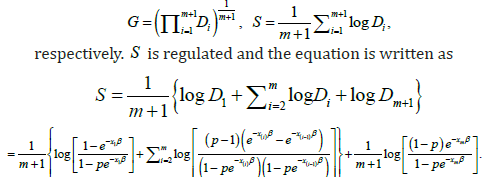
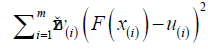
Let 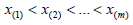 be the m order statistics of the random sample from EG distribution. The objective of LS estimation of the parameters is based on minimizing of the sum of difference between CDF F and empirical distribution ˆ
F. The LS estimators for parameters β and p can be found by minimizing of the following function
be the m order statistics of the random sample from EG distribution. The objective of LS estimation of the parameters is based on minimizing of the sum of difference between CDF F and empirical distribution ˆ
F. The LS estimators for parameters β and p can be found by minimizing of the following function

The arrangement of the mathematical equation in parentheses and its logarithm are

respectively. H can be written in logarithmic form as follows.
The LS estimator for parameter β is as given below.

With the help of (14), the LS estimator of p is obtained as follows.

Here ˆLSEβ and ˆLSEp are obtained as iterative equations.
WLS estimation method
For the EG distribution, the WLS estimates ˆWLSEβ and ˆWLSEp are obtained by minimizing the function given in the following equation.
It is well known that:  The cdf of the EG Distribution is written in the function as follows.

The WLS estimators ˆWLSEβ and ˆWLSEp of β and p are obtained as iterative equations by solving (18).

L-moments estimation method
The L-moments method was firstly proposed by [9] is similar to method of moment estimators. When the parameters are unknown, we need to equate sample L-moments with the population L-moments. The L-moment estimates for the EG distribution can be obtained by equating first two sample L-moments to first two population L-moments. For the EG distribution, the quantile function is given by

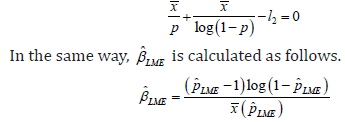
By equating these two sample and population L-moments, it is possible to obtain the LMEp estimator with the help of nonlinear equation given in the following.
Simulation Study
In this section, an extensive simulation study is conducted to compare the performances of parameter estimation methods under different scenarios. Performances are examined by using estimations, biases and mean square errors (MSE). Bias is absolute difference between the true value of the parameter and the expected value of the estimator of parameter. MSE is a well-known and widely-used criterion in the literature for comparing biased estimators with respect to their efficiencies. It is evaluated via sum of the variance of the estimator of parameter and the square value of bias.
Each experiment is repeated 1000 times in this study. Settings for sample sizes and parameter values are given in the following:
In Table 1, bias and MSE values of ML, MPS, LS, WLS and LM estimation with regards to parameters of EG distribution is presented for 50n= and sample size. In Table 2 and 3, it is presented for 100n= and 1000,n= respectively.


In view of MSE, it can be seen that MSE values of all estimators increases while β increases. Additionally, when β is greater than 5, MSE values of estimators of p decreases while p increases for 100.n= And while β increases, MSE values of estimators of p decreases. For MSE values of estimators of p decreases whilep increases. When 1000,n= estimation methods show ML, MPS and LM, show better performance than LS and WLS estimation methods, according to MSE criterions. In situations that are mentioned above, decreasing of MSE values indicates that estimators show better performance.

Application
In this section, we illustrate the applicability of EG distribution by considering two different data sets. First of them is a data set which is first obtained by [12]. This data set obtains the time intervals (in days) between coal mine accidents concluded death of 10 or more men, and the data set consists of 109 observations. It is named as coal mine data in literature. The coal mine data is given in Table 4. The second data set shows the duration of hospitalization (on daily basis) in a neurosurgical service of a research hospital in Turkey for 68 male patients. The data set is given in Table 5.


In this study, these data sets are modeled by EG, Weibull, lognormal, gamma and exponential distributions. The parameters of EG distribution are estimated using the ML method. Some criteria are used for comparison among distributions. These are Akaike information criterion (AIC) and Kolmogorov-Simirnov (KS) statistics which are good indicators to examine the fitting performance of distributions. Mathematical definitions of AIC is 22AICLLk=−+ where k is the number of parameters and LL is the log-likelihood function value of considered model. KS statistics is sup|()()|xnKSFxFx=− where ()nFx denotes the empirical distribution based on ordered data and F is the distribution function of considered distribution. It is known that, the distribution having smaller AIC and KS statistics values shows a better modeling capacity.
Parameter estimates of EG distribution are ˆ0.5602,p= ˆ0.0026β= for 109 coal mine data set. Calculated K-S statistic and AIC criteria for EG, Weibull, gamma, exponential distributions can be seen in Table 6. From the Table 6, it is seen that EG distribution gives the best fit to coal mine data in five models. In Figure 3, we give the graph of histogram with the fitted pdf of EG distribution for coal mine data.

We fit 68 male patients in neurosurgical service data to EG distribution and calculated parameter estimates as ˆ0.4173,p= ˆ0.0246.β= Calculated KS statistic and AIC criteria for EG, Weibull, gamma, exponential distributions can be seen in Table 7 for neurosurgical service data. According to this results, EG distribution gives the best fit to neurosurgical service data in five models. In Figure 4, we give the graph of histogram with the fitted pdf of EG distribution for neurosurgical service data. This graph supports the conclusion.


In this section we show that the EG distribution given by Equation (1) shows better performance with the lowest AIC and KS statistics for fitting the data sets than the other distributions.
Conclusion and Discussion
In this paper, some properties of EG distribution and used parameter estimation methods have been introduced. Parameter estimates of EG distribution have been obtained by the estimation methods which are not used before. We have compared the efficiencies of the estimators of EG distribution parameters in terms of Bias and MSE criteria via simulation study. The availability of EG distribution has been illustrated for two lifetime data sets. These data sets are coal mine data and neurosurgical service data which are two different study fields. It can be said that the EG distribution can be modeled better than the gamma, lognormal and Weibull distributions in terms of AIC and KS criteria for the data sets. EG distribution can be used also for different survival datasets and parameters of EG distribution can be estimated via estimators which is given in the study. In addition, Parameters of EG distributions can be estimated with also different estimator methods. And can be compared with the estimator methods which is mentioned in this paper.
References
- Adamidis K, and Loukas S (1998) A lifetime distribution with decreasing failure rate. Statist Probab Lett 39(1): 35-42.
- Adamidis K, Dimitrakopoulou T, Loukas S (2005) On an extension of the exponential geometric distribution. Statist Probab Lett 73(3): 259-269.
- Al-Zahrani B, Sagor H (2014) The Poisson-Lomax distribution. Revista Colombiana de Estadística 37(3): 223-243.
- Barreto-Souza W, Cribari-Neto F (2009) A generalization of the exponential-Poisson distribution. Statist. Probab Lett 79(24): 2493-2500.
- Cancho VG, Louzada-Neto F, Barriga GDC (2011) The Poisson-exponential lifetime distribution. Comput. Statist Data Anal 55(1): 677-686.
- Cheng RCH, Amin NAK (1983) Estimating parameters in continuous univariate distributions with a shifted origin. JR Statist Soc B 45(1): 394-403.
- Dempster N Laird, Rubin D (1977) Maximum likelihood from incomplete data via the EM algorithm. J R Stat Soc B 39(1): 1-38.
- Gupta RD, and Kundu D (2000) Generalized exponential distribution: different method of estimations. J Statist Comput Simul 69(4) 315-337
- Hosking JRM (1990) L-moment: analysis and estimation of distributions using linear combinations of order statistic. J R Statist Soc B 52(1): 105-124.
- Kus C (2007) A new lifetime distribution. Comput Statist Data Anal 51(9): 4497-4509.
- Louzada F, Roman M, Cancho VG (2011) The complementary exponential geometric distribution: Model, properties, and comparison with its counter part. Comput Statist Data Anal 55(8): 2516-2524.
- Maguir BA, Pearson ES, Wynn AHA (1952) The time intervals between industrial accidents. Biometrika 39(1): 168-180.
- Mahmoudi E, Sepahdar A (2013) Exponentiated Weibull-Poisson distribution: Model, properties and applications. Math Computers Simul 92: 76-97.
- Rezaeia S, Nadarajah S, Tahghighniac N (2013) A new three-parameter lifetime distribution. J Theor App Statist 47(4): 835-860.
- Ristić MM, Nadarajah S (2014) A new lifetime distribution. J Statist Comput Simul 84(1): 135-150.
- Singh U, Kumar M (2014) Estimation for the parameter of Poisson-exponential distribution under Bayesian paradigm. J Data Sci 12(2014): 157-173.
- Singh RK, Yadav AS, Singh SK, Singh U (2016) Marshall-Olkin Extended Exponential Distribution: Different Method of Estimations. Columbia Intern Pub J of Adv Comput 5(2): 12-28.
- Tomazella VLD, Cancho VG, Louzada F (2013) Bayesian reference analysis for the Poisson-exponential lifetime distribution. Chil J Statist 4(1): 99-113.


