A New Distribution with two parameters to Lifetime Data
Ali Doostmoradi
Department of statistics, Shahid Chamran University of Ahvaz, Iran
Submission: July 20, 2018; Published: September 17, 2018
*Corresponding author: Ali doostmoradi, Department of statistics, Shahid Chamran University of Ahvaz, Ahvaz, Iran, Tel: 98-916-8888460; Email: a-dostmoradi@stu.scu.ac.ir
How to cite this article: Ali Doostmoradi. A New Distribution with two parameters to Lifetime Data. Biostat Biometrics Open Acc J. 2018; 8(2): 555734. DOI: 10.19080/BBOAJ.2018.08.555734
Abstract
In this paper, we proposed a new distribution to lifetime data with two parameters, the proposed distribution have increasing, decreasing and unimodal failure rates function. Some mathematical properties of the new distribution, including hazard function, moments, Estimation of Reliability, distribution of the order statistics and observed information matrix were presented. To estimate the model parameters, the Maximum Likelihood Estimate (MLE) technique was utilized. Then, one real data set were applied to show the significance and flexibility of the new distribution.
Keywords: Moments; Hazard function; Maximum likelihood Estimate; Lifetime data
Abbrevations: MLE: Maximum Likelihood Estimate; L: Lindley; pdf: Probability Density Function; IL: Inverse Lindley; W: Weibull; MW: Modified Weibull; EW: Exponentiated Weibull; GL: Generalized Lindley; QL: Quasi Lindley; PL: Power Lindley; EGL: Extended Generalized Lindley; ENT: Entezar; EFWE: Exponential Flexible Weibull Extension; CDF: Cumulative Distribution Function; EGL: extended generalized Lindley; E: Exponential; GG: Generalized Gamma; IL: Inverse Lindley; M: Weibull; G: Gamma; EFWE: Exponential Flexible Weibull Extension; TTT: Total Time On Test; AIC: Akaike Information Criterion; BIC: Bayesian Information Criterion
Introduction
The modeling and analysis of lifetimes is an important aspect of statistical work in a wide variety of scientific and technological fields. Several lifetime distributions have been used to model such kinds of data. For instance, the extended generalized Lindley [1], generalized Lindley [2], generalized inverse weibull [3], power Lindley [4], Lindley [5], generalized gamma [6], quasi Lindley [7], Marshall-Olkin extended Lindley [8], Entezar [9], weighted Lindley [10], Generalized Modified Weibull [11], Modified Weibull [12], Exponentiated Weibull [13,14], inverse Lindley [15], Beta Modified Weibull [16], Generalized Power Lindley [17], Exponential Flexible Weibull Extension [18], Beta Weibull by Lee et al. [19] distributions. Each distribution has its own characteristics due specifically to the shape of the failure rate function which may be only monotonically decreasing or increasing or constant in its behavior, as well as non-monotone, being bathtub shaped or even unimodal.
In this section, we introduce some lifetime distributions proposed by scientists for modeling such data types.
I. The Lindley(L) distribution, with probability density function (pdf)

was introduced by Lindley [5].
II. Inverse Lindley (IL) distribution, with probability density function (pdf)

was introduced by Sharma et al. [15].
III. Weibull (W) distribution, with probability density function (pdf)

was introduced by Weibull [20].
IV. Modified Weibull (MW) distribution with probability density function (pdf)

was introduced by Lai et al. [15].
V. Exponentiated Weibull (EW) distribution with probability density function (pdf)

Was introduced by Mudholkar et al. [13,14].
VI. Zakerzadeh et al. [2] introduced a generalized Lindley (GL) distribution with the pdf

VII. Generalization gamma distribution with probability density function (pdf)

was introduced by Stacy et al. [6].
VIII. Shanker et al. [7] introduced the quasi Lindley (QL) distribution with the pdf

IX. Ghitany et al. [4] introduced the power Lindley (PL) distribution with the pdfs

X. Torabi et al. [1] introduced the Extended Generalized Lindley (EGL) distribution with the pdf

XI. Doostmoradi et al. [9] introduced the Entezar (ENT) distribution with the pdf

XII. Beih et al. [18] introduced the Exponential Flexible Weibull Extension (EFWE) distribution with the pdf

The aim of this paper is to introduce a new distribution to lifetime data with two parameters and show that it is better model for reliability analysis. Finally, one real data set were applied to show the significance and flexibility of the new distribution. The rest of the paper was organized as follows: A definition was given in Section 2, the moments considered in Section 3. In Section 4 the order statistics is obtain, Estimation of Reliability in Section 5 is obtain, estimations of the parameters were discussed in Section 6, analyses of one real data set was followed in Section 7; and finally, a comparison of the results with the existing distributions and conclusion were presented in Section 8.
A New Distribution
A new distribution was defined using the 2 parameters of α and β through the following Cumulative Distribution Function (CDF):

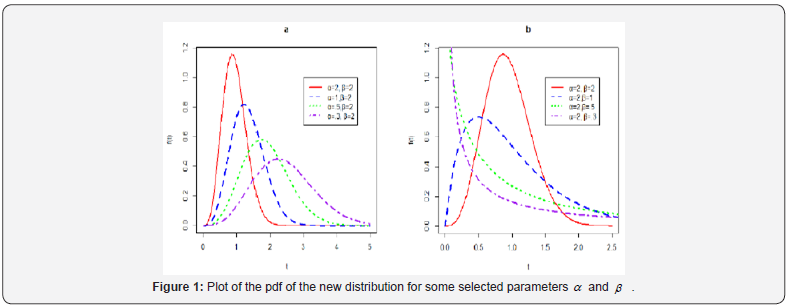
The new distribution was observed to have the decreasing and unimodal PDFs. Some density curves of the new distribution plotted for varied choices of the parameters are shown in Figure 1.
The survival function of the new distribution is given by the following formula:
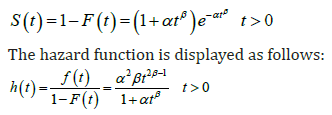
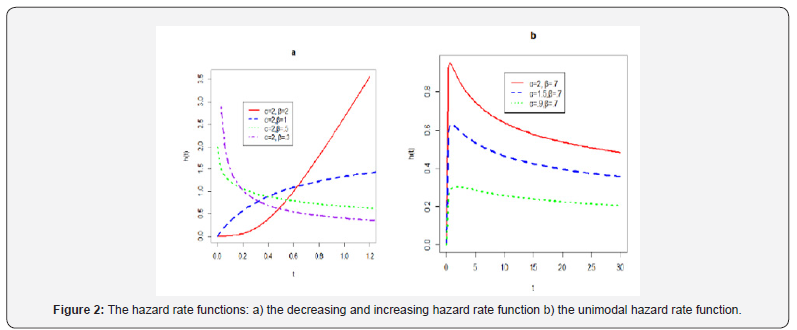
The new distribution depicts the decreasing, increasing and unimodal failure rates. Figure 2 plots some curves of the hazard rate function for different choices of the parameters.
Moments
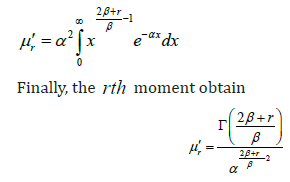
Some major characteristics of the distribution could be studied based on moments. The rth ordinary moment ()rrETμ′= of the new distribution is illustrated as follows:

Letting txβ= we have  Changing the variable t by ,x the expansion 3
Order statistics
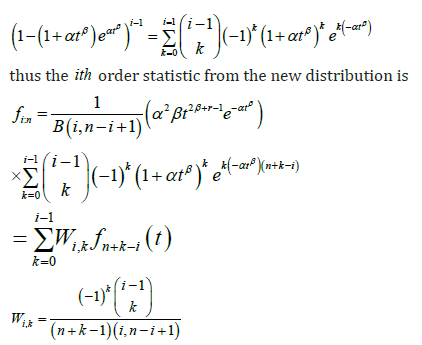
cdf and pdf as defined in 1 and 2, respectively. We now give the density of the ith order statistic :,inT ():inft rom the new distribution. It is well known that (fori=1,2,..,n)
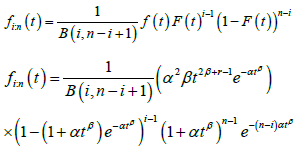
Using the binomial expansion we can rewrite the density function of the ith order statistic as a finite weighted sum of densities of the new distributions
Estimation of reliability R for new distribution
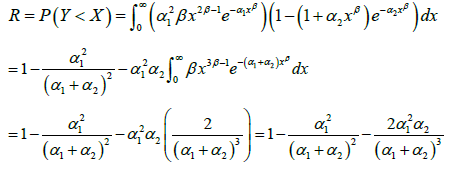
Let xf and yf be the pdfs of the independent random variables X and ,Y respectively. Then, the reliability function is defined as

if X new distribution (α1,β) and Y new distribution (α2,β) Then, the reliability function
R for new distribution is
Parameter estimation
We consider the estimation of the unknown parameters of the new distribution by the method of maximum likelihood. Let t1,...,tn be observed values of a random sample of size n from the new distribution. The log likelihood function for the vector θ=(α,β) of parameters can be written as:

The log-likelihood can be maximized either directly by using the R(nlminb)
The components of the score vector U(θ) are given by

The maximum likelihood estimate MLE ˆθ of θ is obtained by solving the non-linear likelihood equations 0,Uα= 0,Uβ=0 For interval estimation of (α,β) and tests of hypotheses on these parameters we obtain the observed information matrix since the expected information matrix is very complicated and will require numerical integration. The 2×2 observed information matrix J(θ) is
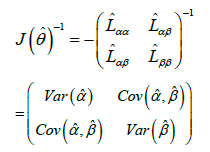
Under conditions that are fulfilled for parameters in the interior of the parameter space but not on the boundary, the asymptotic distribution of

where, ()Iθ is the information matrix. This asymptotic behavior is valid if ()Iθ is replaced by ()ˆ,Jθ the observed information matrix evaluated at ˆ.θ The asymptotic multivariate normal ()()2ˆ0,NJθ distribution can be used to construct approximate confidence intervals and confidence regions for the individual parameters and for the hazard rate and survival functions. The above approach is used to derive the (1-α)% confidence intervals for the parameters α and β as in the following forms

Here, Zα/2 is the upper 100(α/2) percentile of the standard normal distribution.
Application
In this section we fit new distribution to one real data set and show that the new distribution can be a better model than the Modified Weibull(MW), Exponentiated Weibull(EW), extended generalized Lindley(EGL), exponential(E), generalized Lindley(GL), power Lindley(PL), Lindley(L), generalized gamma(GG),inverse Lindley(IL) , Weibull(M), gamma(G), Exponential Flexible Weibull Extension(EFWE) and entezar(ENT) distributions. The data set consists of the number of successive failures for the air conditioning system of each member in a fleet of 13 Boeing 720 jet airplanes (1963). The data set is:
194, 413, 90, 74, 55, 23, 97, 50, 359, 50, 130, 487, 57, 102, 15, 14, 10, 57, 320,
261, 51, 44, 9, 254, 493, 33, 18, 209, 41, 58, 60, 48, 56, 87, 11, 102, 12, 5, 14,
14, 29, 37, 186, 29, 104, 7, 4, 72, 270, 283, 7, 61, 100, 61, 502, 220, 120, 141, 22,
603, 35, 98, 54, 100, 11, 181, 65, 49, 12, 239, 14, 18, 39, 3, 12, 5, 32, 9, 438, 43,
134, 184, 20, 386, 182, 71, 80, 188, 230, 152, 5, 36, 79, 59, 33, 246, 1, 79, 3, 27,
201, 84, 27, 156, 21, 16, 88, 130, 14, 118, 44, 15, 42, 106, 46, 230, 26, 59, 153,
104, 20, 206, 5, 66, 34, 29, 26, 35, 5, 82, 31, 118, 326, 12, 54, 36, 34, 18, 25, 120,
31, 22, 18, 216, 139, 67, 310, 3, 46, 210, 57, 76, 14, 111, 97, 62, 39, 30, 7, 44, 11,
63, 23, 22, 23, 14, 18, 13, 34, 16, 18, 130, 90, 163, 208, 1, 24, 70, 16, 101, 52,
208, 95, 62, 11, 191, 14, 71.
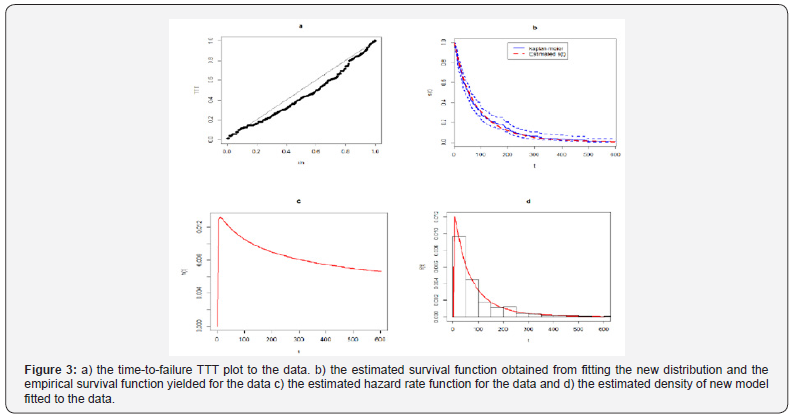
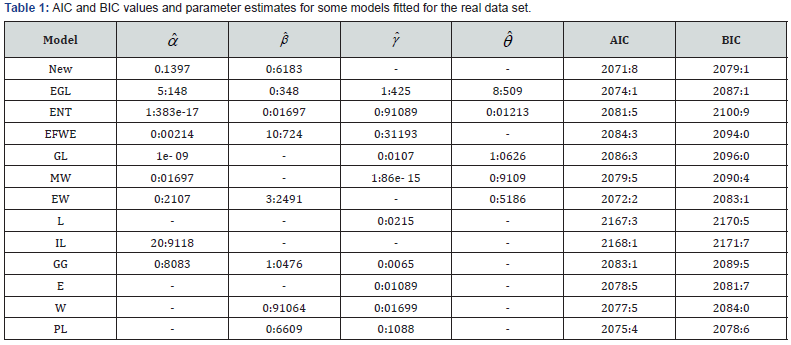
In many applications, a particular model can be selected through the qualitative information on the shape of a failure rate function. In this context, a device called the total time on test (TTT) plot data set is useful. The TTT plot for the data set in Figure 3a shows a unimodal hazard rate function. Hence, the new distribution could be an appropriate model for the fitting of such data. Table 1 gives the MLE of the parameters and the values of the following statistics for some models: Akaike Information Criterion (AIC) and Bayesian Information Criterion (BIC). As we can see from these numerical results in Table 1, the AIC and BIC of the new model are the smallest among those of the other fitted models and hence our new model can be chosen as the best model. To assess if the model is appropriate, we plot in Figure 3b the empirical survival function and the estimated survival function of the new distribution which provides a good fit for the data under analysis. The estimated hazard rate function in Figure 3c is a unimodal curve. Further, the plots of the estimated density and the histogram of the data given in Figure 3d show that the new distribution gives a good fit for these data.
Conclusion
In this article, a new distribution with two parameters to Lifetime Data was introduced, which was much more flexible than the Exponentiated Weibull (EW), Modified Weibull (MW), extended generalized Lindley distribution(EGL), entezar distribution(ENT), exponential(E), generalized Lindley (GL), power Lindley(PL), Lindley(L), generalized gamma(GG),Weibull(M), inverse Lindley(IL), Exponential Flexible Weibull Extension (EFWE) and gamma(G) distributions. The distribution proposed in this paper had increasing, decreasing and unimodal hazard rate functions with decreasing and unimodal PDF distributions. A mathematical treatment of this distribution consisting of the moments and asymptotic properties of the MLEs of the obtained unknown parameters was provided. Ultimately, application of the new distribution to one real data set was performed to illustrate the better fit of this distribution compared to the other models.
References
- Torabi H, Falahati-Naeini M, Montazeri NH (2014) An Extended Generalized Lindley Distribution and Its Applications to Lifetime Data. J Statist Res Iran 11: 203-222.
- Zakerzadeh H, Dolati A (2009) Generalized Lindley Distribution. Journal of Mathematical Extension 3: 13-25.
- Felipe RS, Edwin MMO, Cordeiro M (2011) The generalized inverse Weibull distribution. Stat Papers 52(3): 591-619.
- Ghitany ME, Al-Mutairi DK, Balakrishnan N, Al-Enezi LJ (2013) Power Lindley Distribution and Associated Inference. Computational Statistics and Data Analysis 64: 20-33.
- Lindley D V (1958) Fiducial Distributions and Bayes Theorem. Journal of the Royal Society, Series B 20: 102-107.
- Stacy EW (1962) A generalization of the gamma distribution. Annals of Mathematical Statistics 33: 1187-1192.
- Shanker R, Mishra A (2013) A Quasi Lindley Distribution. African Journal of Mathematics and Computer Science Research 6: 64-71.
- Ghitany ME, Al-Mutairi DK, Al-Awadhi FA, Al-Burais MM (2012) Marshall-Olkin Extended Lindley Distribution and Its Application. International Journal of Applied Mathematics 25: 709-721.
- Doostmoradi A, Zadkarami M, Akhond M (2016) A New Entezar Distribution for Lifetime modeling, Iran J Sci Technol Trans Sci 42(1): 129-139.
- Ghitany ME, Alqallaf F, Al-Mutairi DK, Husain HA (2011) A Two parameter Weighted Lindley Distribution and Its Applications to Survival Data. Mathematics and Computers in Simulation 81(6): 1190-1201.
- Carrasco J, Ortega E, Cordeiro G (2008) A generalized modied weibull distribution for lifetime modeling. Comput Stat Data Anal 53(2): 450-462.
- Lai C, Xie M, Murthy D (2003) A modified weibull distribution. IEEE Trans Reliab 52: 33-37.
- Mudholkar G, Srivastava D, Friemer M (1995) The exponentiated Weibull family: a reanalysis of the bus-motor-failure data. Technometrics 37: 436-445.
- Mudholkar G, Srivastava D, Kollia G (1996) A generalization of the Weibull distribution with application to the analysis of survival data. J Am Stat Assoc 91:1575-1583.
- Sharma VK, Singha SK, Singha U, Agiwal V (2015) The inverse Lindley distribution: a stress-strength reliability model with application to head and neck cancer data, Journal of Industrial and Production Engineering 32(3): 162-173.
- Silva G, Ortega E, Cordeiro G (2010) The beta modified Weibull distribution. Lifetime Data Anal 16(3): 409-430.
- Warahena-Liyanage G, Pararai M (2014) A Generalized Power Lindley Distribution with Applications. Asian Journal of Mathematics and Applications 1: 1-23.
- Beih SED, Abdelfattah M, Shamsan AG (2017) The Exponential Flexible Weibull Extension Distribution. Journal of Modelling and Simulation 5: 83-97.
- Lee C, Famoye F, Olumolade O (2007) Beta-weibull distribution: some properties and applications to censored data. J Mod Appl Stat Methods 6: 173-186.
- Weibull W (1951) A statistical distribution of wide applicability. J Appl Mech 18: 29-37.


