Confidence Intervals for the Relative Risk
Alharbi N1 and Tsagris M2
King Saud bin Abdulaziz University for Health Sciences, Saudi Arabia 2Department of Computer Science, University of Crete, Greece
Submission: October 24, 2017; Published: February 01, 2018
*Corresponding author: Michail Tsagris, Department of Computer Science, University of Crete, Herakleion, Greece; Email: mtsagris@yahoo.gr
How to cite this article: Alharbi N, Tsagris M. Confidence Intervals for the Relative Risk. Biostat Biometrics Open Acc J. 2018; 4(5): 555647. DOI:10.19080/BBOAJ.2018.04.555647
Abstract
Confidence interval for the ratio of two independent binomial proportions is an important measure, especially in medicine. The relative risk is such an example where accurate interval estimation is crucial. In this work we compare 4 different methods for the construction of such intervals. Simulation studies using many combinations of the sample sizes and of the true proportions reveal interesting conclusions as to the suitability of either method.
Keywords: Binomial proportions; Relative risk; Inverse hyperbolic sine; Bailey's method
Introduction
Relative risk is a measure often met in medical statistics and medical literature in general. Being a point estimate, interval estimation must accompany its report. The most famous confidence intervals, also mentioned in the standard, and not only, statistics related books are asymptotic. That is, they are valid for large sample sizes. Relative risk is basically the ratio of two the estimated proportions of two independent binomially distributed variables. Throughout the years many researchers have proposed confidence intervals for this ratio, conducting simulation studies where they compare different methods [15]. The goal of this paper is to compare some of the proposed methods for constructing confidence interval for the relative risk. Based upon simulation studies we suggest a method to be used which is valid even in the relatively small sample sizes case. In fact, our studies show that the suggested method requires half of the sample size required by the standard practice asymptotic method. In addition, its formula is very similar to the asymptotic method and in addition it requires no extra adjustment for the extreme cases of 0 and or 1. The paper is organized as follows. In the next Section, we present the four methods that will be subjected to comparison, next evaluation studies follow and finally the Conclusion closes the paper.
Relative risk and confidence intervals
Assume the following 2 x 2 contingency table which summarizes the relationship between a binary factor (independent variable, X) and a binary dependent variable (Y).

Where, x1 and x2 are the frequencies of a factor and nl and n2 denote the two sample sizes, from which x and x2 were calculated. The relative risk is defined as

From a different perspective (1) can be seen as the ratio of the proportions of two binomially distributed random variables X1B(n1,p1) and X2B(n2,p2)....Four different methods for the construction of confidence intervals for the ratio of two independent binomial proportions (relative risk) are presented below.
Ln-Method (Katz et al. [2])
Consider in(t), a random variable, which is approximately normally distributed with an estimated mean and variance (1/x1)-(1/n1)+(1/n2) respectively. Then, an approximate twosided 1 -a confidence interval for θ can be given by

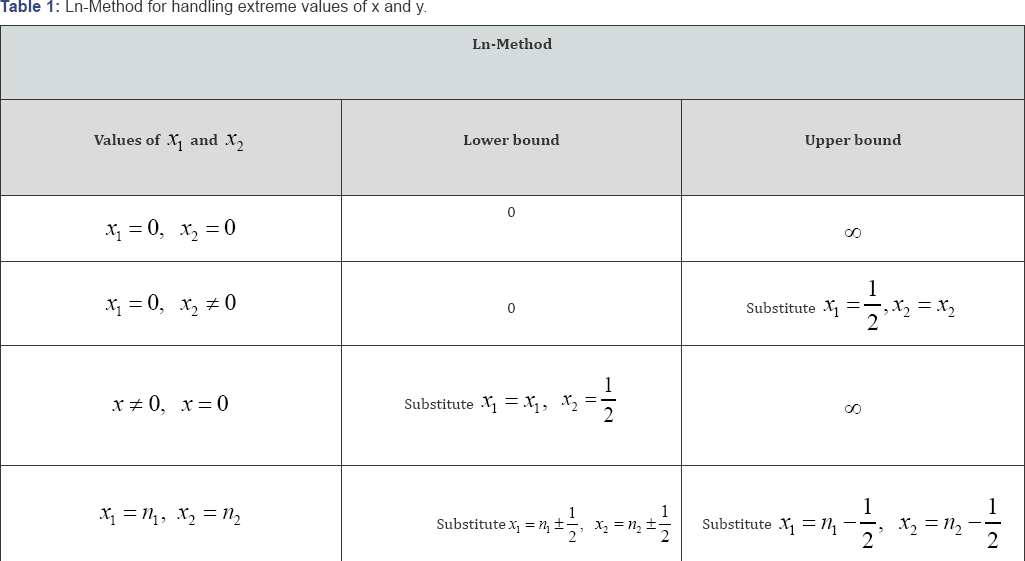
Where, Z1-α/2 is the 1-1/2α quantile of the standard normal distribution. We will describe schematically how we can deal with extreme values x1=0,x1=n,x2=0 or x2=n in Table 1, which is generalization of that of Katz et al .[2]
Log-limits
An approximate 1001α− percent confidence interval for θ based on the natural log transformation is:

Where, p1 = x1/n1 for i = 1,2 and P (z > z1-α/2 ) = 1-α/ 2.
The slightly biased estimator of logθˆ was suggested in (Walter, 1975) as follows:

According to Pettigrew et al., the estimated variance of the above estimator is:

Using the above equations, an approximate 100(1 -a) percent confidence interval for 0 can be written as follows:

Consider this method as log05. It should be noted that these limits always exist, however they result the degenerate interval (1,1) for x = n and x2 = n2.
Bailey's method
It was proposed in that a confidence interval for θ based on the normal approximation is:

 was chosen as this partially helps the skewness of (5) to be eliminated. If Z denotes the 1001α− percentile of the standard normal distribution, Bailey’s ()1001α− two-sided interval is:

Note that for extreme values of P1 P2, adjustments were made; see (Bailey, 1987)
Inverse hyperbolic sine
An approximate 100 (1 -«) percent confidence interval for 0 based on the inverse hyperbolic sine is:

The interval width of the LOG method (4) is larger than the interval width of the sinh-1 method (9). Furthermore, the Inverse hyperbolic sine method2manage the situation when Xj or x2 is zero by substituting w2 for the zero observed very often. Therefore, if the value of xl or x2 s zero, the lower limit of the interval is (x1n2)(n1z21-α/2) and the upper limit of the interval (z21-α/2n2)(n1x2) [5].
Evaluation studies
In this Section, evaluation studies are implemented in order to assess the performance of the proposed methods in terms of coverage of the confidence interval. The estimated coverage can be calculated exactly, as the values in the binomial distribution lie between 0 and the number of trials. For all methods, different sample sizes and true probabilities were tested. The common ground was the confidence level, which was set to 0.05. We kept both sample sizes equal to (20, 50, 70, 100, 200, 500) and let the values of the true probability of each distribution varying between 0.5 and 0.95 increasing by 0.05 each ffime. Note, that all combinations of the two true proportions were tested.
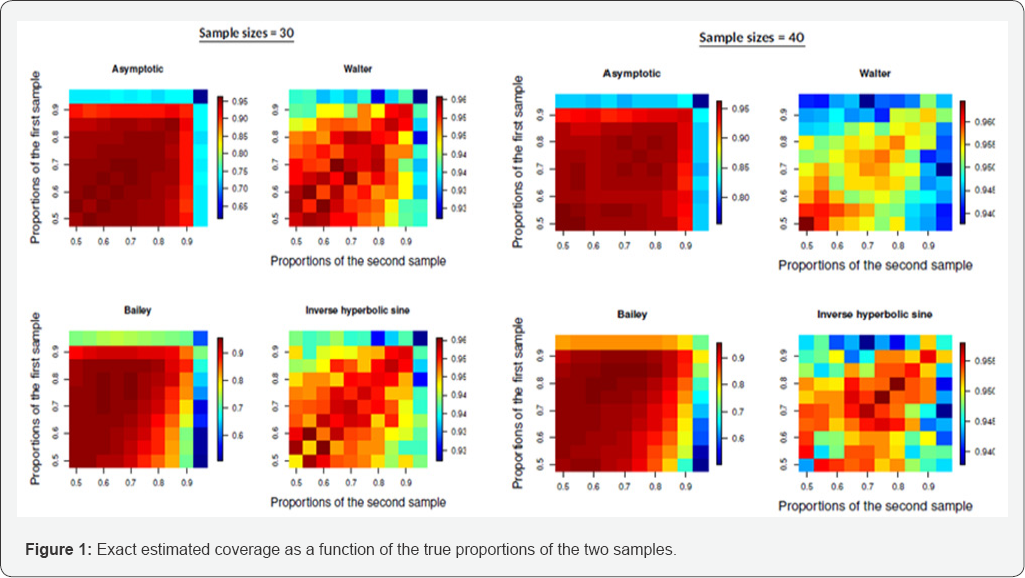
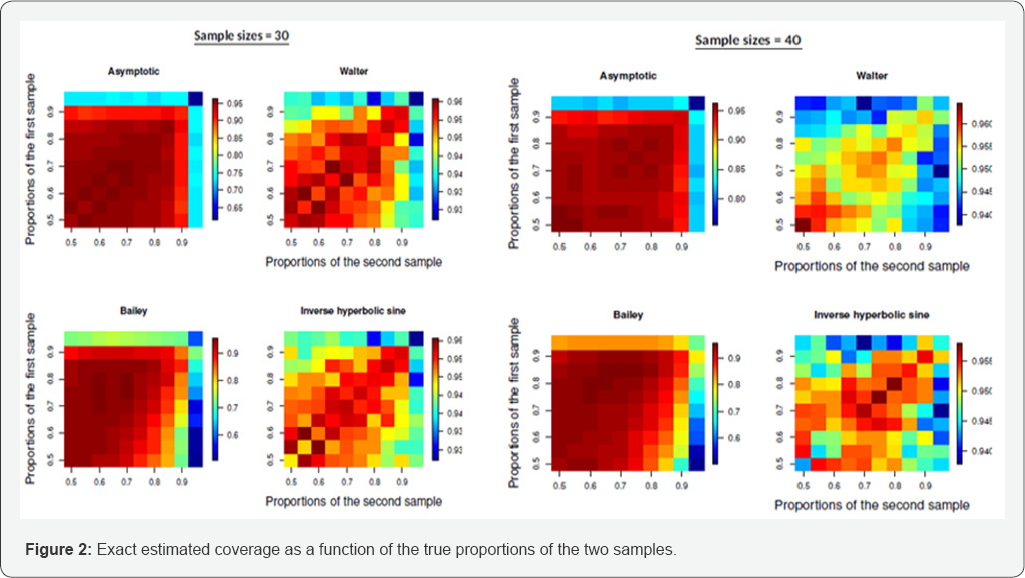
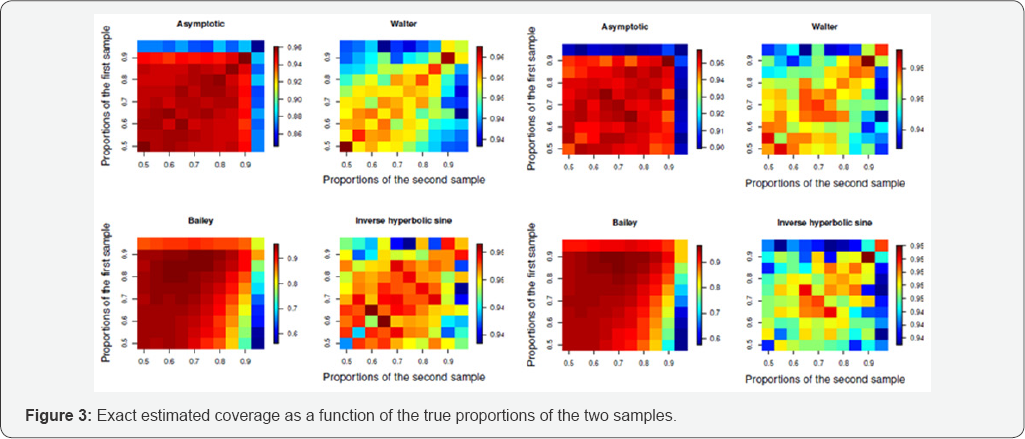
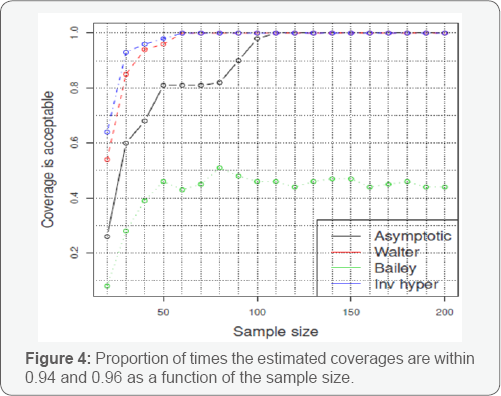
Figures 1-3 present the estimated coverage for a range of sample sizes. Each heat plot refers to a method and a given sample size. For each heat plot the coverages for all combinations of the two true probabilities are calculated. To give an example, the first heat plot, up on the le%o corner in 1, refers to the asymptotic method with only 10 observations from each sample. There are 10 different proportions for each sample and hence 100 combinations. Each box in this heat plot shows the estimated coverage of the asymptotic method for a combination of the two true proportions. As we move down the Figures, we can see that more combinations of the true proportions lead to estimated coverages that lie within 0.94 and 0.96. This is because the sample size increases. In order to see how the percentage of the estimated coverages that lie within these two numbers change as the sample size increases, we performed some extra calculations presented in Figure 4. For each sample size and each method (each heat plot) we counted the proportion of Qitimes the estimated coverages lie within 0.94 and 0.96. Bailey’s method seems not to work very well in practice. The asymptotic method requires at least 100 observations in each sample to have the desired accuracy, whereas Walter’s method and the inverse hyperbolic sine work satisfactorily even with 50 observations in each sample size and reach 100% with 60 observations in each sample size.
Conclusion
We have compared 4 methods for constructing confidence intervals for the ratio of two independent binomial
distributions. This is the so called relative risk (for two independent populations) in the medical literature. Based on our experimental evaluation, the asymptotic method, which is the standard one in the textbooks, seems to work accurately with at least 100 observations available from each population. Bailey’s method is not suggested, regardless of large or small sizes [4]. On the other hand, Walter’s suggestion and the inverse hyperbolic sine based confidence interval the low sample size cases were the most accurate ones. Both of them are easy to apply, as there is a closed form solution. Among them two, we suggest the use of the corrected logit transformation (Walter’s suggestion) as it requires not special treatment for the extreme cases of 0 or n and m.


