




 ASM Home




Abstract
Indonesia's continued reduction in official poverty has coincided with increasingly visible differences among poverty estimates produced by national and international institutions. These differences are often treated as competing claims about the "true" number of poor people, although the underlying indicators measure different welfare concepts and serve different analytical purposes. Using a qualitative literature review supplemented by critical examination of recent official statistics, this study synthesizes evidence on national poverty, international purchasing-power-parity poverty thresholds, multidimensional deprivation, vulnerability, child poverty, employment quality, food security, health, education, housing, water and sanitation, and spatial inequality. The review shows that Indonesia's declining national poverty headcount coexists with substantial economic insecurity, multidimensional child deprivation, regional disparities, low-productivity and informal employment, unequal public-service quality, and exposure to shocks. The article therefore proposes a Protection-Prevention-Promotion policy architecture that links poverty profiles to differentiated interventions. Protection secures minimum consumption and essential services, prevention reduces the risk of downward mobility, and promotion creates sustained pathways towards productive employment, human-capital accumulation and upward mobility. Poverty eradication in an upper-middle-income Indonesia consequently requires moving beyond a single poverty threshold towards an integrated framework connecting measurement, diagnosis, intervention, delivery and outcomes.
Keywords: Poverty Measurement; Poverty Line; Multidimensional Poverty; Vulnerability; Social Protection; Economic Security; Human Capital; Informal Employment; Policy Intervention; Indonesia
JEL Classification: I32; I38; O15; D63; H53
Introduction
Indonesia's Poverty Transition and the Apparent Measurement Puzzle
Indonesia has achieved substantial progress in reducing poverty over the past several decades, but the meaning of that progress has become increasingly contested as different institutions report markedly different poverty percentages. According to Statistics Indonesia (Badan Pusat Statistik, BPS), 8.07% of Indonesia's population, equivalent to approximately 22.93 million people, lived below the national poverty line in March 2026, a decline of 0.40 percentage points from March 2025. Poverty nevertheless remained considerably higher in rural areas, at 10.67%, than in urban areas, where it stood at 6.34%. The national poverty line reached IDR 669,235 per capita per month, with food requirements accounting for almost three-quarters of the threshold [1].
At first sight, these numbers appear difficult to reconcile with poverty estimates published by the World Bank. Under the revised 2021 purchasing-power-parity (PPP) international poverty lines, the World Bank estimated that in 2024, 5.4% of Indonesians lived below US$3.00 per person per day, 19.9% below the US$4.20 benchmark associated with lower-middle-income economies, and 68.3% below the US$8.30 benchmark associated with upper-middle-income economies. The World Bank explicitly cautions that these lines serve different analytical purposes from Indonesia's national poverty line and that the national line remains the most appropriate benchmark for country-specific poverty monitoring and policy discussion [2].
This distinction is essential because public discussion can easily transform methodological differences into an apparent statistical dispute. A public-facing infographic that juxtaposed BPS, World Bank, UNICEF and UNDP indicators provided the initial empirical stimulus for this review, but its values were treated as propositions to be checked rather than as final statistical evidence. Verification against primary institutional sources showed, for example, that the 8.57% figure attributed in the graphic to the World Bank's US$3.00 line corresponds to Indonesia's national poverty rate in September 2024, whereas the World Bank's verified 2024 estimate at US$3.00 is 5.4%; the corresponding estimates at US$4.20 and US$8.30 are 19.9% and 68.3% [2].
These differences are not statistical curiosities. They reveal a fundamental issue in poverty research: poverty is not an empirically self-evident category that exists independently of the concepts used to identify it. All poverty measures require decisions about the welfare variable, relevant minimum standard, unit of analysis, price adjustment, temporal reference, geographic differentiation and—in multidimensional approaches—the dimensions, indicators, weights and identification cut-offs that determine who is classified as poor [3-6].
The World Bank's international lines make the issue especially transparent. The revised 2021 PPP thresholds were constructed for international comparison rather than as replacements for national poverty lines, and PPP conversion is fundamentally different from translating US dollars into rupiah at market exchange rates because it adjusts for differences in purchasing power and living costs. Higher measured poverty at a more demanding middle-income benchmark therefore does not mean that Indonesian households suddenly became poorer; it means that their observed consumption is being evaluated against a different reference standard [2].
Consequently, asking whether the BPS or World Bank poverty rate is the "correct" poverty rate is the wrong analytical question. The appropriate question is what each measure is designed to reveal and what the ensemble of measures tells policymakers about the depth, structure, and distribution of deprivation in Indonesia.
Why Poverty Cannot Be Reduced to Threshold Choice
Thresholds remain indispensable because governments need transparent criteria for monitoring welfare and allocating resources. Yet a poverty line converts an underlying welfare continuum into a binary classification. A household marginally above a poverty threshold may have living conditions almost indistinguishable from a household marginally below it. Poverty status may also change rapidly following job loss, illness, food-price increases, disasters, or changes in household composition. Research on Indonesian poverty dynamics confirms substantial movement between poverty and vulnerability and demonstrates the policy importance of households located just above conventional poverty thresholds [7].
Multidimensional indicators expose a second limitation. A household may have expenditure above a monetary poverty threshold yet remain deprived in safe water, sanitation, education, health services, adequate housing or access to information. Conversely, some households classified as income-poor may benefit from relatively effective public provision in particular dimensions. Poverty defined solely through expenditure therefore cannot be presumed to identify the entire population suffering meaningful deprivations in capabilities and living conditions [8,9].
Evidence on Indonesian children illustrates the problem particularly well. Joint research by SMERU Research Institute, Bappenas, BPS and UNICEF finds that 11.8% of children live below the national monetary poverty line, whereas 37.4%, or approximately 29.8 million children, experience deprivation in at least two basic dimensions of well-being. The multidimensional deprivation rate reaches 46.1% among rural children compared with 30.8% in urban areas, covering domains such as education, health, nutrition, protection, adequate housing, water and sanitation, and access to information [10,11].
The contrast does not imply that one indicator is correct and the other false. It demonstrates that they answer different questions. Monetary poverty asks whether household economic resources fall below a specified minimum. A child-deprivation indicator asks whether children actually attain minimum conditions in domains considered essential for their development. Their divergence is therefore substantively informative.
A similar caution applies to the global Multidimensional Poverty Index (MPI). The 2025 Indonesia country note reports a multidimensional poverty headcount of 3.6% and identifies a further 4.7% of the population as vulnerable to multidimensional poverty, but the underlying Indonesian survey observations date from 2017. The indicator is therefore useful for understanding the composition and intensity of multidimensional deprivation, but it should not be juxtaposed mechanically with BPS 2026 or World Bank 2024 statistics without acknowledging the different reference years and measurement structures [12].
The Urgency of a Broader Poverty Perspective
The measurement question has become more important as Indonesia has entered upper-middle-income-country status. Development policy at this stage must address not only whether households can secure a minimum consumption basket but also whether they possess sufficient capabilities, resilience and earning opportunities to participate in a more productive economy.
The World Bank's 2026 country diagnostic illustrates this transition. It estimates that around 65% of Indonesians remained below the US$8.30 upper-middle-income-country benchmark in 2025; this should not be interpreted as meaning that 65% of Indonesians are officially poor, but rather that a large proportion of the population remains below a consumption standard used for comparison with upper-middle-income economies. The same diagnostic emphasises that labour income and employment have historically accounted for much of poverty reduction, while recent job creation has increasingly been concentrated in informal and relatively low-productivity activities [13].
This transforms the poverty policy agenda. A country can reduce extreme and nationally defined poverty while still facing a large economically insecure population. Households may no longer experience acute deprivation, but they may possess limited savings, inadequate insurance, unstable earnings and weak capacity to withstand adverse shocks. The challenge consequently shifts from poverty relief alone toward poverty prevention, resilience and sustained upward mobility.
The issue is closely connected to employment quality. Indonesia's current development challenge involves generating not merely more employment but more productive, better-remunerated and more secure employment, while reducing skill mismatches and barriers to firm productivity. Recent diagnostics therefore place job quality, productivity, competition and structural transformation at the centre of the country's pathway towards broad-based prosperity [13,14].
Objectives and Research Questions
This article therefore aims to move the Indonesian poverty debate from a poverty-line controversy toward a poverty-profile and intervention framework. It pursues four objectives: first, to clarify conceptual and methodological differences between national monetary poverty, international PPP poverty lines and multidimensional poverty measures; second, to synthesise recent evidence on the substantive dimensions of Indonesian poverty and vulnerability; third, to assess the implications of these poverty profiles for policy design; and fourth, to propose an integrated intervention architecture linking poverty diagnosis with protection, prevention and promotion.
The review is guided by five questions. First, why do BPS, the World Bank, UNDP, UNICEF and related approaches produce different poverty estimates, and what distinct welfare concepts and purposes do those indicators represent? Second, what monetary, multidimensional and vulnerability-related forms of disadvantage remain despite declining official poverty? Third, how do employment quality, food and nutrition, health, education, housing, WASH, spatial inequality and shocks interact with poverty? Fourth, what combination of social protection, human-capital investment, productive inclusion and quality employment is most appropriate for heterogeneous poverty profiles? Fifth, what institutional, fiscal, data and implementation constraints must be overcome for those interventions to work effectively?
The principal contribution of this study is conceptual and policy-oriented. It proposes that different poverty measures should be integrated into a measurement-identification-diagnosis-intervention-delivery-outcome framework rather than treated as rival estimates, thereby linking the interpretation of poverty metrics directly to differentiated policy responses.
Literature Review
Poverty as a Concept: From Resources to Capabilities
The conventional monetary conception of poverty evaluates whether household income or expenditure falls below the monetary cost of attaining a minimally acceptable standard of living. Such measures remain fundamental because economic resources strongly condition people's capacity to purchase food, housing, transportation, education, healthcare and other necessities, while also providing a transparent basis for monitoring trends and allocating public resources. However, the poverty-reducing effect of economic growth is distribution-dependent: greater inequality can weaken the extent to which rising average incomes translate into reductions in poverty [15].
Nevertheless, contemporary poverty research has increasingly recognized that income and consumption are instrumental rather than exhaustive measures of well-being. Poverty may instead be understood as a deprivation of capabilities: insufficient real opportunities to attain states of being and doing that society considers fundamental. Within this perspective, poor health, limited schooling, unsafe housing or lack of sanitation are not merely proxies for insufficient income; they can constitute poverty-relevant deprivations in their own right.
Recent Indonesian research supports this broader interpretation. Firdausy and Budisetyowati [8] identify education, health and quality-of-life conditions as important dimensions for developing a multidimensional poverty measure appropriate to Indonesia. Their work underscores that a country's poverty architecture should capture the structure of deprivation rather than focus exclusively on monetary shortfalls.
The resulting challenge is not to abandon monetary measurement but to integrate it with complementary indicators. Hohberg et al. [16] show the analytical value of modelling multiple welfare outcomes rather than assuming that a single dimension exhausts household deprivation. Alkire et al. [9] similarly demonstrate how moderate multidimensional poverty measures can extend diagnosis beyond acute poverty and better describe populations positioned between severe deprivation and more secure standards of living.
Poverty Lines and the Politics of the Threshold
A poverty threshold performs an identification function: individuals or households whose welfare falls below a specified cut-off are classified as poor. This produces administrative clarity but inevitably simplifies a continuous welfare distribution. Decerf [3], for example, demonstrates the conceptual value of considering both absolute and relative dimensions of poverty, highlighting why a fixed minimum may be insufficient where societal standards and opportunities evolve.
International poverty lines add another layer. They are constructed partly from the national poverty lines of groups of countries and converted through purchasing-power-parity procedures to enable cross-country comparison. Periodic changes to PPP benchmarks can alter reported global poverty without representing a contemporaneous change in the underlying living conditions of individual households. Jolliffe et al. [17] demonstrate that changes in PPP benchmarks can have important implications for global poverty measurement and consequently require careful interpretation.
The conceptual implication is crucial for Indonesia. The BPS line asks whether household expenditure is sufficient to satisfy a nationally specified basic-needs standard that accounts for Indonesian conditions. World Bank international lines ask where Indonesian consumption falls relative to common cross-country reference thresholds. These indicators overlap, but they are not interchangeable.
Moreover, measurement choices extend beyond the poverty-line value. Spatial-price adjustments, household-equivalence assumptions, survey design, and the treatment of consumption components can all affect measured poverty. World Bank international calculations and BPS national estimates both draw on SUSENAS but use different adjustment procedures: BPS sets poverty lines separately across provincial urban and rural areas, while the World Bank additionally applies PPP conversion and adjustments required for international comparability [2].
Consequently, measurement plurality is not necessarily a methodological defect. It becomes problematic primarily when different indicators are presented without explaining their intended functions.
Multidimensional Poverty: Dimensions, Weights and Identification
Once poverty is recognized as multidimensional, a new set of methodological decisions emerges. Analysts must select dimensions and indicators, determine deprivation thresholds for each indicator, choose weights, and establish how multiple deprivations should be aggregated to identify the multidimensionally poor.
Jones [4] questions the exclusive reliance on conventional additive weighting and develops approaches that identify meaningful bundles of deprivation. Tkach and Gigliarano [5] demonstrate that relationships and dependencies among dimensions can matter for multidimensional poverty assessment, while Nájera and Gordon [6] examine empirical approaches to identifying multidimensional poverty cut-offs. These contributions demonstrate that multidimensional measurement does not eliminate normative decisions; it relocates them into the construction of dimensions and identification rules.
The policy advantage is nevertheless considerable. The global MPI, for example, combines health, education and living-standard indicators and incorporates both incidence and deprivation intensity. For Indonesia, the 2025 UNDP-OPHI country note reports a 3.6% multidimensional poverty headcount, 4.7% vulnerability to multidimensional poverty and an average deprivation intensity of 38.7% among the multidimensionally poor. Because the underlying observations refer to 2017, however, these figures are more informative about the structure of multidimensional deprivation than about the country's current national headcount [12].
The methodological literature therefore supports a complementary approach. A national monetary poverty line is highly useful for monitoring basic-needs poverty; international poverty lines locate the country relative to external standards; and multidimensional measures diagnose overlapping deficits that monetary measures may not capture.
Poverty Dynamics and Vulnerability
A cross-sectional poverty rate indicates the proportion of people below a threshold at a particular time, but it does not distinguish persistent poverty from temporary poverty or identify non-poor households likely to become poor. This distinction is central to effective policy.
Tantriana [7] uses synthetic-panel techniques to investigate Indonesian poverty and vulnerability transitions around the COVID-19 period and demonstrates substantial movement between welfare states. Such evidence makes a strong case for incorporating vulnerability alongside current poverty status.
The COVID-19 shock offers a broader illustration. Suryahadi, Al Izzati and Suryadarma [18] anticipated substantial increases in poverty from pandemic-related income disruption, while subsequent work by Suryahadi, Al Izzati and Yumna [19] showed that expanded social-protection programmes helped moderate the poverty impact. Putra, Ovsiannikov and Kotani [20] document extensive COVID-related income and employment losses in Indonesia. Together, these findings illustrate why a welfare system calibrated only to households classified as poor before a shock will predictably leave many newly vulnerable households inadequately protected.
Disasters introduce similar risks. Nose [21] shows that fragmented disaster-aid provision can have distributional and poverty consequences, reinforcing the importance of adaptive and institutionally coordinated social-protection systems.
Spatial Poverty and Unequal Opportunities
National averages conceal substantial geographic heterogeneity. Miranti [22] identifies uneven patterns of poverty convergence across Indonesian districts, suggesting that spatially persistent poverty cannot be addressed effectively through uniform national interventions alone. Rural economic structures, infrastructure, public-service accessibility, local fiscal capacity and geographic isolation all contribute to different pathways into and out of poverty.
Recent BPS statistics reinforce the contemporary relevance of these differences. Rural poverty remained 10.67% in March 2026 compared with 6.34% in urban areas, indicating that national progress continues to coexist with substantial spatial disparities [1].
Fiscal institutions matter as well. Tirtosuharto [23] finds that fiscal efficiency and institutional conditions affect the poverty-reducing effectiveness of public expenditure across Indonesian regions. Rammohan and Tohari [24], analysing Indonesia's Village Fund programme, demonstrate links between decentralised development resources, rural labour-force participation and poverty-related outcomes. Arham [25] similarly highlights the role of agricultural performance in rural poverty reduction.
Resource endowments alone do not guarantee inclusive outcomes. Brintanti et al. [26] find nonlinear relationships between natural resources and poverty, whereas Hornok and Raeskyesa [27] show that spatially concentrated economic development can interact with local inequality. Nizar et al. [28] further emphasise the importance of knowledge and socio-institutional conditions for poverty and inequality.
The resulting implication is that poverty should be understood not simply as a household deficiency but as an interaction between household capabilities and the opportunity structures available in particular places. This perspective makes spatially differentiated service access and local institutional capacity integral components of poverty diagnosis rather than peripheral implementation concerns.
Employment Quality and Productive Inclusion
Labour income has historically played a central role in Indonesia's poverty reduction. Yet employment status itself is an incomplete indicator of economic security. Jobs differ enormously in productivity, remuneration, regularity, social-insurance coverage and exposure to shocks.
Recent World Bank diagnostics warn that much employment growth has been concentrated in lower-productivity activities and that formal, better-paid jobs have expanded too slowly to support Indonesia's high-income ambitions. Labour formality and worker productivity have weakened since the pandemic period, making job quality a central part of the poverty and shared-prosperity agenda [13].
The minimum-wage literature similarly illustrates the connection between labour institutions and poverty. Merdikawati and Al Izzati [29] analyse Indonesia's minimum-wage policy and poverty, underlining that wage regulation can have distributional implications whose effects depend on labour-market structures. Majid and Behrman [30] show that wage institutions can even influence child health through household-resource channels.
This literature suggests that a sustainable anti-poverty strategy cannot rely exclusively on redistribution. Transfers can protect living standards and human capital, but persistent movement towards economic security requires productive employment, skills, functioning labour institutions and enterprises capable of generating higher-value-added work. Evidence from Indonesia also indicates that unemployment and informal self-employment can leave lasting earnings scars, particularly where informal work provides limited opportunities for human-capital accumulation and progression [31].
Human Capital, Health and Intergenerational Poverty
Poverty persists partly because disadvantages accumulate across the life course. Children's health, nutrition and education affect later learning, productivity, employment and earnings, while aspirations and the capacity to invest in human capital can reinforce or interrupt intergenerational transmission [32,33]. Indonesian evidence also shows that gains in schooling participation can coexist with weak learning trajectories, so human-capital policy must focus on learning quality as well as enrolment and spending levels [34-36].
Healthcare provides an important example of why access alone is insufficient. Haemmerli et al. [37] identify inequalities in service readiness and provider knowledge in Indonesian primary healthcare, while quality-adjusted benefit-incidence analysis shows that apparently pro-poor public primary-care subsidies become less equitable once variation in service quality is incorporated [38]. Aizawa [39] and Sambodo et al. [40] further demonstrate persistent inequalities in health opportunities and geographic health benefits. Insurance expansion also does not guarantee effective protection: socioeconomic and educational differences continue to shape membership and use among poorer groups, while underutilisation can persist even among insured populations [41,42].
Nutrition is equally central. Mulyaningsih et al. [43] identify multilevel determinants of childhood stunting, demonstrating that child malnutrition cannot be reduced to household income alone. Bella et al. [44] reveal relationships between parental smoking behaviour and children's nutritional status, while Laksono et al. [45] emphasise the need for appropriately targeted interventions in poor urban communities. Picauly et al. [46] provide further evidence that the determinants of stunting are embedded in household, environmental and service conditions.
The child-deprivation evidence intensifies this argument. Nearly four in ten Indonesian children experience at least two basic deprivations, with particularly pronounced rural disparities, so improvements in current household consumption cannot be assumed to eliminate disadvantages in nutrition, health, learning or living conditions [11]. Poverty policy that focuses only on present expenditure may therefore reduce immediate hardship without fully disrupting intergenerational transmission.
Food Security and Nutrition
Food constitutes a major component of Indonesia's official poverty line; in March 2026 it accounted for 74.70% of the national threshold [1]. Yet food security involves more than total calorie affordability because dietary diversity, nutritional quality, seasonal access, market connectivity and livelihood resilience all affect whether households can obtain adequate and stable diets.
Syafiq, Fikawati and Gemily [47] document household food-security challenges in urban and semi-urban Indonesia during the pandemic. Gibson et al. [48] reveal coping and adaptation strategies among specialised fishing households, while Roberts et al. [49] show the importance of fish-consumption pathways for food security. Duffy et al. [50] demonstrate how agroforestry contributes to smallholder food security, and Dwiartama, Kelly and Dixon [51] highlight the complex relationship between food security, food sovereignty and changing urban foodways. Ardianti, Hartono and Widyastaman [52] additionally find that digital connectivity can influence food insecurity among agricultural households.
Food insecurity should consequently be considered a distinct diagnostic domain even when household expenditure remains above a monetary poverty line. Doing so helps distinguish a general resource shortfall from food-system, livelihood or access constraints that require different forms of intervention.
Housing, Water, Sanitation and the Built Environment
Living-standard deprivation is also shaped by infrastructure and housing. Daniel et al. [53] examine financial, institutional, environmental, technical and social dimensions affecting sustainable WASH provision in rural and indigenous Indonesian communities. Daniel, Djohan and Nastiti [54] further emphasise the interactions among factors determining WASH sustainability.
Housing quality has equally important implications. Susanto, Nuraeny and Widyarta [55] question how minimum housing-space standards should be understood in Indonesia's social and cultural context. Winarso (2022) shows that slum upgrading should not be conceptualised as physical infrastructure improvement alone; socio-economic conditions and community capabilities matter as well.
These findings reinforce the broader argument that poverty eradication is partly an issue of public and collective provision, not simply the transfer of purchasing power to individual households. Household resources matter, but their conversion into well-being is conditioned by the availability, affordability and quality of infrastructure and services.
Social Protection and What Existing Evidence Shows
Indonesia possesses strong evidence that well-designed social assistance can improve welfare. Cahyadi et al. [56], using long-term experimental evidence on the Family Hope Programme (Program Keluarga Harapan, PKH), find cumulative effects of conditional cash transfers on important health and education outcomes. Cash transfers can therefore operate both as immediate consumption protection and as investment in future human capital.
Delivery design is also consequential. Banerjee et al. [57] evaluate Indonesia's large-scale electronic food-voucher reform and demonstrate that changing how benefits are delivered can affect targeting and household welfare. Rammohan and Tohari [58] similarly find effects of food-voucher reform on dietary diversity.
Recent research by Shah et al. [59] further illustrates heterogeneity in the effects of PKH on maternal healthcare utilisation. This is important because average programme effects can conceal differences among populations with different constraints. Effective social protection therefore requires not only deciding who receives assistance but also understanding which barriers prevent particular beneficiaries from converting transfers into improved outcomes.
Social insurance is equally important for the near-poor and informal workforce. Siregar et al. [60], examining the financing of paid maternity leave for women in informal employment, illustrate the institutional challenges associated with extending lifecycle protection beyond formal-sector workers. Evidence on national health insurance similarly shows that enrolment and effective utilisation can remain uneven among disadvantaged groups, reinforcing the need to treat coverage, accessibility and actual use as distinct policy outcomes [41,42].
Taken together, this literature supports a broad conception of social protection in which cash transfers are essential but insufficient on their own. Effective systems also require service linkages, social insurance, shock-responsive mechanisms and pathways into productive livelihoods, while targeting approaches should be capable of recognising both resource poverty and wider capability deprivation [61].
Method
Review Design
This study employs a qualitative literature review with an interpretive and critical orientation. It is deliberately not designed as a systematic literature review (SLR) and therefore does not claim exhaustive database coverage, PRISMA-based screening, formal meta-analysis or statistical representativeness of the literature universe. The design is instead intended to integrate conceptually heterogeneous evidence in order to develop an analytically coherent account of poverty measurement, substantive deprivation and policy response.
This distinction is methodological rather than semantic. The study's objective is to synthesise heterogeneous forms of evidence—conceptual work on poverty measurement, empirical research on different dimensions of deprivation, programme evaluations, spatial studies, poverty-transition analyses and contemporary official statistics—into a coherent policy interpretation. Such evidence differs sufficiently in theoretical purpose, unit of analysis, data construction and methodological design that forcing it into a single standardised effect-size framework would provide little advantage.
The approach follows the view that literature reviews can constitute independent analytical studies when the logic of selection, interpretation and synthesis is made transparent [62]. It is also consistent with methodological guidance emphasising critical interpretation and conceptual integration in qualitative reviews [63,64].
Literature Identification
Peer-reviewed literature published primarily from 2020 to 2026 was purposively identified across six intersecting domains. These comprised poverty concepts, thresholds and multidimensional measurement; poverty dynamics and vulnerability; spatial and regional inequality; human capital and basic-service deprivation; social protection and productive inclusion; and governance, targeting and implementation. Organising the literature in this way allowed conceptual, empirical and policy evidence to be interpreted together without implying that the review was exhaustive.
Search concepts included combinations of poverty measurement, poverty line, multidimensional poverty, vulnerability to poverty, Indonesia, child poverty, food insecurity, nutrition, health inequality, education, WASH, housing, informal employment, minimum wage, social protection, conditional cash transfer, Village Fund, regional inequality, targeting and adaptive social protection. Searches were iterative: concepts identified in influential studies were used to refine subsequent searches, while backward and forward citation tracing was used selectively to locate closely related recent evidence.
Selection was iterative rather than mechanically exhaustive. Greater weight was given to peer-reviewed articles with direct relevance to Indonesia, rigorous empirical identification, influential theoretical or methodological contributions, and studies addressing mechanisms rather than simple statistical associations. Comparative and international literature was incorporated where needed to clarify measurement concepts, and no claim is made that the resulting corpus constitutes a statistically representative sample of all relevant publications.
Verification and Use of Primary Statistical Sources
Peer-reviewed articles were cross-checked against journal or DOI records before inclusion in the reference list. Recent official statistics were independently verified using original institutional sources from BPS, the World Bank, UNICEF and UNDP.
The initial public-facing infographic was treated as an analytical stimulus rather than a definitive statistical source. Its central message, namely that different institutions report markedly different poverty indicators, is relevant to the article's argument, but numerical values were not reproduced automatically. Where discrepancies were identified, primary institutional records took precedence and the reason for the discrepancy was incorporated into the interpretation.
This procedure revealed an analytically important finding in itself: public-facing poverty comparisons can unintentionally combine statistics referring to different definitions and periods. The World Bank's verified 2024 rates at the 2021-PPP thresholds are 5.4%, 19.9% and 68.3%, while BPS's 8.57% figure referred to national poverty in September 2024; the apparent discrepancy therefore reflects a mixing of indicators rather than a substantive contradiction [2].
Thematic Synthesis
The literature was interpreted at two levels of thematic organisation. First-order themes covered measurement, thresholds, multidimensional deprivation, vulnerability, spatial inequality, employment, human capital, intervention and implementation, while these categories were subsequently reorganised into five second-order propositions: measurement plurality, hidden vulnerability, multidimensional disadvantage, differentiated intervention and delivery capacity. The final interpretive synthesis follows a sequence from measurement to identification, diagnosis, intervention, delivery and outcomes. This structure moves the analysis beyond asking how many people are classified as poor towards examining what type of deprivation they experience, what generates or reproduces it and which intervention is appropriate.
Limitations
Several limitations should be acknowledged. First, because this is a qualitative rather than systematic review, it does not claim exhaustive retrieval of every study published since 2020. Second, comparisons among poverty indicators are constrained by different data years and methodological designs. Third, some multidimensional indicators are substantially less timely than national monetary poverty statistics; the UNDP global MPI for Indonesia, for example, continues to rely on survey observations from 2017 [12].
These limitations reinforce rather than weaken the paper's core proposition that different indicators should be interpreted with methodological discipline rather than combined as though they represented an identical construct. They also mean that the figures in this review should be read as a structured comparison of measurement purposes, not as estimates drawn from a single harmonised data set.
Results: Thematic Findings
Theme One: Different Poverty Numbers Measure Different Welfare Questions
The first and most fundamental finding is that apparently contradictory poverty percentages are largely products of measurement plurality. Once the underlying welfare concept, reference year, population and threshold are made explicit, much of the apparent contradiction disappears.
Figure 1 should be read as a map of measurement purposes rather than as a league table of competing poverty estimates. The BPS headcount identifies nationally defined basic-needs poverty, the World Bank lines provide international PPP benchmarks, while the UNICEF and UNDP measures change either the population of interest or the welfare space being assessed; direct comparison therefore requires attention to reference year, population, threshold and dimensional structure [2,10-12]. Read together, the indicators support the paper's core argument that measurement plurality is analytically useful when each measure is linked to the policy question it was designed to answer.
The wide range shown in Figure 1 should therefore not be interpreted as statistical uncertainty about a single "true" poverty rate. BPS's national poverty rate measures nationally defined basic-needs poverty, World Bank PPP lines provide progressively higher international welfare benchmarks, UNICEF's child measures change the reference population and, for multidimensional deprivation, the welfare concept, while UNDP's MPI measures overlapping deprivation rather than expenditure and relies on older survey data. The substantive message is not that Indonesian poverty lies somewhere between 3.6% and 68.3%, but that different measures answer different questions [1,2,10-12].
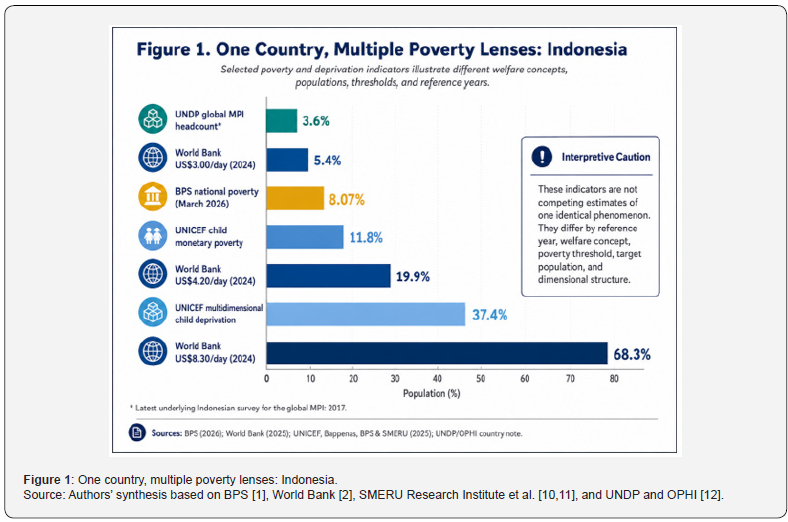
This distinction matters for policy. If the objective is to monitor Indonesia's national basic-needs poverty target, BPS is the appropriate anchor. If the objective is international comparison, World Bank lines are informative. If policymakers are identifying children lacking essential services, multidimensional child-deprivation measures provide additional information that national consumption poverty cannot supply.
Measurement plurality is therefore valuable when the purpose of each measure is explicit. The policy risk arises not from having multiple indicators, but from treating them as interchangeable or assigning them a policy function for which they were not designed.
Theme Two: Crossing a Poverty Line Does Not Necessarily Produce Economic Security
The second finding is that households immediately above a poverty line cannot automatically be treated as economically secure. Poverty status is a location on a distribution, whereas administrative classification creates a sharp boundary.
Tantriana [7] demonstrates movement among poverty and vulnerability states in Indonesia, supporting a dynamic rather than static interpretation of welfare. Pandemic evidence strengthens the finding: sudden employment and income losses pushed previously non-poor households toward hardship, while expanded social assistance mitigated—but could not entirely prevent—the impact [18-20].
The World Bank's upper-middle-income benchmark adds an important structural dimension. Around 65% of Indonesians remained below US$8.30 per person per day in 2025, according to the 2026 country diagnostic, but this is not equivalent to national poverty. Instead, it indicates that large sections of the population have consumption levels substantially below standards used to benchmark more established upper-middle-income economies [13].
Accordingly, poverty policy should distinguish at least three broad states: current poverty, vulnerability to downward mobility, and insufficient economic security for sustained upward mobility. These states overlap, but they imply different combinations of income support, risk protection and opportunity-enhancing intervention.
Theme Three: Monetary Improvement Can Coexist with Multidimensional Deprivation
The third theme is the incomplete overlap between monetary and non-monetary disadvantage. This incomplete overlap is precisely why a monetary poverty line should be complemented by measures of capabilities, living conditions, livelihood security and exposure to shocks.
Figure 2 translates the literature into a multidimensional poverty profile in which economic resources interact with capabilities, living conditions, livelihood security and exposure to shocks. The framework captures why higher expenditure may fail to secure health, learning, adequate housing or effective insurance when service quality, geography and labour-market institutions constrain the conversion of resources into well-being [8,42,61]. It therefore provides the conceptual bridge between monetary poverty measurement and the intervention logic developed later in the paper.
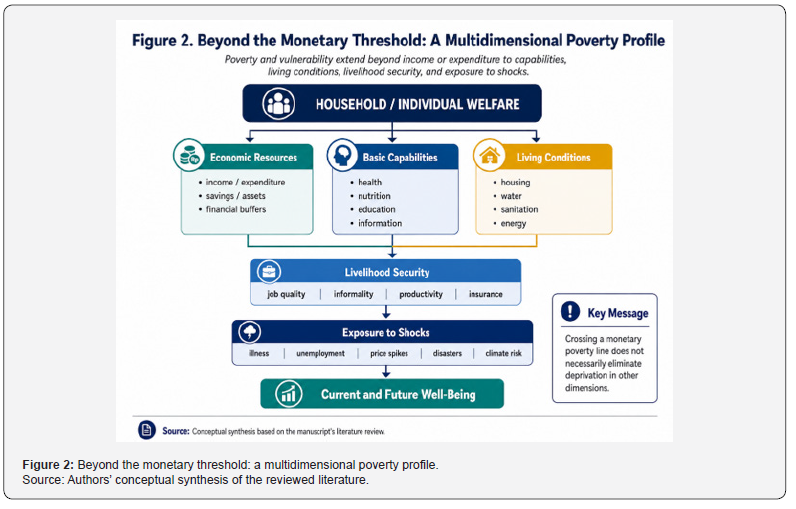
Figure 2 illustrates why monetary poverty remains indispensable but insufficient. Economic resources affect most other dimensions, but the conversion of resources into well-being depends on service quality, infrastructure, geography, household composition and individual circumstances. A cash transfer cannot by itself create a functioning health facility, safe water network or productive local labour market; conversely, high-quality universal services can improve capabilities even among households with limited private resources. Poverty should therefore be analysed through both household purchasing capacity and the institutional environment in which resources are converted into welfare [61,65].
The child-poverty evidence provides the strongest contemporary illustration. The difference between 11.8% monetary child poverty and 37.4% multidimensional child deprivation means that many children living in households above the monetary poverty line nevertheless experience significant deficits in essential rights and services. Health-related deprivation is widespread and substantial shares of children also experience inadequate sanitation, water or cooking-fuel conditions, reinforcing the need to distinguish resource poverty from realised living conditions [10,11].
Evidence from health, nutrition and WASH research is consistent with this result. Haemmerli et al. [37], Aizawa [39], Sambodo et al. [40], Mulyaningsih et al. [43], Daniel et al. [53] and Winarso [66] collectively demonstrate that unequal capabilities and living conditions emerge through systems that cannot be represented by household consumption alone.
Theme Four: Poverty in Indonesia Is Spatially Differentiated
The fourth finding is that national poverty is geographically heterogeneous. This heterogeneity matters because the same nominal intervention can produce different welfare effects when prices, infrastructure, livelihoods and public-service capacity vary across locations.
Contemporary BPS statistics show a persistent rural–urban poverty differential. But rural versus urban is only the first spatial distinction. Districts differ in economic structure, infrastructure, fiscal capacity, public-service availability, connectivity and exposure to environmental risks. Research on regional convergence suggests that Indonesian districts do not necessarily move toward lower poverty at the same rate [22].
Place-specific livelihoods further complicate the picture. Agricultural households may experience productivity and market-access constraints [25], fishing communities may face environmental and livelihood vulnerability [48,49], and urban poor households may experience housing insecurity, sanitation deficits and high living costs even when proximity to labour markets improves income opportunities [66].
This implies that equal transfer amounts can produce unequal welfare gains across locations because prices, services and complementary infrastructure differ. Poverty policy must therefore be spatially sensitive without becoming administratively fragmented.
Theme Five: Job Quantity Is Not Equivalent to an Exit from Poverty
The fifth result is the central role of job quality. Employment remains the most scalable mechanism for sustainable poverty exits, but the existence of work does not guarantee adequate welfare.
Indonesia's recent diagnostics show that employment growth is disproportionately concentrated in relatively low-value activities while higher-productivity formal employment remains insufficient. The World Bank estimates that earnings from work accounted for more than 70% of poverty reduction over the previous decade, but warns that productivity and formality have weakened since the pandemic [13].
This creates a dual problem. Poor households need access to work, but vulnerable workers also need opportunities to move into more productive activities. Policies focusing only on unemployment may overlook underemployment, low wages, irregular earnings, weak bargaining power, and lack of social insurance.
The poverty strategy must consequently intersect with competition policy, industrial transformation, agricultural productivity, SME upgrading, skills, childcare, labour-market institutions, access to finance and trade policy. Indonesia requires productivity-led growth capable of generating better-quality jobs if broad prosperity is to increase, and the long-run scarring associated with unemployment and informal self-employment makes the quality and continuity of labour-market attachment particularly important [14,31].
Theme Six: Social Protection Is Effective but Must Be Connected to Services and Mobility
Existing evidence indicates that Indonesian social-protection programmes can produce substantial welfare improvements. Cahyadi et al. [56] show that sustained PKH participation generated cumulative impacts in health- and education-related outcomes. Banerjee et al. [57] demonstrate that reforming food-assistance delivery through electronic vouchers improved programme performance at scale. Rammohan and Tohari [58] provide additional evidence concerning dietary diversity.
These findings have two implications. First, transfer programmes should not be dismissed as short-term relief; when well designed, they can help build human capital. Second, the effectiveness of transfers depends strongly on delivery architecture and complementary services.
A household receiving a conditional education transfer cannot realise its full benefit if schools are inaccessible or of low quality. A maternal-health incentive may generate limited improvement where local health facilities lack capacity. A food voucher can increase purchasing power, but local supply and dietary availability still matter.
The policy problem is therefore not a choice between cash and services. Effective poverty policy typically requires cash plus services plus opportunity, with the relative weight of each element determined by the household's underlying constraints.
Theme Seven: Implementation Capacity Is a Poverty Variable
A final thematic finding is that institutional implementation should itself be treated as part of poverty analysis. Programme effectiveness depends not only on policy design but also on whether administrative systems can identify changing needs, coordinate delivery and maintain service quality across heterogeneous local contexts.
Targeting errors, outdated registries, fragmented administrative responsibilities, inconsistent local capacity and weak coordination can reduce the effectiveness of otherwise sound policy designs. Dynamic poverty also means that eligibility lists become obsolete unless they are updated frequently. Historical evidence from Indonesia's RASKIN programme documents substantial inclusion and exclusion errors, illustrating how targeting accuracy can materially weaken the translation of programme budgets into poverty reduction [67].
Fiscal effectiveness varies across Indonesian regions [23], while decentralised interventions such as Village Funds operate through diverse local institutions [58]. Administrative capacity therefore mediates whether national policy reaches intended beneficiaries and whether money is converted into services and outcomes. Recent methodological work also shows that combining proxy-means information with local knowledge and dynamic updating can improve the targeting architecture in settings that include Indonesia [65].
This finding shifts attention from what policy should exist towards whether institutions can deliver the right combination of policy to the right population at the right time. Implementation capacity is therefore not merely an administrative afterthought; it is one of the mechanisms through which poverty policy succeeds or fails.
Discussion and Analysis
Reframing the Debate: From “Which Poverty Rate Is Correct?” to “What Does Each Measure Tell Us?”
The combined evidence supports a straightforward but consequential conclusion: Indonesia should not select one poverty indicator and discard the others. The more useful approach is to assign each indicator a clearly defined monitoring, benchmarking, or diagnostic function and interpret them together.
A poverty measure is useful to the extent that it is appropriate to its analytical purpose. BPS's national poverty line is the most relevant benchmark for Indonesian national poverty monitoring, while international poverty lines are appropriate for cross-country comparison and evaluation against evolving global standards. Multidimensional indicators reveal the composition of deprivation, and vulnerability indicators identify households whose current welfare is above the poverty line but insufficiently resilient to [2].
The apparent contradiction in the reviewed evidence can therefore be transformed into a useful analytical lesson. Policymakers should ask what is being measured, for whom, at what threshold, in which year and for what policy purpose before comparing headcounts. These questions discipline interpretation and reduce the risk that a high international benchmark is misreported as an official national poverty rate or that a low national headcount is taken to imply that wider deprivation has disappeared.
This framing avoids two opposite errors. The first is poverty inflation, in which a high international benchmark is presented as though everyone below it is officially poor and requires the same poverty-targeted transfer; the second is poverty minimisation, in which a relatively low official headcount is interpreted as evidence that deprivation is no longer a major development challenge. Both interpretations are analytically incomplete because they conflate distinct welfare questions and policy purposes.
How the US$8.30 Benchmark Should Be Interpreted
The upper-middle-income line deserves particular attention because its high poverty incidence can be easily misinterpreted in public debate. Its value lies primarily in comparative benchmarking and in signalling the distance between current consumption levels and the standards associated with a more mature upper-middle-income economy.
Its appropriate interpretation is aspirational and comparative rather than administrative. The benchmark reflects the levels at which upper-middle-income countries tend to define minimally acceptable living standards, and Indonesia remains relatively close to the lower end of that income group. It is therefore unsurprising that a large proportion of Indonesians remain below a threshold derived from the broader UMIC distribution, and the World Bank explicitly cautions against substituting that benchmark for the national poverty line [2].
Yet the 65–68% result should not be dismissed as irrelevant. It tells policymakers something economically important: a large share of households remains distant from the level of consumption security typically associated with mature upper-middle-income economies.
This has implications for Indonesia's 2045 ambitions. Poverty policy increasingly overlaps with middle-class expansion, productive transformation and economic security. Success must therefore be evaluated not merely through the number of people crossing the national poverty line from below, but also through the ability of households to move sufficiently far above it to become resilient.
Conceptually, this is the difference between poverty exit and secure poverty exit. The first concerns crossing a minimum threshold, whereas the second concerns moving far enough above that threshold to withstand shocks and sustain upward mobility.
A Poverty-Profile Approach
Rather than grouping households into a single poor/non-poor binary, Indonesian policy would benefit from a profile that distinguishes several analytically useful positions. These include households experiencing extreme deprivation; households below the national poverty line; near-poor and shock-vulnerable households; monetarily non-poor households with specific multidimensional deprivations; economically insecure workers and families requiring pathways into more productive livelihoods; and households that have accumulated sufficient resilience to sustain upward mobility. These categories should not become rigid bureaucratic labels, because their purpose is to identify different constraints and match them with different policy instruments.
A household with sufficient consumption but no safe sanitation does not primarily need an income-classification debate; it needs infrastructure. A household falling into hardship following unemployment requires temporary income protection and re-employment support. A chronically poor household with children experiencing malnutrition, poor schooling and inadequate housing requires a coordinated package of transfers and services. A low-productivity microenterprise may require finance, market access, technology and business capability rather than indefinite household assistance.
The Protection–Prevention–Promotion Architecture
This article proposes organising these heterogeneous needs around three complementary policy functions: protection, prevention and promotion. The purpose of the architecture is to match the intensity and type of deprivation with an appropriate policy mix rather than to impose a single programme on all households below a chosen threshold.
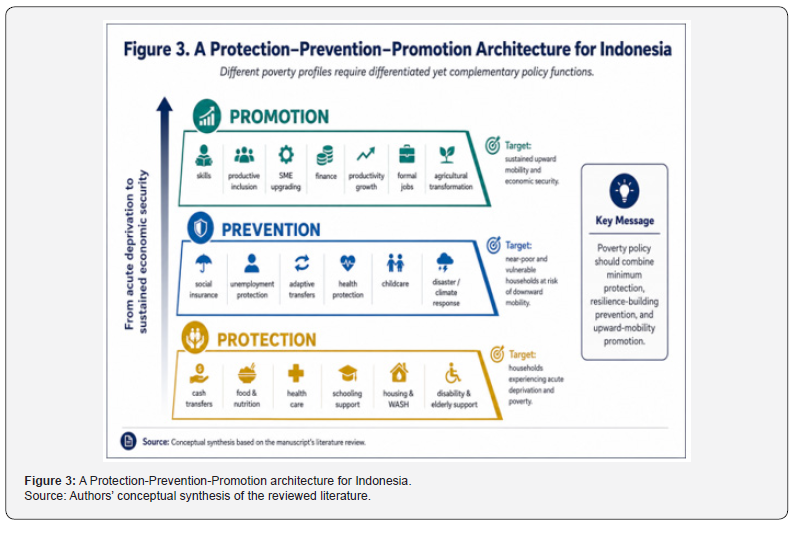
Figure 3 converts the poverty-profile perspective into three complementary policy functions: protection against current deprivation, prevention of downward mobility and promotion of sustained upward mobility. Evidence from Indonesia shows that transfers can improve human-capital outcomes, but targeting, benefit design and labour-market responses also shape programme effectiveness, so households may need simultaneous support across more than one tier [56,57,68]. The architecture should therefore be interpreted as a flexible policy portfolio rather than a rigid graduation sequence.
Figure 3 illustrates that protection, prevention and promotion should be understood as complementary functions rather than sequential programmes from which households permanently "graduate". A household may simultaneously require protection in one dimension and promotion in another; a low-income worker, for example, may require child-nutrition support while also receiving vocational training and health insurance. What matters is that the policy instrument corresponds to the underlying constraint and that transitions between forms of support do not create avoidable coverage gaps.
Protection
Protection addresses current deprivation and seeks to guarantee minimum consumption and essential capabilities. It is therefore most intensive where households face immediate resource shortfalls or severe deficits in basic services.
Cash transfers, food and nutrition interventions, school participation support, healthcare access, disability benefits, elderly assistance, adequate housing and WASH are central. Evidence from PKH demonstrates that well-designed protection can have effects beyond immediate consumption by supporting longer-term human capital [56].
Benefit adequacy matters. A transfer that reaches the correct household but is too small to close a meaningful welfare gap cannot be considered fully effective. Targeting performance therefore needs to be evaluated jointly with adequacy.
Prevention
Prevention recognises that vulnerability extends beyond the officially poor. It is designed to reduce the probability that shocks, lifecycle risks or temporary labour-market disruptions push households into persistent poverty.
The near-poor require mechanisms that prevent temporary shocks from generating long-term poverty. Relevant instruments include health insurance, unemployment protection, adaptive social protection, disaster-responsive transfers, temporary income replacement, childcare, maternity protection and mechanisms for rapidly enrolling households experiencing income loss.
COVID-19 demonstrated why this layer matters. Large numbers of households can experience sudden income shocks without having been classified as poor beforehand (Putra, Ovsiannikov and Kotani, 2023). A responsive welfare state therefore needs the capacity to identify changing circumstances, not merely maintain a static beneficiary list.
Promotion
Promotion addresses the structural drivers of upward mobility. It focuses on the capabilities, assets and economic opportunities needed for households to achieve sustained gains rather than temporary relief.
Training, foundational education, productive inclusion, SME upgrading, agricultural productivity, digital access, access to finance, childcare enabling women's labour-force participation, employment services and policies supporting formal, productive firms all belong to this layer. This component becomes increasingly important as Indonesia transitions from reducing extreme poverty towards achieving upper-middle-income economic security. The contemporary jobs challenge means that poverty reduction cannot be sustained exclusively through fiscal redistribution; better primary distribution through higher productivity and earnings is also required [13,14].
A Life-Cycle Perspective
An integrated strategy should also distinguish needs across the life course. The timing of deprivation matters because the same income shock can produce very different long-run consequences for a young child, a working-age adult or an older person.
For children, the priority is preventing irreversible losses in nutrition, health, cognitive development and learning. The finding that 37.4% of Indonesian children experience at least two basic deprivations makes the child-development agenda central to poverty eradication rather than peripheral to it [11].
For working-age adults, employment quality, skills, childcare, health protection and social insurance become critical. For older people and persons with disabilities, income protection must be accompanied by accessible healthcare and care services.
This perspective improves upon a purely household-level approach because the consequences of deprivation differ by age. A temporary nutrition deficit in early childhood can have effects that cannot easily be reversed by higher income in adulthood. Conversely, a temporary job loss among adults may be effectively mitigated through timely unemployment assistance and re-employment support.
Place-Based Intervention without Fragmenting National Standards
The evidence also supports place-based adaptation. National standards can remain common while the composition and delivery of interventions respond to differences in geography, economic structure, infrastructure and institutional capacity.
In rural areas, agricultural productivity, market connectivity, infrastructure, WASH and access to health and schooling may dominate. In metropolitan areas, poverty can be associated with expensive housing, insecure tenure, congestion, transportation costs, informal employment and limited childcare. Remote regions may face high service-delivery costs and severe shortages of qualified teachers or healthcare professionals.
A place-based approach does not imply lowering national standards for disadvantaged regions. Rather, the desired outcome should remain nationally equitable while the delivery mechanism adapts to local constraints.
Fiscal transfers could therefore be linked more strongly to objective deprivation, geographic cost and measurable service outcomes. Local capacity-building should accompany funding because resources alone do not guarantee effective implementation, a point reinforced by evidence on fiscal efficiency and education transfers across Indonesian regions [23,35,36].
From Static Targeting to Dynamic Social Registries
The distinction between poverty and vulnerability has direct implications for data systems. If household welfare changes more quickly than administrative classifications, static registries will inevitably miss some newly vulnerable households while retaining some whose circumstances have improved.
Traditional targeting tends to classify households according to welfare characteristics observed at a particular time, yet employment, household composition, health and disaster exposure change. Static registries therefore generate exclusion errors when households newly fall into distress, while purely income- or expenditure-based targeting may overlook capability constraints that alter the severity of deprivation [65].
An integrated social registry should therefore support more frequent updating, interoperability among relevant administrative systems, transparent grievance and correction mechanisms, and rapid reassessment following major shocks. A hybrid approach combining verifiable socioeconomic indicators with local information and an explicit dynamic-updating procedure provides one promising way to improve targeting under changing conditions [65].
The objective should not be to construct a perfect once-and-for-all list of poor people, which is unrealistic in a dynamic economy, but to build an administrative system capable of detecting changing needs and responding accordingly. Such a system should treat registry quality as a continuous governance function rather than as a periodic data-cleaning exercise.
Connecting Monetary and Multidimensional Data
Indonesia's poverty dashboard could contain three complementary layers rather than collapsing all information into a single index. The first would measure current monetary deprivation, anchored by BPS's national poverty methodology; the second would assess vulnerability and economic security using distributions around the poverty line, employment stability, social-insurance coverage, shock exposure and higher international benchmarks; and the third would monitor multidimensional outcomes including nutrition, learning, health, housing, WASH and child deprivation. Keeping these layers visible preserves diagnostic information because improvement in one domain can coexist with deterioration in another. A district whose monetary poverty rate falls while learning deprivation worsens, for example, requires a different policy response from one in which income and capability indicators improve together.
Policy Delivery as Part of the Causal Framework
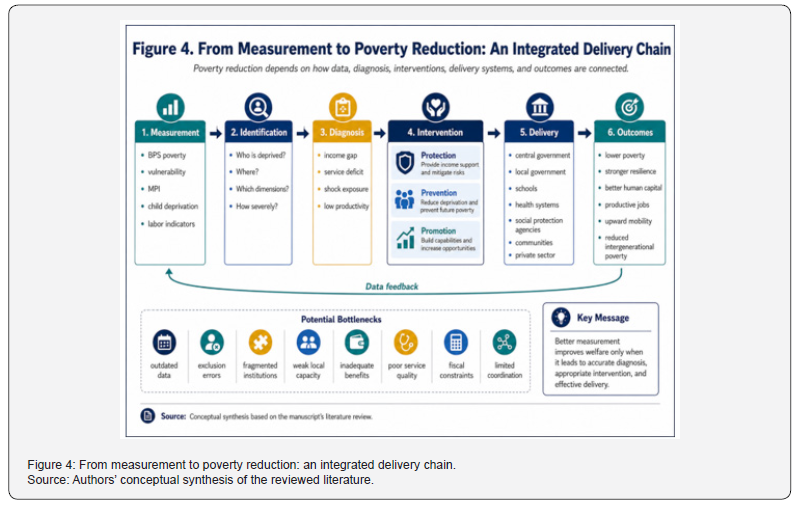
Figure 4 emphasises that poverty reduction is produced by a delivery chain rather than by measurement alone. Better indicators must lead to accurate identification, a diagnosis of the relevant constraint, an appropriate package of protection, prevention or promotion, and effective delivery through national and local institutions; targeting errors and weak local capacity can undermine the chain even when programme design is sound [23,65,67]. The feedback loop is equally important because changing household circumstances require registries, programme rules, and service delivery to be updated as new evidence emerges.
Figure 4 treats implementation as part of the poverty-reduction causal chain. Better measurement does not automatically improve welfare: data must first support accurate identification and diagnosis, diagnosis must inform an appropriate intervention, interventions must be delivered with adequate quality, and outcomes must feed back into subsequent decisions. Failure at any stage can break the chain, particularly where data are outdated, institutions are fragmented or local delivery capacity is weak.
This framework also clarifies why debates centred exclusively on the poverty threshold are too narrow. Even a perfectly measured poverty line cannot tell policymakers whether a particular household requires nutrition support, sanitation, healthcare, training or employment assistance. Classification must be followed by diagnosis.
The Role of Universal and Targeted Policies
A comprehensive strategy also requires a careful balance between targeting and universality. The appropriate balance differs by instrument because cash transfers, social insurance and basic public services face different fiscal, administrative and equity considerations.
Targeted cash assistance is appropriate where fiscal resources must be concentrated among households with the largest resource deficits, while basic health, education, water, sanitation and essential infrastructure often generate stronger equity when access approaches universality. Targeting on capabilities as well as resources can also identify disadvantaged households that conventional means tests may miss, although administratively feasible designs remain essential [65].
Excessive reliance on narrowly targeted programmes can create coverage gaps among near-poor households and impose substantial administrative burdens, whereas universal cash transfers may devote scarce resources to households that require little additional support. Targeting design can also affect behavioural incentives: Indonesian evidence finds modest reductions in employment and job formality under some tightly means-tested cash-transfer arrangements, suggesting that eligibility rules should avoid creating unnecessary disincentives at the margin [68,69].
The appropriate principle is therefore to target income support where economic resources are highly unequal while pursuing broad access to essential public services and social-insurance mechanisms wherever feasible. Policy design should also monitor effective utilisation, because formal coverage can coexist with barriers that prevent disadvantaged groups from using services in practice [42].
Poverty Reduction and Structural Transformation
The broader implication is that Indonesia's poverty agenda can no longer be separated from structural transformation. Social policy can protect households from deprivation, but sustained movement towards economic security depends on an economy capable of generating productive and progressively better-paid work.
The World Bank's 2026 diagnostic and Growth and Jobs Report argue that Indonesia requires major productivity and job-quality improvements to achieve its high-income aspirations. Reforms supporting competition, trade, investment, skills and productive enterprises are expected to be central to increasing labour income and expanding better-quality employment opportunities [13,14].
This is highly relevant to poverty. If most new workers continue to enter activities with low productivity and limited social protection, households may cross the official poverty line but remain economically insecure. Conversely, sustained growth in labour productivity and real wages can move households substantially beyond poverty thresholds and reduce long-term dependence on transfers.
Social policy and growth policy should consequently not be treated as substitutes. Productive transformation without adequate social protection exposes households to adjustment risks; social protection without productive transformation may protect consumption but struggle to generate sustained mobility.
The desirable strategy therefore combines productive transformation with effective social protection. Treating growth and social policy as mutually reinforcing is more consistent with a poverty-profile approach than asking either redistribution or markets to solve the problem in isolation.
Conclusion and Policy Recommendations
Indonesia's poverty debate should move beyond arguments about whether BPS, the World Bank or multidimensional indicators produce the "true" poverty rate. The central conclusion of this qualitative literature review is that different poverty measures identify different aspects of welfare and serve different analytical purposes. The appropriate response is therefore not measurement uniformity but measurement coherence.
BPS's national poverty rate remains the principal benchmark for assessing nationally defined basic-needs poverty. International World Bank thresholds provide comparative reference points showing where Indonesian living standards stand relative to global and income-group norms. Multidimensional indicators expose health, education, nutrition, housing, WASH and other deprivations that expenditure measures do not fully capture. Vulnerability measures identify households that are not currently poor but lack sufficient resilience against shocks.
The newest official data simultaneously demonstrate progress and unfinished work. National poverty declined to 8.07% in March 2026, representing 22.93 million Indonesians, but rural poverty remained substantially higher than urban poverty [1]. At the same time, 37.4% of children experience multiple basic deprivations, compared with 11.8% classified as monetarily poor [10,11]. International benchmarking further indicates that a large share of the population remains below consumption standards typical of upper-middle-income economies [2].
The policy implication is that reducing the national poverty headcount remains necessary but is no longer sufficient for Indonesia's development transition. Policy must also reduce vulnerability above the poverty line and address capability deficits that monetary measures do not fully reveal.
A comprehensive strategy should institutionalise a Protection–Prevention–Promotion architecture. Protection must guarantee basic consumption and essential services for households currently experiencing poverty. Prevention must extend risk protection to near-poor and vulnerable households through social insurance, adaptive transfers and rapid shock response. Promotion must create durable pathways into higher productivity through education, skills, productive inclusion, agricultural transformation, SME upgrading, finance and the generation of formal, better-paying jobs.
Within each layer, policy should be multidimensional. Child nutrition cannot be solved through income support alone; it requires healthcare, food quality, sanitation, parental behaviour and service availability. Poor educational outcomes require more than school enrolment; quality and learning matter. Urban poverty requires attention to housing and transportation, while rural poverty frequently requires improvements in agricultural productivity, market access and public infrastructure.
Policy should also become more dynamic. Social registries need to recognise welfare transitions rather than freeze households permanently into poor/non-poor categories, while administrative systems should be capable of detecting shocks rapidly and coordinating support across programmes and levels of government. Evidence on hybrid targeting and historical mistargeting in Indonesia supports greater attention to updating, local information and correction mechanisms [65,67].
Finally, poverty evaluation should measure what ultimately matters: not merely whether households cross a statistical threshold, but whether they remain safely above it, accumulate human capital, obtain productive employment, withstand shocks and provide their children with materially better opportunities. Indonesia's achievement in reducing poverty is real. The existence of a large economically vulnerable and multidimensionally deprived population is also real. These findings are not contradictory. They describe different stages on the same development continuum.
The substantive goal for an upper-middle-income Indonesia should therefore evolve from lifting people immediately above a poverty line towards enabling citizens to attain secure, resilient and sustained prosperity. Once poverty is understood in this way, the question of which threshold is "correct" becomes less important than the policy question that matters most: what combination of resources, services, protection and economic opportunities will allow different groups of Indonesians to escape deprivation permanently?
References
- BPS-Statistics Indonesia (2026) In March 2026, the percentage of the poor population decreased to 8.07 percent. Official Statistics News.
- World Bank (2025) The World Bank's Updated Global Poverty Lines: Indonesia. Washington, DC: World Bank.
- Decerf B (2021) Combining absolute and relative poverty: income poverty measurement with two poverty lines. Social Choice and Welfare 56: 325-362.
- Jones S (2022) Extending multidimensional poverty identification: from additive weights to minimal bundles. The Journal of Economic Inequality 20: 421-438.
- Tkach K and Gigliarano C (2022) Multidimensional Poverty Index with Dependence-Based Weights. Social Indicators Research 161: 843-872.
- Nájera H and Gordon D (2023) A Monte Carlo Study of Some Empirical Methods to Find the Optimal Poverty Line in Multidimensional Poverty Measurement. Social Indicators Research 167: 391-419.
- Tantriana A (2024) Poverty and vulnerability transitions in Indonesia before and during the COVID-19: insights from synthetic panels. Quality & Quantity 58: 3215-3249.
- Firdausy CM and Budisetyowati DA (2022) Variables, Dimensions, and Indicators Important to Develop the Multidimensional Poverty Line Measurement in Indonesia. Social Indicators Research 162: 763-802.
- Alkire S, Kövesdi F, Scheja E, Vollmer F (2023a) Moderate Multidimensional Poverty Index: Paving the Way Out of Poverty. Social Indicators Research 168: 409-445.
- SMERU Research Institute, Bappenas, BPS and UNICEF (2025a) Child Poverty in Indonesia. Jakarta: SMERU Research Institute, Ministry of National Development Planning/Bappenas, Statistics Indonesia and UNICEF.
- SMERU Research Institute, Bappenas, BPS and UNICEF (2025b) Multidimensional Child Rights Deprivation in Indonesia. Jakarta: SMERU Research Institute, Ministry of National Development Planning/Bappenas, Statistics Indonesia and UNICEF.
- UNDP and OPHI (2025) Multidimensional Poverty Index 2025: Indonesia Country Note. New York and Oxford: United Nations Development Programme and Oxford Poverty and Human Development Initiative.
- World Bank (2026a) Indonesia Streamlined Country Diagnostic. Washington, DC: World Bank.
- World Bank (2026b) Indonesia Growth and Jobs Report: Running Faster, for Longer: Structural Transformation, Productivity, and Good Jobs. Washington, DC: World Bank.
- Bergstrom K (2022) The Role of Income Inequality for Poverty Reduction. The World Bank Economic Review 36(3): 583-604.
- Hohberg M, Donat F, Marra G and Kneib T (2021) Beyond Unidimensional Poverty Analysis Using Distributional Copula Models for Mixed Ordered-Continuous Outcomes. Journal of the Royal Statistical Society: Series C (Applied Statistics) 70(5): 1365-1390.
- Jolliffe D, Mahler DG, Lakner C, Atamanov A and Tetteh-Baah SK (2025) Poverty and Prices: Assessing the Impact of the 2017 PPPs on the International Poverty Line and Global Poverty. The World Bank Economic Review 39(3): 497-521.
- Suryahadi A, Al Izzati R and Suryadarma D (2020) Estimating the Impact of COVID-19 on Poverty in Indonesia. Bulletin of Indonesian Economic Studies 56(2): 175-192.
- Suryahadi A, Al Izzati R and Yumna A (2021) The Impact of Covid-19 and Social Protection Programs on Poverty in Indonesia. Bulletin of Indonesian Economic Studies 57(3): 267-296.
- Putra RAA, Ovsiannikov K and Kotani K (2023) COVID-19-associated income loss and job loss: Evidence from Indonesia’, Journal of Asian Economics 87: 101631.
- Nose M (2022) Decentralized provision of disaster aid: aid fragmentation and the poverty implications. International Tax and Public Finance 29: 1098-1127.
- Miranti RC (2021) Is regional poverty converging across Indonesian districts? A distribution dynamics and spatial econometric approach. Asia-Pacific Journal of Regional Science 5: 851-883.
- Tirtosuharto D (2022) The impact of fiscal efficiency on poverty reduction in Indonesia: institutional factor and geographical differences. Journal of Geographical Systems 24: 67-93.
- Rammohan A and Tohari A (2023) Rural poverty and labour force participation: Evidence from Indonesia's Village fund program PLOS ONE 18(6): e0283041.
- Arham MA (2020) Does agricultural performance contribute to rural poverty reduction in Indonesia?. JEJAK: Journal of Economics and Policy 13(1): 69-83.
- Brintanti ARD, Jamil IR, Alhassan U, Kusmara YB, Rahmawati Y (2025) Inverted N-shape relationships: revisiting the dynamic effect of natural resources on poverty in Indonesia. Asia-Pacific Journal of Regional Science 9: 83-105.
- Hornok C and Raeskyesa DGS (2024) Economic zones and local income inequality: Evidence from Indonesia. The Journal of Economic Inequality 22: 69-100.
- Nizar NI, Nuryartono N, Juanda B, Fauzi A (2024) Can Knowledge and Culture Eradicate Poverty and Reduce Income Inequality? The Evidence from Indonesia’, Journal of the Knowledge Economy 15: 6425-6450.
- Merdikawati N and Al Izzati R (2025) Minimum Wage Policy and Poverty in Indonesia. The World Bank Economic Review 39(1): 191-210.
- Majid MF and Behrman JR (2023) Minimum Wages around Birth and Child Health’, The World Bank Economic Review 37(3): 351-365.
- Pritadrajati DS, Kusuma ACM and Saxena SC (2021) Scarred for life: Lasting consequences of unemployment and informal self-employment: An empirical evidence from Indonesia. Economic Analysis and Policy 70: 206-219.
- Lim SS and Lee J (2022) Aspirations, Human Capital Investment, and the Intergenerational Transmission of Poverty in Indonesia. Social Indicators Research 162: 377-412.
- Nazamuddin BS, Syathi PB, Riswandi R, Fitriyani F & Prayoga AE (2026) The Dynamic Nexus between Human Capital and Poverty in Indonesia: Evidence from a Panel PMG-ARDL Approach. Journal of the Knowledge Economy 17: 3794-3819.
- Bima L, Suryadarma D, Pradhan M, Beatty A and Berkhout E (2021) Schooling progress, learning reversal: Indonesia's learning profiles between 2000 and 2014. International Journal of Educational Development 85: 102436.
- Lewis BD (2023) Local education spending mandates: Indonesia's 20 percent rule. Education Economics 31(4): 419-438.
- Wirandana PA and Khoirunurrofik K (2024) Educational inequality in Indonesia: are intergovernmental fiscal transfers effective in reducing the gap?. Educational Studies 50(6): 1424-1443.
- Haemmerli M, Powell-Jackson T, Goodman C, Thabrany H, Wiseman V, et al. (2021) Poor quality for the poor? A study of inequalities in service readiness and provider knowledge in Indonesian primary health care facilities. International Journal for Equity in Health 20: 239.
- Haemmerli M, Asante A, Susilo D, Satrya A, Fattah RA, et al. (2022) Using measures of quality of care to assess equity in health care funding for primary care: analysis of Indonesian household data. BMC Health Services Research 22: 1349.
- Aizawa T (2022) Inequality in health opportunities in Indonesia: long-term influence of early-life circumstances on health. BMC Public Health 22: 1334.
- Sambodo NP, Van Doorslaer E, Pradhan M and Sparrow R (2021) Does geographic spending variation exacerbate healthcare benefit inequality? A benefit incidence analysis for Indonesia. Health Policy and Planning 36(7): 1129-1139.
- Putri NK, Laksono AD and Rohmah N (2023) Predictors of national health insurance membership among the poor with different education levels in Indonesia. BMC Public Health 23: 373.
- Sujarwoto S, Holipah H and Maharani A (2026) Hidden inequities in universal health coverage: determinants of health insurance underutilization in Indonesia. BMC Public Health 26: 1265.
- Mulyaningsih T, Mohanty I, Widyaningsih V, Gebremedhin TA, Miranti R, et al. (2021) Beyond personal factors: Multilevel determinants of childhood stunting in Indonesia. PLOS ONE 16(11): e0260265.
- Bella A, Dartanto T, Nurshadrina DS, Kusnadi G, Rahmanto F, et al. (2023) Do parental smoking behaviors affect children's thinness, stunting, and overweight status in Indonesia? Evidence from a large-scale longitudinal survey. Journal of Family and Economic Issues 44: 714-726.
- Laksono AD, Izza N, Trisnani T, Paramita A, Sholikhah HH, et al. (2024) Determination of appropriate policy targets to reduce the prevalence of stunting in children under five years of age in urban-poor communities in Indonesia: a secondary data analysis of the 2022 Indonesian national nutritional status survey. BMJ Open 14(9): e089531.
- Picauly I, Adi AAAM, Meiyetriani E, Mading M, Weraman P, et al. (2023) Path analysis model for preventing stunting in dryland area island East Nusa Tenggara Province, Indonesia. PLOS ONE 18(11): e0293797.
- Syafiq A, Fikawati S and Gemily SC (2022) Household food security during the COVID-19 pandemic in urban and semi-urban areas in Indonesia. Journal of Health, Population and Nutrition 41(4).
- Gibson E, Stacey N, Sunderland TCH, et al. (2021) Coping or adapting? Experiences of food and nutrition insecurity in specialised fishing households in Komodo District, eastern Indonesia. BMC Public Health 21: 355.
- Roberts N, Mengge B, Oaks B, Sari N, Irsan, et al. (2023) Fish consumption pathways and food security in an Indonesian fishing community. Food Security 15: 1-19.
- Duffy C, Toth GG, Hagan RPO, McKeown PC, Rahman SA, et al. (2021) Agroforestry contributions to smallholder farmer food security in Indonesia. Agroforestry Systems 95: 1109-1124.
- Dwiartama A, Kelly M and Dixon J (2023) Linking food security, food sovereignty and foodways in urban Southeast Asia: cases from Indonesia and Thailand. Food Security 15: 505-517.
- Ardianti DM, Hartono D and Widyastaman PA (2023) Offline and hungry: the effect of internet use on the food insecurity of Indonesian agricultural households. Agricultural and Food Economics 11: 25.
- Daniel D, Djohan D, Machairas I, Pande S, Arifin A, et al. (2021a) Financial, institutional, environmental, technical, and social (FIETS) aspects of water, sanitation, and hygiene conditions in indigenous-rural Indonesia. BMC Public Health 21: 1723.
- Daniel D, Djohan D and Nastiti A (2021b) Interaction of factors influencing the sustainability of water, sanitation, and hygiene (WASH) services in rural Indonesia: Evidence from small surveys of WASH-related stakeholders in Indonesia. Water 13(3): 314.
- Susanto D, Nuraeny E and Widyarta MN (2020) Rethinking the minimum space standard in Indonesia: tracing the social, culture and political view through public housing policies. Journal of Housing and the Built Environment 35: 983-1000.
- Cahyadi N, Hanna R, Olken BA, Prima RA, Satriawan E, et al. (2020) Cumulative Impacts of Conditional Cash Transfer Programs: Experimental Evidence from Indonesia. American Economic Journal: Economic Policy 12(4): 88-110.
- Banerjee A, Hanna R, Olken BA, Satriawan E and Sumarto S (2023) Electronic Food Vouchers: Evidence from an At-Scale Experiment in Indonesia. American Economic Review 113(2): 514-547.
- Rammohan A and Tohari A (2024) Food vouchers and dietary diversity: evidence from social protection reform in Indonesia. Food Security 16: 161-184.
- Shah V, Hatamyar J, Hidayat T and Kreif N (2026) Exploring the heterogeneous impacts of Indonesia's conditional cash transfer scheme (PKH) on maternal health care utilisation using instrumental causal forests. Empirical Economics 70.
- Siregar AYM, Pitriyan P, Hardiawan D, Zambrano P, Vilar-Compte M, et al. (2021) The yearly financing need of providing paid maternity leave in the informal sector in Indonesia. International Breastfeeding Journal 16: 17.
- Henderson H and Follett L (2022) Targeting social safety net programs on human capabilities. World Development 151: 105741.
- Kraus S, Breier M, Lim WM, Dabić M, Kumar S, et al. (2022) Literature reviews as independent studies: guidelines for academic practice. Review of Managerial Science 16: 2577-2595.
- Wilson SM and Anagnostopoulos D (2021) Methodological Guidance Paper: The Craft of Conducting a Qualitative Review. Review of Educational Research 91(5).
- Barry ES, Merkebu J and Varpio L (2022) State-of-the-art literature review methodology: A six-step approach for knowledge synthesis. Perspectives on Medical Education 11: 281-288.
- Follett L and Henderson H (2023) A hybrid approach to targeting social assistance. Journal of Development Economics 160: 103002.
- Winarso H (2022) Slum-upgrading through physical or socio-economic improvement? Lessons from Bandung, Indonesia. Journal of Housing and the Built Environment 37: 863-887.
- Sutanto W, Sakaguchi M, Amrullah ER, Rusyiana A, Ishida A, et al. (2020) Accurate targeting in the Indonesian RASKIN program’, International Journal of Social Economics 47(11): 1363-1379.
- Pritadrajati D (2023) Does social assistance disincentivise employment, job formality, and mobility?. Labour Economics 84: 102398.
- Alkire S, Nogales R, Quinn NN and Suppa N (2023b) On track or not? Projecting the global Multidimensional Poverty Index. Journal of Development Economics 165: 103150.