




 ASM Home



Abstract
This article is a “byproduct” of a Marketing Management course. In this course, students took the specific example of “Global Climate Change” to learn how to find relevant information, how to verify it and how to connect the pieces together. From the very brief, summarized results of the research, only general conclusions are drawn without any further marketing actions.
Keywords:Marketing Management; Information; Information Collection; Climatic Changes; Climatic Periods; Theories of Climate Change; Climatic Models; Greenhouse Effect; Atmosphere; Meteorological Measurements; Magnetic Poles; Ocean Currents; SAMA; History
Introduction
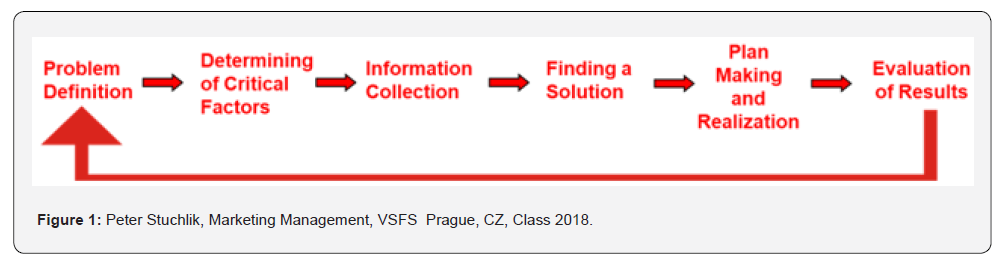
The following article originated in a Marketing Management course. In the course, students learned how to find relevant information, how to connect the pieces, verify information and how to work with them, following a subsequent pattern (Figure 1).
This output is the third step in the procedure. The fundamental questions to be answered and verified (Problem Definition) were formulated as follows:
Q1: Are current global climate changes the result of human activity?
Q2: To what extent is the information presented publicly by the media reliable?
Q3: Which factor has the greatest impact on current global climate change?
In addition, the following critical factors were identified before work on the solution began:
C1: Take historical findings into account.
C2: Trace the published information back to its original sources.
C3: Take into account all key parameters that influence the global climate, but to give priority to information about temperatures and atmospheric composition.
C4: Work only with information that can be cross-verified.
C5: If data are found that, although verified, are scientifically or logically questionable, transform them or, if necessary, explain why they deviate.
The article does not cover the subsequent steps of the marketing process. The obtained and verified information is combined to draw only general conclusions.
Background
Of the total global population, 60–80% of people believe that current climate change is caused by human activities. There is a vast amount of literature on global warming, both scientific and popular. However, if one takes a close look at these scientific publications, one will find that the overwhelming majority of them were commissioned. Scientific publications are usually intended to provide “evidence” that global warming is the result of human activity. At the same time, however, arguments taken from these sources without verifying their credibility also appear in some otherwise reputable scientific works. The popular ones, which are also written on commission, are a generalized, summary-style repetition of the scientific ones, with the same goal in mind.
The theory of global warming was popularized in the 1980s by James Hansen. He claimed that the increased concentration of carbon dioxide in the atmosphere will cause the greenhouse effect, leading to a rise in global temperatures [1]. But people tend to omit the fact that the author himself retracted his theory in the 1990s. Because over the span of 10 years, it became clear to him that global temperature is not related to the concentration of carbon dioxide (CO2) in the atmosphere, but to entirely different processes [2]. Furthermore, over those 10 years, the concentration of CO2 in the atmosphere increased only negligibly [3]. Current increases in CO2 are even smaller. When it comes to this issue, an important fact is often overlooked: what causes the consumption of CO2 in the atmosphere? Furthermore, the validity of the related measurements, particularly CO2 content in the atmosphere and the temperatures reported, is also usually not specified.
CO2 consumption:
The Earth has two primary sources of oxygen, both of which consume carbon dioxide (CO2) from the atmosphere at the same time. They are the forests and the seas. The oceans are the largest source of oxygen [4]. Most marine animals and plants that produce oxygen and consume CO2 are highly dependent even on small fluctuations in the parameters of the environment in which they live. They can tolerate only a narrow range of environmental conditions and changes in vegetation conditions under which they reproduce. Their living conditions are affected by rising sea temperatures and the mixing of water masses. And this is caused by a change in the direction of ocean currents. People have absolutely nothing to do with that.
Measurement of values:
There are respectably looking graphs that show how the Earth’s temperature is rising. However, this obscures the question of how temperatures were measured and how the presented temperature data were obtained. Temperatures began to be measured systematically during the 18th century. The first professional weather stations, however, appear only in the first half of the 19th century. It was not until the early 20th century that the number of these professional weather stations began to increase [5]. Even if we deliberately choose to disregard the reliability and accuracy of the data obtained, there is one factor that is even more important. The weather stations where this data comes from used to be located far outside cities. Currently, they are located within cities or on their edges, for example at airports. And while a hundred years ago people mainly heated their homes with wood and coal, today’s energy consumption in every city is many times higher. In this way, every major city creates a microclimate with a radius of up to 0.5 times its diameter [6]. For example, London (UK) influences the climate up to a distance of 60 km. So what exactly is being measured? What temperatures are recorded? And the same problem that exists with temperature measurements also applies to measurements of CO2 levels in the atmosphere.
For historical data that extend beyond the time scale of human measurements, various indirect models are used, based on the mathematical evaluation of some assumed relationship, in accordance with a particular theory [7]. There is scientific debate over how accurate these models are. This means that all the obtained values have a relatively low probability of accuracy. But they are presented as the facts.
Temperatures:
However, global temperatures have indeed been rising slightly in recent decades. But what’s really behind it, and why? First and foremost, we must finally acknowledge that temperatures on Earth undergo periodic fluctuations, even without any human intervention or human activity. Or does anyone really think that humans caused the Ice Age? Or the temperatures of the Jurassic Period, which were even higher than they are today?
Even though temperature models can’t tell us the exact temperatures, they do give us a rough idea of whether it was cold or warm. I’ll give you a few examples.
Grapes were cultivated along the Mediterranean coast of Africa until the 4th century AD. From this is clear that average annual temperatures there were lower, there was no desert and there was enough water in the landscape [8].
Or that until the mid-12th century A.D., grain was grown in Greenland, there was no sign of glaciers and the entire island was green. That is why it was named Greenland. Greenland did not become glaciated until sometime between the 12th and 17th centuries [9]. So today’s glacial melt is really just a return to the conditions that existed there not so long ago. Just a few centuries back.
It is known from paintings that Europe experienced exceptionally cold weather from the 16th century to the end of the 18th century. We are familiar the paintings of the Dutch masters showing people sledding on the frozen Zuidersee. Or depicting the French cavalry seizing a fleet of anchored Dutch warships, frozen in ice [10].
If we look at the estimated temperatures based on temperature models derived from data spanning millennia, the graph shows that over a certain long period, the Earth’s temperature rises slightly and then falls slightly again. But during that transitional period, temperatures on Earth will fluctuate in both directions, like on an oscilloscope. This transitional section looks like the teeth of a saw.
There are several causes for these periodic temperature fluctuations. The Earth’s position in space, solar activity, and the Earth’s own activity. Let’s give one small example. When Krakatoa erupted, it spewed so much ash into the air that the Earth’s temperature dropped by several degrees Celsius for three years [11]. And some of Earth’s other activities are even more effective.
At the same time, these long-term temperature periods, which last for centuries, are also disrupted by short-term periods. From the mid-19th century to the present day, we have been living in the same temperature period. Yet the 1940s and 1950s were the coldest period of the entire 20th century [12].
Causes:
Let’s take a look at what’s actually happening and why. Since the 1980s, the so-called ”South Atlantic Magnetic Anomaly” (SAMA) has been expanding [13]. Its increase is well documented, as is the heightened activity of the Yellowstone mega-caldera. And of another mega-caldera in the Pacific, too.
It is known that the “South Atlantic Magnetic Anomaly” (SAMA) causes a deviation in the positions of the Earth’s magnetic poles [14]. For centuries, it has been documented and proven that the North Magnetic Pole has rotated around the Earth’s axis of rotation at regular intervals of several years. Its greatest deviations were 4° [15]. For this reason, all nautical charts included the calculated deviations of the North Magnetic Pole for each year to ensure accurate navigation. These were usually calculated several years in advance, and the information was reliable.
However, a fundamental change took place in the 1990s. The North Magnetic Pole stopped rotating around the Earth’s axis and began to drift in one direction. But starting in the 1980s, the historical activity of the Earth’s magnetic poles also began to be studied more thoroughly. It has been known and proven for decades that in the past, the magnetic poles were located elsewhere than they are today. And that the North and South Poles have even switched places. This research also revealed that during certain periods in Earth’s history, there were as many as four magnetic poles [16]. Subsequently, the first models were developed to predict the movement of the magnetic poles and its impact on the global climate.
Conclusion
It has been well established for many decades that ocean currents are one of the two most important factors influencing the global climate [17,18]. The second most important factor is solar activity. But seawater is salty and conducts electricity. This means that the laws of induction apply to it. Ocean currents are essentially giant conductors. So their direction of flow depends both on the Coriolis acceleration and on the position of the magnetic poles. That is why the “El Niño” phenomenon occurred periodically. As a result of the magnetic pole’s deviation from the Earth’s axis, the directions of ocean currents also change. And the result is global climate change.
People have no influence on the growth of the “South Atlantic Magnetic Anomaly” (SAMA). Just as they have no influence on the movement of the Earth’s magnetic poles, let alone changes in the flow and direction of ocean currents.
Behind everything that is happening to humanity worldwide, there is always someone’s economic gain. So convincing such a large portion of the world’s population that humans are responsible for climate change can be considered a major commercial success. Why is it that these days, when information is so easily accessible, more and more people refuse to look up the information they need and put it into context? People believe what they want to believe, but why do they close their eyes and turn off their brains to do it? While this approach is convenient, don’t people realize how much they’ll end up paying for it? Through their attitude toward global warming, people prove every day that Goebbels’ old motto still holds true: “A lie repeated a hundred times becomes the truth.” And perhaps that is why we have become a world where the exact opposite of what is officially presented and accepted is the truth.
References
- Michael E Mann (2026) Britannica Editors. Greenhouse gas atmospheric science also known as GHG.
- Michael E Mann (2026) Britannica Editors. Theoretical climate models in global warming in Climate research.
- Samset BH, Zhou C, Fuglestvedt JS, Lund MT, Marotzke J, et al. (2023) Steady global surface warming from 1973 to 2022 but increased warming rate after 1990. Communications Earth & Environment (Nature portfolio).
- Johnson KS & Bif MB (2021) Constraint on net primary productivity of the global ocean by Argo oxygen measurements. Nature Geoscience 14: 769-774.
- Naylor S (2024) The Observatory Experiment: Meteorology in Britain and Its Empire. Cambridge University Press.
- Miao Yang, Chen Ren, Haorui Wang, Junqi Wang, Zhuangbo Feng, et al. (2024) Mitigating urban heat island through neighboring rural land cover. Nature Cities (Springer Nature).
- Michael Sidiropoulos Meng (2023) Ten Theories of Climate Change.
- Hobson MS (2015) The African Boom: The Origins of Economic Growth in Roman North Africa. Oxford University Press.
- Vincent Bichet, Emilie Gauthier, Charly Massa, Bianca Perren, Hervé Richard, et al. (2013) The history and impacts of farming activities in south Greenland: an insight from lake deposits.
- de Jonge JC (1858) Geschiedenis van het Nederlandsche zeewezen, pp. 1793-1853.
- Kruseman AC, Collection americana, Book from the collections of University of Michigan Language Dutch.
- Nathalie Schaller, Thomas Griesser, Andreas Marc Fischer, Alexander Stickler, Stefan Brönnimann (2009) Climate effects of the 1883 Krakatoa Eruption: Historical and Present Perspectives. Vierteljahrsschrift der Naturforschenden Gesellschaft in Zürich 154(1/2): 31-40.
- KNMI Daily dataset of 20th century surface air temperature and precipitation series for the European Climate Assessment, The Royal Netherlands Meteorological Institute.
- Ginisty F, Wrobel F, Ecoffet R, Mandea M, Michez A, et al. (2024) South Atlantic Anomaly Evolution Seen by the Proton Flux. Journal of Geophysical Research: Space Physics 129(6): e2023JA032186.
- Philip W Livermore, Christopher C Finlay & Matthew Bayliff (2020) Recent north magnetic pole acceleration towards Siberia caused by flux lobe elongation, Nature Geoscience 13: 387-391.
- David R Barraclough & Malin SRC (1981) 150 years of the North Magnetic Pole. Nature 291: 377.
- Tikhonov AA & Petrov KG (2002)Multipole model of the Earth's magnetic field. (n.d.). 40: 203-212.
- Rahmstorf S (2003) Thermohaline circulation: The current climate. Nature 421: 699.

























