


Natural Disasters and Sustainability: Can Private Capital Finance Community Recovery?
David Nickerson1* and Thomas Husted2
1Rogers School of Management, Ryerson University, Canada
2Department of Economics, American University, United States
Submission: October 10, 2022; Published: November 03, 2022
*Corresponding author: David Nickerson, Professor, Rogers School of Management, Ryerson University, 350 Victoria Street, Toronto, ON M5B 2K3, Canada
How to cite this article:David N, Thomas H. Natural Disasters and Sustainability: Can Private Capital Finance Community Recovery?. Ann Soc Sci Manage Stud. 2022; 8(1): 555728. DOI: 10.19080/ASM.2022.08.555728
Abstract
As a substitute for public aid, the availability of private credit exerts a significant influence on the economic recovery of a community from direct and indirect losses inflicted by a natural disaster. Although knowledge about the availability of private credit and the relative efficacy of credit markets is important to the sustainability of at-risk communities, existing empirical research on private loan size, loan terms and the relative value of a representative loan contract to both lender and investor exhibits highly divergent results. All of these empirical studies lack a theoretical foundation, while theoretical financial models, all of which assume the presence of adverse selection or moral hazard, can be difficult to implement in most circumstances. Unlike earlier research, we eschew such exogenous assumptions about asymmetric information and instead offer a starkly contrasting model of the local credit market germane to the restoration of a community affected by a disaster. Our model incorporates complete markets, full information and common knowledge of the distribution of credit risk inherent in the private financing of community restoration, as well as including standard loan covenants, such as default and foreclosure, which are absent from earlier research. Using realistic parameter values, we derive numerical equilibrium values for credit availability and loan terms for investors in community recovery who pose different degrees of credit risk to lenders. Our numerical results demonstrate a rigorous means of reconciling the divergent findings in prior research. When combined with the calibration of parameter values observed in an affected community, we conclude that our model is a promising first step toward developing a useful means of both explaining prior empirical results and the provision of guidance for both private lenders and public policymakers.
Keywords: Sustainability; Finance; Policymakers; Econometrics; Natural disasters
Introduction
Each year, natural disasters occur across the globe, disrupting societies, inflicting large direct and indirect economic losses, and causing many thousands of deaths and disabilities. The number of recurrent disasters that have occurred in this century and the one previous have inspired a large and growing body of research in both the physical and social sciences while the availability of private credit and ex post public aid subsidies as alternative means of restoring or rebuilding of the built environment in affected communities has become an important topic for research in the social sciences and of direct concern to public policymakers.
Recent econometric analyses of severity, frequency and loss data document the significance of three empirical regularities exhibited by the occurrence and recovery from disaster losses. First, the frequency and severity of natural disasters, whether measured in physical or economic terms, has significantly increased over the last three decades and will almost surely continue to increase, perhaps at an accelerating rate, owing to adverse changes in the natural environment [1,2]. Natural disasters have led to over one million deaths and economic losses of approximately three trillion USD over the last twenty years [3]. During 2020 alone, approximately three hundred thirty-five natural disasters occurred across a sample of one hundred nations, resulting in over nine thousand deaths and inflicting direct economic losses estimated to be approximately 300 billion US dollars1. The annual global incidence of significant disasters since 2005 has increased by approximately three hundred percent relative to the previous three decades [4].
1The United States, as an example, suffered approximately 160 billion USD of direct economic losses in that year and has averaged over 140 billion annually since 2000 [4].
Second, while the relative liability for private economic losses has, in the United States and most member states of the European Union, historically been borne by the private sector, a steady shift toward public liability has occurred since the early years of the last century [5-7]. This trend is especially noticeable in the United States. During the entire 19th century, Congressional legislation was passed to allow federal aid to disaster-stricken communities less than one hundred times, and almost all major recovery efforts from extreme disasters were primarily financed by private capital2 [8]. In the decade prior to 1953, the sum of total public expenditures on disaster recovery was approximately 52 million USD, while federal disaster recovery expenditures have exceeded $300 billion (real USD) during the period 2000 — 2015. As further illustration of the fiscal significance of disaster aid, the 160 billion expenditures on aid by the US federal government in 2018 was approximately 18% of the federal budget deficit in that year3 [9- 12]. The approximate share of direct economic loss borne by the federal and state governments has increased from twenty-six percent in 2000 to approximately forty-seven percent in 2014, an increase of 46% [13,14].
If this current trend continues, the discounted value of public aid expenditures over the remainder of this century has been forecasted to be approximately $2.1 trillion (real USD), a public liability comparable to that forecasted for Social Security payments over this same period [15]. Expenditures to subsidize the recovery of local communities from disaster losses is a significant and increasing source of fiscal strain on taxpayers in the United States, member states of the European Union, Japan and many other nations. This raises questions concerning the economic efficiency and social equity of current disaster policy in these nations and, in particular, why the role for private capital in community investments and restoration has rapidly diminished and whether that trend can be reversed.
The third regularity is that, while the time required for the approximate economic recovery from direct and indirect economic losses of an affected community is often surprisingly long, the availability of credit to finance business and residential investment within the affected community and the corresponding rate of such investment are the most significant determinant of the time until that recovery is achieved [16]. The availability of credit for such investment, however, appears to be significantly lower than can be readily explained by adjustments in risk-adjusted yields [17]. Moreover, empirical research into the response of private lenders, following the occurrence of a disaster in an affected community, has produced highly conflicting results. While most such research has documented a severe decline in credit availability in the aftermath of a disaster and a corresponding drop in community and regional investment in several countries [16,18-20], other studies, based primarily on American data, have found that the increased demand for credit by investors has elicited an accommodating supply, particularly from large and geographically-diversified lending institutions (Cortes and Strahan, 2014) and [21]. While the econometric models in all of these empirical studies omit any role for such essential financial variables as loan rates, measures of credit risk and subsequent rates of default and prepayment, they collectively furnish evidence that the relevant markets for credit may be plagued by systematic inefficiencies. Understanding the economic and political determinants of credit availability and investment in an affected community is a prerequisite to the design of economically efficient disaster policy, but the current conflicting findings about the postdisaster response of credit markets, accompanied by the absence of rigorous financial modeling provide grossly insufficient support to policymakers evaluating the efficiency of current disaster policy and offering little if any guidance for the design of alternative aid programs which would both hasten the rate of recovery and simultaneously alleviate the growing fiscal burden of publicly financed aid by shifting the liability for private loss from disaster back to the private sector.
Existing economic explanations for lending and investment in the aftermath of a disaster, such as a hurricane or flood, depend directly on the presence of market failures impeding the ability of lenders to accurately price the credit risk inherent in secured loans. Early models of inefficient risk pricing, such as those by Jaffee & Modigliani [22] and Barro [23], relied on an exogenous inability of lenders to accurately underwrite credit risk to explain variations in the availability of credit. While consistent with a variety of intertemporal lending patterns, these models could not generate endogenous credit market equilibria and consequently are an unreliable means to evaluate the full effects of a public aid program.
2The most notable such disaster was the Great Chicago Fire of 1871 [8].
3Similar levels of public recovery expenditures relative to GDP are observed in many other nations. The Japanese Diet has authorized, as of 2017, 181 billion US dollars in federal aid to residents and local governments of Iwage, Miyagi and Fukushima prefectures, following the catastrophic 2011 earthquake and tsunami. Annual federal expenditures on disaster recovery in Mexico since 2000 have exceeded 1.5 billion US dollars [9]. The Polish national government transferred approximately 500 million USD, nearly a third of their annual average GDP, to aid to residents affected by the 1997 European floods [10]. In the immediate aftermath of the 2002 floods in western Europe, regional and central German governments provided around half a billion euros of emergency relief to their citizens [11] and the Austrian government transferred a similar amount [12].
More recent explanations, following Stiglitz & Weiss [24], use the presence of adverse selection or moral hazard to limit the pricing of risk to the average degree of credit risk among a group of investors4 [25-28]. Tn this context, the response of lending to finance investment in an affected community could be explained in terms of the proportion of all investors with disasterinduced but unobservable changes in their propensities to default5. Equilibrium allocations of credit in these models, which necessarily depend on unobservable changes in the credit risk posed by investors, may be realistic in developing economies with nascent financial markets, the relatively low cost of measuring credit risk and monitoring disaster losses of investors renders adverse selection or moral hazard insufficient to fully explain the observable changes in credit availability.
Significant political effects on credit availability and private investment in affected communities can also occur owing to lender and investor uncertainty regarding public infrastructure restoration and replacement. Uncertainty on the part of private sector participants to arises from their general inability to accurately infer competing agendas, motivations or other influences on the parts of local, state and federal government to finance or undertake infrastructure investment following a significant disaster. One specific source of such uncertainty also involves, as in economic models, asymmetric information on the part of lenders, investors and members of different levels of government. One example of this involves electoral moral hazard, either on the part of the federal government, which affects the total public infrastructure aid made available to states, or on the part of the state, which affects the allocation of that aid to local governments. The former issue has been empirically examined by Sylves & Buzas [29], Healy & Malhotra [30], Reeves [31], Husted & Nickerson [32] and Gaspar [33], while the latter has been analyzed by Husted & Nickerson [34]. Uncertainty of this type can be exacerbated further by competition for electoral favor by different levels of government when all levels share political accountability for disaster response and recovery. Strategic actions by an official or agency at one level of government inflict positive or negative political externalities on those at other levels, such as when disproportionate amounts of state tax revenue or federal aid are allocated to local community recovery.
This paper offers a novel and fundamentally different explanation for the existing evidence of changes in available credit and local investment owing to a disaster. In contrast to the reliance of existing economic and political explanations on the presence of moral hazard or adverse selection, our explanation uses a traditional asset-pricing model incorporating complete information and efficient risk pricing, augmented by strategic behavior by individual lenders and investors. The representative market for credit is assumed to be embedded in a continuoustime economy exhibiting common knowledge, complete markets and arbitrage-free valuation, augmented to incorporate the noncooperative strategies chosen by a representative lender and borrower in negotiating the terms of a standard secured loan contract6 [35].
The paper considers, in the context of the non-cooperative credit market equilibria produced by our model, the endogenous terms on which private credit is available to finance investments in a community which has suffered significant economic losses in the immediate aftermath of the occurrence of a natural disaster7. in negotiating the terms of credit, the strategies of lender and investor will include the respective choices by these parties to exercise their respective options, implicit in such a contract, as a function of the volatility in the common estimate of future market value of the investment project which serves as the collateral securing the loan. Investors will choose the conditions under which they exercise their options to default or prepay their loan and the timing of this exercise will depend directly on the volatility in the value of their investment projects. Increases (decreases) in such volatility will, for example, cause increased (decreased) delay in this exercise relative to the time most favorable to the lender and, since the risk posed to the lender by this strategic behavior is endogenous, the optimal strategy chosen by the lender will be unable to fully hedge his expected credit loss.
We show that changes in the parameters describing the lending environment, including volatility in returns, the rate of dividends and liquidation costs, yield credit market equilibria which feature significant changes in the availability of credit and possibly - even without adverse selection - the rationing of credit to finance investment in the affected community. Observations of significant differences in the terms extended to investors posing small differences in their degrees of credit risk can also occur in equilibrium without the assumption of asymmetric information relied upon in the relationship-lending literature. Investments in communities with equivalent degrees of credit risk, as measured by external observers, but distinguished by different magnitudes of loss can also elicit dramatically different loan terms. Surprisingly, equilibria in all of these situations are consistent with a constrained efficient allocation of credit across investors. On the basis of these results, we conclude by presenting a program of public aid that differs in design from the current programs of subsidized lending, like that of the SBA in the U.S., and from the program of direct grants to private parties, such as the Individual Assistance (IAIHP) program implemented by FEMA under the Stafford Act and its amendments. We demonstrate the practical use of our model for policy guidance by deriving numerical examples of subsidies as a function of parameter values directly observable in actual credit markets. Finally, we observe that aid programs in markets with relatively complete information can, in an economic context, be supported only upon normative or humanitarian, rather than efficiency, considerations, but that the salient credit market may appear inefficient to policymakers and researchers if empirical analysis relies on the data regarding post-disaster credit risk posed by investors in an affected community. Paradoxically, the use of unadjusted measures of actual credit risk produced by the underwriting models commonly employed by many small lenders may actually lead to inefficient lending decisions.
4Examples of the Stiglitz and Weiss approach include Bester [25], Choe [26], Hart & Moore [27], Gorton & Kahn [28] and many others.
5The financial literature on “relationship lending” divides investors in precisely this way, with lenders and investors mitigating adverse selection or moral hazard on the basis of repeated lending.
6Loans are initially assumed to be free of public subsidies. This assumption is made to describe our results more clearly in regard to public policy design, but note, in terms of realism, that the extent of actual post-disaster financing from public sources, such as the American example of SBA loans, constitutes a small share of total credit extended to investors in most developed countries [35].
7Economic losses in actual disasters are of two types. Direct losses, which are in principle verifiable and include damage to the physical capital, such as buildings, inventory and equipment, of businesses within the community and to residential capital such as single and multifamily housing units and household possessions. Indirect losses, which are more difficult to measure, include the loss to firms of production at pre-disaster levels, breach of contracts and sales both within and outside of the community and losses to households, including the interruption of communications, potential difficulties in accessing financial resources, and so on. Note that direct losses also include those to public infrastructure. Local and state governments normally finance only a minor share of restoration costs and investment through private sources and, consequently, our interpretation of results below stress private investment as the major influence on credit demand and market equilibrium.
The paper is organized as follows. Our model is described in Section 2. Numerical results measuring the effect of disaster risk on credit and investment in disaster-stricken communities are presented in Section 3. Their interpretation, implications for both current research and the design of public policy, and our concluding remarks appear in Section 4. References are forthcoming.
The Model
Our model consists of the representative loan contract the strategies of the borrower and lender, and the nature of equilibrium in the credit market. Each of these components is described below.
The Representative Loan Contract
The model consists of a standard loan contract between a lender and an investor who wishes to finance an investment project (“asset”) within the affected community. The lender advances a unit of wealth at date 0 in return for a pledge by the investor to remit continuous repayments at constant rate c, as well as a possible terminal payment c over a maturity of length Τ . Denoting the continuously compounded interest rate charged by the lender by y, the balance of the loan m(t) outstanding outstanding at date t, 0 ≤ t ≤ Τ , satisfies8 [36,37]:
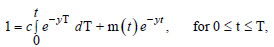
where C= m(Τ) .
The asset being financed is the collateral securing this loan.
The market value of the asset, h (t) evolves according to
dh (t) =α (h,t) dt +σ h (t) dz (t) , (2)
where z(t) is a standard Brownian motion, σ is a constant volatility parameter and α (h,t) is the instantaneous conditional mean change in h(t)9. Possession of this asset entitles its owner to a flow of explicit or implicit dividends accruing at the rate η (h,t) , unless the investor defaults by withholding the coupon payment C. If the investor defaults, the lender seizes the collateral and sells it for (h,t) − b (h,t) , where b (h,t) is the liquidation cost incurred by the lender, with any funds from this procedure in excess of the outstanding loan balance m(t) refunded to the investor10 [38,39]. Consistent with standard bankruptcy law, failure of the investor to make scheduled loan payments allows the lender, if she chooses, to foreclose and liquidate the asset securing the loan.
8We avoid adjustments of the loan rate in order to analyze the lender’s strategic option to default and the best-reply strategy of the lender in the simplest possible setting. In the context of this non-contingent loan contract, incorporation of adjustable rate loans is simply equivalent to shortening the maturity of the original loan. See Anderson & Sundaresan [36], Jones & Nickerson [37] and related papers on strategic debt service for technical details.
9The mean (“expected drift”) α (h,t) satisfies the Lipschitz condition uniformly in t , which assures the existence and uniqueness of the solution to (2). Calibrating the value of this mean allows the equity return on the asset to conform to any observed intertemporal pattern consistent with investments of this type in the chosen community.
10Note that, in addition to explicit legal, administrative and transaction expenses, liquidation costs can include the opportunity cost of receiving neither loan payments nor interest on the value of the collateral during the interval between default and the time the collateral is sold. This can be lengthy; in the case of residential investment, estimates by Clauretie & Daneshvry [38] and Biswas, et. al. [39] of the average costs of liquidating residential properties in the United States range between thirty to fifty percent of the market value of the property at the time of foreclosure.
The final assumptions of the model are that lenders and investors may costlessly trade in markets that are complete with respect to the credit risk posed by the investor and that either party can also trade in riskless bonds (such as Treasury bills) at a constant and continuously compounded interest rate γ11.
Strategies of the Lender and Investor
Abstracting from the ability of the lender to call the loan, the strategy of the lender consists of two actions. The first is her choice of an initial loan balance per dollar of asset value. The second is her choice to initiate or abstain from foreclosure should the lender default. Should the lender foreclose at any date t, following an investor default, he can liquidate the collateral at that moment, h(t) and receive the net value max {0,(h,t )−b(h,t )} . In the current model, the lender’s return is maximized by foreclosing immediately after default.
The lender’s strategy also consists of two actions: at any time before loan maturity Τ , he may choose to continue servicing the loan by making the payments c(t) , default by ceasing those payments, or prepay the loan’s balance. Default is induced by ceasing to make coupon payments c at any time, or, at maturity, the terminal payment C(Τ) , leading to his loss of the collateral asset. Since asset prices are unbounded, the second action available to the investor is his option to prepay the loan balance m(t) , subject to a cost f(m(t)) of refinancing the asset. He will do that if the asset value has risen to the point where he can payoff the existing loan balance and, owing to his higher equity value and lower probability of default, he can refinance the outstanding balance at a lower loan premium. The lender chooses her actions, the magnitude of loan funds proferred per dollar of collateral value and potential foreclosure upon lender default, to maximize the expected value, at the date of loan origination t = 0 , of her position in the loan contract, while the investor selects to continue servicing the loan, default by withholding the contractual coupon payment c or prepay the existing loan balance, to maximize the value of his position in the loan contract.
Credit Market Equilibrium
Market equilibrium in this non-cooperative game is achieved
when the lender and investor choose the strategies maximizing
their position in the loan contract, conditional on the other player’s choice or strategy. These choices are made on the basis of the asset
value at each moment, {h(t),t} , which is common knowledge to
both players and which, in our framework, summarizes all the
relevant information germane to the choices of both players.
Consequently, it is the value of the asset h(t) at any given moment
t , which determines the choice of each player’s strategy, where
the value of the asset evolves unpredictably by equation (2).
This role of h(t) allows us to determine equilibrium through
the endogenous partitioning of the set of all possible values of
h(t),t Denoting by )  the range of housing values h , and
by Τ ≡ [0,Τ] , the time from loan origination to maturity, then all
realizations of the asset value at each moment are equivalent to
points in the space Η χ Τ .
the range of housing values h , and
by Τ ≡ [0,Τ] , the time from loan origination to maturity, then all
realizations of the asset value at each moment are equivalent to
points in the space Η χ Τ .
This space can be, through the evolution of asset value and the strategies of the players, endogenously divided into the subsets D and p If, at t , the asset value h(t) crosses the boundary into the subset D, the investor maximizes her value by defaulting. If this asset value crosses the boundary into the subset P , the investor maximizes his value by prepaying the loan balance. The strategy of the investor, consequently, is defined by the union of these subsets, D χ P , and any sample path of the evolution of the asset through equation (2) will respectively trigger default or prepayment. If, however, the sample path of {h (t),t} remains in the subset defined by the complement of D χ P in Η χ Τ , the investor continues paying the required coupon c(t) and the loan continues.
The defining aspect of the equilibrium, as a consequence, is the determination of the boundaries for D and P . This is achieved through the solution of two linked partial differential equations, known as the players’ respective valuation equations, and the free boundary conditions, dictated by the covenants of the loan contract, of those equations. The solution to one such equation represents the value through time of the lender’s position in the loan contract and the solution to the other that of the borrower’s position. Although we will noit delve into the details of these equations, their boundary conditions or their solutions, the interested reader can consult a number of papers, including Anderson & Sundaresan [36] and Jones & Nickerson [37], for full technical details.
11Credit risk here is simply the random variation in the value of the asset securing the loan. The traditional assumption of “complete markets” requires that any random variable with finite variance can be obtained as the terminal value of some self-financing trading strategy. Each party can, as a consequence, hedge the risk of random changes in h(t), which implies the absence of arbitrage in financial markets. Combined with the assumption of complete and common knowledge of (2), it also precludes the presence of either moral hazard or adverse selection.
Credit and Investment in the Affected Community
Analytical solutions for the valuation equations of the lender and investor and the attendant boundaries of the regions D and P , in which the default and prepayment options (actions) held by the investor are optimally exercised, cannot be obtained when these boundaries vary with the term remaining on the loan, such as with loans with finite term to maturity. Numerical solutions can be applied in these cases, permitting us to consider the nature of the lending equilibrium in realistic parametric cases and providing additional insight into factors affecting the flow of loan credit. We focus our reported results on the value of the loan contract to the lender, L(h,0) , which coincides with the volume of loan funds loaned in equilibrium, as other variables in the loan contract change their values in equilibrium12.
We use a finite difference procedure to solve the problem for representative parametric cases. The set Η × Τ is represented by a discrete rectangular grid of h and t values. A solution is a set of L and M values for these grid points, together with an indication whether each point is or is not in D, P or S . Working backwards from time Τ , the valuation equations are ‘solved’ for each time step using the Crank-Nicholson discrete approximation for the partial derivatives13. After each step, one checks, for each individual and each value of h , whether either could do better by exercising the options available to him. If so, the value functions of both individuals are appropriate adjusted to reflect this. One continues moving recursively in this fashion until the origination date of the loan is attained.
The parametric cases examined below assume that bankruptcy costs b(h,t) , flows of dividends η(h,t) and refinancing costs f(m(t)) are independent of time and are homogeneous in their other arguments14 [40]. The optimal strategy of the lender, for each case, can consequently be reported independently of the absolute size of the loan [41].
A benchmark set of values for the terms of the loan contract is used to evaluate the effects on the volume of loan funds L(h,0) , lent per dollar of the market value h(0) of the asset collateralizing the loan. This benchmark set is calibrated as follows: the riskless interest rate is γ = .05 per year; annualized proportional volatility of the value of the asset collateralizing the loan is σ = .2 ; the term to maturity of the loan is Τ = 5years; no payments are due before maturity, so that c = 0 ; the contractual loan rate spread over the riskless rate, y −γ , is .02 per year; there are no flows of dividends from the collateral and no bankruptcy or refinancing costs. The amount due at maturity is 1.419 per unit of currency initially lent15
Tables 1 & 2 show both the market value and the initial balance of the representative loan made to finance an investment project in a community recently suffering economic losses from the occurrence of a disaster. Each of these table shows how the maximum loan balance, measured as a percentage of the expected value of the investment project, varies with one of the underlying economic parameters characterizing the affected community, keeping all other parameters at their benchmark values.
Table 1 demonstrates the respective effects on the available loan balance of changes in two such contractual parameters, the amortization rate of the loan, measured by the coupon rate c , and the term to maturity Τ . The first row of Table 1 demonstrates how faster loan amortization increases the credit available to an investor, with a elasticity of funds supplied ranging from approximately 7% to 15%, per two percentage point increase in the coupon rate c . The second case shows the negative impact on the supply of credit of increases in lengthening the term to maturity. An initial doubling of the term to maturity lowers the proportion of funds offered by approximately 4 percentage points, while an increase in the term from four to five years lowers the funds offered by approximately 1.5 percentage points, with a smooth convex decline throughout the range of contract durations.
12Each case we analyze, consequently, will focus on the best-response strategy of the lender, taking as given the other features of the loan contract. We do not single out, in this section, any specific vector of loan terms as a unique perfect equilibrium in our lending game. See Fried [40] for methods of the numerical solutions of differential equations and a discussion of the Crank-Nicholson method of solution used here.
13See, for example, Press et al, Numerical Recipes, 1986. The procedure approximates partial derivatives by the average of difference expressions in the grid point values of M and L at time t , for which one has the last solution, and time t + k , for which one does not. Requiring the valuation equations to hold at all grid points results in a tridiagonal system of simultaneous linear equations in the unknown values at the current time slice. This is then solved for the values at t + k , and so on. The method has the virtue of being numerically stable for all sizes of k , and second order accurate in both the t and h directions.
14That is, b(h,t) = bh(t), η(h,t) =ηh(t) , f(m(t)) = fm(t) .
15The annualized volatility is the volatility of equity investments, averaged over the S and P 500, FTSE 100, DA X and TSX annual yields over the period 1988-2018.


Table 2 demonstrates the respective effects on the maximum loan balance of two aspects of the investment securing the loan, the flow of dividends and the volatility in the value of the investment project. The first column demonstrates how increased flows of dividends accruing to the investor reduces lender’s willingness to finance his investment. Each two-percentage point increase in the flow of dividends, for example, reduces the loan balance in a convex fashion, from an initial decline of .068 in the current value of the investment to a decline of .05 for a change in η from .06 to .08. The second column illustrates relation between the price volatility of the investment project and the proportion of funds offered by the lender. An increase in the standard deviation of the project’s price from .00 to .05 reduces the funds offered by .016 percentage points while a further increase in the standard deviation, in increments of .05% from .05 to .35, with an increase in the magnitude of the decline from .066 to between .100 and .105 percentage points as the standard deviation increases, in increments of .05, from .05 to .35, with a convergence of the difference in the successive rates of change for volatility values above .15. These values encompass the range of average price volatilities across neighborhoods in most U.S. cities. Such a result suggests, for example, the existence of a relation between differential loan credit conditions across different neighborhoods, for identical yields and other terms of loan loans, if those neighborhoods exhibit a significant difference in the volatility of property prices16
Table 3 illustrates the effects of increased service flows on the positive relation between loan funds offered and the spread between the fixed loan yield and the riskless interest rate. When the proportional flow η of services is zero, in Case One, each two percentage point increase in the spread y −γ elicits a positive but declining increase in the percentage of loan funds offered per dollar of initial collateral value, with an initial two percentage point increase in the spread, from 2% to 4%, increasing L(1,0) from 71.7% of collateral value to 82.7%, while an increase in the spread from 10% to 12%, for example, increasing L(1,0) from 95.5% to 97.2%. Case Two illustrates that a ten percentage point increase in the proportional flow of services, from η = 0 to η = 10% , serves to reduce both the level and change in the proportion of funds offered, L(1, 0), to approximately 60% of the corresponding value in Case One, for each two percentage point increase in the spread: for example, an increase in y −γ from 4% to 6% increases L(1,0) in Case Two (where η = 10% ) from 50.2% to 54.0%, which are each respectively .607 of their corresponding values in Case One. A further ten percentage point increase in the flow of services to η = 20%, as illustrated in Case Three, has an analogous relationship with the corresponding values and rates of change in Case Two, with each value of L(1,0) and change in that value, per two percentage point increase in y −γ , being approximately 60% of the corresponding values in Case Two.

Finally, Table 4 illustrates the effects of changes in proportional bankruptcy costs on the same positive concave relation between loan funds offered and the spread between the fixed loan yield and the riskless interest rate. In this situation, two features stand out. First, an increase in proportional bankruptcy costs from zero to fifteen percent, as in Case Two, reduces the percentage of funds offered per dollar of collateral, for each value of the spread y −γ , but at a rate decreasing in the value of the spread: for example, at y −γ = .02 , the proportional value L(1,0) of funds offered with fifteen percent bankruptcy costs is approximately 88% of the proportion of funds offered with zero bankruptcy costs, but at a spread of y −γ = .08 , the value L(1,0) of funds offered with fifteen percent bankruptcy costs is now only approximately 86% of funds offered with zero bankruptcy costs. A similar pattern is repeated when bankruptcy costs are increased again, from b = 15% in Case Two to b = 30% in Case Three, but with commensurately higher percentages: for the same two respective yield spreads, the value L(1,0) of funds offered with thirty percent bankruptcy costs is now 91% and 87% of funds offered with fifteen percent bankruptcy costs. Second, as a result of the respective magnitudes of the shifts induced in the concave relation between the yield spread y −γ and the funds offered L(1,0) by the successive increases in proportional bankruptcy costs, the increasingly inelastic offer of loan funds with respect to the yield spread actually reverses sign when bankruptcy costs are sufficiently high: for b = 30% in Case Three, the proportion of funds offered per dollar of collateral, L(1,0) , attains a maximum of approximately 72% for yields over the riskless rate between .12 and .14, decreasing for additional increases in the spread. The supply of loan funds, as a function of the difference of the yield y charged over the riskless rate γ , becomes negatively sloped in these circumstances, implying that potential investors may be unable to procure sufficient credit to finance an asset purchase, regardless of the yield they offer to the lender. This occurs because the lender rationally anticipates the higher default probability induced by the higher yield spread, which, in the presence of deadweight losses from bankruptcy proceedings, restricts the flow of loan credit to borrowers.
16This could, in the presence of both fixed and variable bankruptcy or liquidation costs, suggest an explanation for more adverse credit conditions in transitional neighborhoods within a city, relative to more stable neighborhoods, when all aspects of the loan contract itself are held constant.

These results have a variety of empirical implications for lending to communities in the aftermath of a disaster, all of which embody the insights offered by our novel consideration of the collateral securing such loans and the default strategy chosen by the investor in this community. One such implication concerns the alleged inefficiency of credit markets resulting in the lack of ‘credit availability.’ The observation of inadequate availability of credit for community restoration, rebuilding and other investments does not imply any inefficiency; loan balances may be less than investors desire at the terms on which it offered, but the market in which these balances and terms are offered is fully economically efficient. It is not the preference of lenders to withhold capital from the community or moral hazard or adverse selection on the part of investors that is responsible for the observed levels of credit but rather it is the combination of conventional commercial and residential loans with observations of volatility in the value of collateral in the community that are responsible. Investors would always like larger loan balances at more favorable terms and critics of markets as a source of capital to finance community recovery define the inadequate availability of such capital and its accompanying terms in terms of a complete restoration of the community. Whether that amount of capital is actually available depends solely on the maximization of the values of the standard loan contract by both investor and lender and the means used to secure that loan.
Demanding that private capital offered to community investors equal the costs of complete community restoration is equivalent to demanding that lenders endure greater credit risk than would be compensated by the return on such loans. The government aid used to bridge the difference between the actual amount of credit offered by lenders and that amount needed for the full restoration of the affected community is the dollar value of the excess risk carried by lenders should they offer higher loan balances or more favorable terms, and in turn this represents the amount of the public aid that deprives individuals in the larger economy from making their desired investments.
Concluding Remarks
Existing research on the availability of private credit to an otherwise sustainable community has yet to provide a consistent explanation for its general conclusion that credit markets are inefficient and, consequently, public disaster aid is a prerequisite for recovery in the aftermath of a disaster. Empirical research, which is largely atheoretical, has as yet to include such fundamental financial variables as loan size and loan to asset value, loan terms, or measures of credit risk in their standard reduced-form autoregressive econometric models. To the extent that theoretical financial models provide any guidance to empiricists, they are uniformly based on exogenous assumptions of adverse selection or moral hazard in lending transactions, which inevitably biases empirical results as well as providing, in the absence of evidence, a rationale for the necessity of public aid and the subsequent crowding out of private financing.
Our model is representative of a new theoretical framework that does not automatically assume inefficiency in the market for credit but that does incorporate all of the covenants and other features present in standard commercial and household loans. It instead derives explicit non-cooperative credit market equilibria in which the availability of loans, the size of loans conditional on disaster losses and the relative values of a standard loan contract to the lender and to the investor are all determined as endogenous functions of the relevant covenants and other features of actual commercial and household loans. These features include the rate of loan amortization, term to maturity, any positive flow of value to investors from restoring the built environment in the community, default and foreclosure costs, and the appropriate measure of credit risk exhibited by borrowers. Endogenous equilibrium values of credit availability, loan to asset value, and loan terms are then derived from the strategic behavior of both lender and borrower through options available to them through the loan contract, conditional on the values of these underlying parameter values.
Tables One through Four illustrate the capacity of our model to span all values of loan size and terms. This implies that, conditional on the relevant parameter values in the affected community, the predictions of the model for equilibrium loan size, terms and value of the loan to each party are qualitatively and, for appropriate parameter values, quantitatively consistent, with the results of current empirical research. The role played by parameter values is not a disadvantage but rather an advantage in terms of the testability of the model. If the values of the underlying parameters are calibrated to the community and the corresponding credit market, then the model is immediately testable: for example, a significant difference in the predictions for loan size and terms with empirical observations on these variables would constitute a rejection of the current form of the model and could even serve as evidence of the need for public aid, while broad consistency of predictions and observations would suggest that our framework should significantly broaden any discussion of the role of private credit versus public aid in disaster recovery.
Acknowledgement
We thank participants in the 2020 Southern Finance Association Meetings and the 2021 Global Conference on Business and Finance for their helpful comments, and also the insightful comments of Robert A. Jones, who was responsible for many of the ideas underlying this research as well much of the programming code that made our numerical results possible. The usual disclaimer applies.
References
- Field CB, Barros V, Stocker TF, Qin D, Dokken DJ, et al. (eds.), (2012) Managing the Risks of Extreme Events and Disasters to Advance Climate Change Adaptation, Cambridge University Press, Cambridge, UK.
- IPCC (2021) Sixth Assessment Report, Climate Change 2022: Mitigation of Climate Change. Basel: Intergovernmental Panel on Climate Change.
- UNDRR (2021) Annual Report 2021. New York: United Nations Office for Disaster Risk Reduction.
- CRED (2020) The Human Cost of Disasters: an Overview of the Last Twenty Years. Louvain: Centre for Research on the Epidemiology of Disasters.
- Landis M (1999) Fate, Responsibility, and Natural Disaster Relief: Narrating the American Welfare State. Law and Society Review 33(2): 257-318.
- Klein C, Zellmer SB (2007) Mississippi River stories: lessons from a. century of unnatural disasters. Southern Methodist University Law Review 60(4): 1471.
- Schneider S (2008) Who’s to Blame? Misperceptions of the Intergovernmental Response to Disasters. Publius: the Journal of Federalism 38(4): 715-738.
- Sawislak K (1995) Smoldering City: Chicagoans and the Great Fire, 1871-1874, University of Chicago Press, United States.
- World Bank (2014) Financial Protection against Natural Disasters: An Operational Framework for Disaster Risk Financing and Insurance. World Bank Economics Discussion Paper.
- Stripple J (1998) Securitizing the risks of climate change-institutional innovations in the insurance of catastrophic risks. Interim Report ir- 98-098. International Institute of Applied Systems Analysis.
- Schwarze R, Wagner GG (2004) In the aftermath of Dresden: New directions in German flood insurance. The Geneva. Papers on Risk and Insurance 29(2): 164-168.
- Prettenthaler F, Hyll W, Vetters N (2001) Nationale Risikotransfermechanismen fur Naturgefahren: Analyse der Problemlagen fu r Individuen, Versicherer und Staat, Intereg Working Paper no. 19- 2004, Joanneum Research Forschungsgesellschaft mbH.
- Lindsay B (2018) FEMAs Disaster Relicf Fund: Overview and Selected Issues. CRS Report R43537, Congressional Research Service.
- Lindsay B & McCarthy F (2015) Stafford Act Declarations 1953-2014: Trends, Analyses, and Implications for Congress, CRS Report R42702, Congressional Research Service.
- Cummins J, Suher M, Zanjani G (2010) Federal financial exposure to natural catastrophe. In Cummins J (ed). Risk measuring and managing federal financial risk, University of Chicago Press, United States, 61-92.
- Collier B & Babich V (2017) Financing Recovery after Disasters: Explaining Community Credit Market Responses to Severe Events. McDonough School of Business Research Paper No. 2866478, Georgetown University.
- Gourio F (2012) Credit Risk and Disaster Risk. Economics Department Working Paper, Boston University.
- Berg G & Schrader J (2012) Access to Credit, Natural Disasters and Relationship Lending. Journal of Financial Intermediation 21(4): 549-568.
- De Mel S, McKenzie DC, Woodruff (2011) Enterprise Recovery Following Natural Disasters. Economic Journal 122(559): 64-91.
- Hosono K, Miyakawa D, Uchino T, Hazama M, Ono A, et al. (2016) Natural Disasters, Damage to Banks and Firm Investment. International Economic Review 57(4): 1335-1370.
- Chavaz M (2016) Disintegrating Credit Markets: Diversification, Securitization and Lending in a Recovery. Staff Working Paper 617, Bank of England.
- Jaffoe D, Modigliani F (1969) A theory and test of credit rationing. The American Economic Review 59(5): 850-872.
- Barro R (1976) The Loan Market, Collateral and Rates of Interest. Journal of Money, Credit and Banking 8(4): 439-456.
- Stiglitz J, Weiss A (1981) Credit Rationing in Markets with Imperfect Information. American Economic Review 71(3): 393-410.
- Bester H (1994) The Role of Collateral in a Model of Debt Renegotiation. Journal of Money, Credit and Banking 26(1): 72-86.
- Choe G (1998) A Mechanism Design Approach to an Optimal Contract under Ex Ante and Ex Post Information. Review of Economic Design 3(3): 237-255.
- Hart O, Moore J (1998) Default and Renegotiation: A Dynamic Model of Debt. Quarterly Journal of Economics 113(1): 1-41.
- Gorton G, Kahn J (2000) The Design of Bank Loan Contracts. Review of Financial Studies 13(2): 331-364.
- Sylves R & Buzas Z (2007) Presidential Disaster Declaration Decisions, 1953-2003: What Influences Odds of Approval. State and Local Government Review 39(1): 3-15.
- Healey A, Malhotra N (2009) Myopic Voters and Natural Disaster Policy. American Political Science Review 108(3): 387-406.
- Reeves A (2011) Political Disaster: Unilateral Powers, Electoral Incentives, and Presidential Disaster Declarations. The Journal of Politics 73(4): 1142-1151.
- Husted T & D Nickerson (2014) Political Economy of Presidential Disaster Declarations and Federal Disaster Assistance. Public Finance Review 42(1): 35-57.
- Gasper J (2015) The Politics of Denying Aid: An Analysis of Disaster Declaration Turndowns. Journal of Public Management and Social Policy 22(2): 1-16.
- Husted T, Nickerson D (2022) Governors and Electoral Hazard in the Allocation of Federal Disaster Aid. Southern Economic Journal 89(2): 522-539.
- Koetter M, Noth F, Rehbein O (2019) Borrowers under water: Rare disasters, regional banks, and recovery lending. IWH Discussion Paper, No. 31/2016, Leibniz-Institut fr Wirtschaftsforschung and Otto-von-Guericke-University.
- Anderson RW, Sundaresan S (1996) Design and Valuation of Debt Contracts. Review of Financial Studies 9(1): 37-68.
- Jones R, Nickerson D (2002) Mortgage Contracts, Renegotiation and Stochastic Collateral. Journal of Real Estate Finance and Economics 2-3.
- Clauretie T, Daneshvry N (2011) The Optimal Choice for Lenders Facing Defaults: Short Sale, Foreclose, or REO. Journal of Real Estate Finance and Economics 42(1): 504-521.
- Biswas A, Fout H & Pennington-Cross A (2020) Mortgage Losses under Alternative Property Disposition Approaches: Deed-in-Licu, Short Sales, and Foreclosure Sales. Journal of Real Estate Finance and Economics 61(4): 671-679.
- Fried I (2014) Numerical Solution of Differential Equations. Academic Press, New York, USA.
- Press WH, Flamnery BP, Teukolsky SA & Vetterling WT (1986) Numerical Recipes: The Art of Scientific Computing, Cambridge University Press, New York, USA.


