




 ACJPP Home



Abstract
For decades, the Kingdom of Saudi Arabia has focused on achieving advanced levels of economic diversification and sustainable development, yet reaching such goals remains a challenge. Since the adoption of the five-year development plans more than fifty years ago, and with Vision 2030 now ten years old, the Saudi economy has not yet achieved the desired economic diversification. The main aim of this paper is to answer the following question: To what degree did the annual changes in the indicators of governance predict the annual changes in economic diversification between the years 1998 and 2023 in Saudi Arabia? The study addresses this question using partial least squares structural equation modeling (PLS-SEM) with SmartPLS software. Although it could appear to be a limitation, the use of an aggregate governance index (vs. treating each indicator separately in the analysis) did not impact the outcome of the study. The analysis reveals that annual changes in the governance indicators predict the annual changes in the dimensions of economic diversification between the years 1998 and 2023. This finding stresses the importance of focusing on enhancing institutional quality to diversify the Saudi economy, with all governance dimensions collectively and simultaneously enhanced, since each one supports the others.
Keyword: Good Governance; Economic Diversifications; Sustainable Development; Saudi Vision 2030
Abbreviations: PIF: Public Investment Fund; CMA: Capital Market Authority; FDI: Foreign direct investment; NIS: National Investment Strategy; VA: Voice and Accountability; PV: Political Stability and Absence of Violence/Terrorism; GE: Government Effectiveness; RQ: Regulatory Quality; RL: Rule of Law; CC: Control of Corruption; GLMM: General linear mixed model; ECI: Economic complexity; VIF: Variance inflation factor; WGI’s: Worldwide Governance Indicators; EC: Economic Diversification
The Relationship Between Governance and Economic Diversification in the Context of Saudi Vision 2030
In Saudi Arabia, ten development plans were issued between 1970 and 2016, followed by Vision 2030 [1] (2016–2030), whereby economic diversification has been the main target of the government’s plans (Ministry of Economy and Planning [2]; Vision 2030, 2025 [1]). Saudi Arabia’s Vision 2030 has three main pillars: a vibrant society, a thriving economy, and an ambitious nation. The goal of the plan is as follows:
[T]o become a leading global economy, we are improving our business environment, restructuring our economic cities, creating special zones, and deregulating the energy market to make it more competitive. We are also investing for the future by unleashing promising new sectors and privatizing government services to diversify our economy and ensure its sustainability (Vision 2030, 2025 [1]). To achieve this goal, Vision 2030 introduced many indicators to be achieved by 2030, such as raising the country’s non-oil GDP from 18.7% to 50%, increasing the private sector’s contribution to GDP from 40% to 65%, increasing foreign direct investment’s contribution to GDP from 3.8% to 5.7%, and raising Saudi Arabia’s economic position from 19th to the top 15 worldwide (Vision 2030, 2025 [1]). Despite the government’s clear focus on achieving advanced levels of economic diversification, however, sustainable and lasting achievement of this goal remains a challenge, despite the fluctuation in the levels of economic diversification in the Saudi economy.
Many articles have addressed the status of the Saudi economy in terms of whether or not it is diversified. The present article addresses that question and proposes a mechanism for diversifying the economy using governance indicators. The focus of this study is to facilitate the achievement of the goals of Vision 2030 and subsequent plans, as well as to ensure the optimal use of economic resources while taking into account what has been accomplished in the past. This paper seeks to answer the following question: To what degree did the annual changes in the dimensions of governance predict the annual changes in economic diversification between the years 1998 and 2023 in Saudi Arabia?
Economic Diversification
Economic diversification has been connected to stability and sustainability in economic growth. An economy’s overreliance on natural resource revenues puts at risk that economy’s ability to maintain a certain level of economic growth in the long term, considering the fluctuation of such revenues Afanasyev & Shash [3]; Delechat, Melina, Newiak, Papageorgiou, & Spatafora [4]. Therefore, such an economy is captive to revenues from natural resources and the significant price fluctuations that affect development levels in the country, thus impacting long-term plans to achieve sustainable development Auty [5]; Matallah [6]. Economic diversification influences economic growth, political stability, social development, and institutional quality in the country Busse & Gröning [7]; Matallah [6]; Tsui [8]. In the literature, the concept of “resource curse” refers to the situation that occurs when countries fail to best utilize their natural resource revenues to achieve advanced levels of development and thus remain dependent on their natural resources rather than working towards sustainable development Auty [5]; Emara & El Said [9]; Haber & Menaldo [10]; Jensen & Johnston [11]; Radetzki [12]. On the other hand, economic diversification contributes to job creation and the achievement of sustainable development Haber & Menaldo [10]; Hertog [13]; Moreau & Aligishiev [14]. Furthermore, many studies have indicated that enhancing economic diversification aids in controlling corruption, supports comprehensive and balanced development across regions within a country (i.e., urban development), and promotes the optimal utilization of a nation’s human and natural resources Delechat [4]; Döringer [15]; Rothstein [16]; Treisman [17]; Döringer [15]. According to Jolo, Ari, and Koç [18] “[E]conomic diversification is an essential aspect of sustainable development as diversification enhances macroeconomic stability and promotes structural and long-term transformation not only in the economy but also in other pillars of development such as social institutions and dimensions” (p. 1).
The Economy of Saudi Arabia
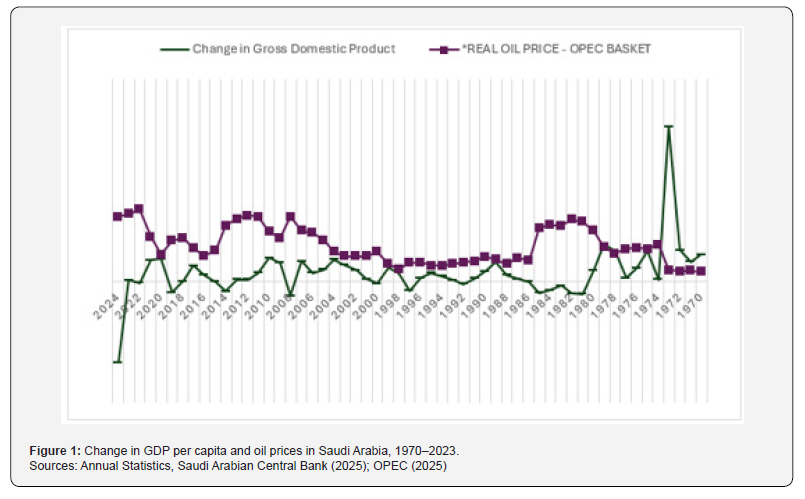
For decades, the Saudi Arabian economy has been based on oil revenues as the main source of national income; thus, economic growth in Saudi Arabia historically has been the result of high oil prices Albassam [19,20]; Sweidan & Elbargathi [21]. Figure 1 illustrates the strong relationship between oil prices and economic growth in 1970–2023, as measured by GDP per capita. During this period, in general, economic growth follows the oil price (note that the effect of changes in oil prices on GDP appears in the following year). Accordingly, one main objective in all government development plans since 1970, as well as in Vision 2030, is to become less dependent on oil as the main source of income (i.e., to achieve economic diversification). The purpose of this goal is to encourage sustainable economic development that is unaffected by changes in the price of oil through empowerment of non-government sectors (i.e., the private sector and not-for-profit sector) (Ministry of Economy and Planning [2]; Vision 2030, 2025 [1]).
The Non-government Sector in Saudi Arabia
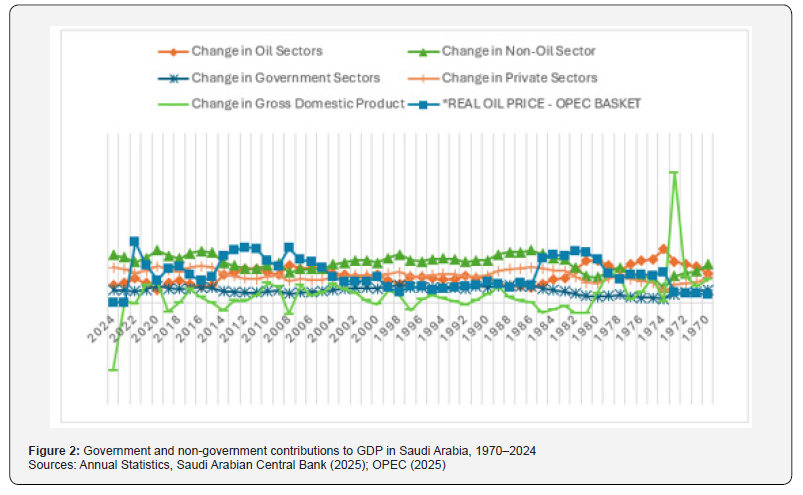
The non-government sector in most developed and developing countries plays a major role in economic diversification and economic growth AbouAssi, & Bowman [22]; Luciani [23]; Sultan & AlTunisi [24]; Winters, Dietrich, & Mahmud [25]; however, this is not the case in Saudi Arabia. The non-profit sector in Saudi Arabia contributes relatively little to the economy compared to other G20 countries (3.3% of GDP, 0.5% of workforce), while the private sector contributes only 40% to the GDP (The National Center for Non-Profit Sector Development - Saudi Arabia [26]). Here, it is important to note that most of the non-government sectors’ projects and contracts depend on projects that are funded by the government Albassam [19]; Sultan & AlTunisi [24]; Wilson [27]. Figure 2 shows that growth in the private sector, oil sector, and non-oil sector is connected to changes in the price of oil and to growth in the government sector. Therefore, the long dependence on oil revenues hinders economic development and growth in the non-oil sector, resulting in a weak role of the private sector as an independent sector and as a contributor to the process of diversifying the economy Emara & El Said [9]; Hertog [13]. To address this, the goals of Vision 2030 include raising the contribution to the economy of the non-profit sector to 5% and for the private sector to reach 65%, as well as to ensure this contribution is sustained and not affected when the price of oil falls (Vision 2030, 2025 [1]).
Mohammed, Xianhui, and Shah [28], in their study of the Saudi economy diversification process, concluded that the Saudi economy has yet to be diversified, asserting that “realizing the inherent potential of the non-oil economy requires major reforms in the labor market, business regulations, and fiscal management” (p. 56232). Similarly, in their study on 14 oil-rich countries (including Saudi Arabia) from 2001–2019, Jolo, Ari, and Koç [18] find that financial development, labor force participation, education, and the rule of law have a significant and positive influence on economic diversification in these countries, while inward foreign direct investment, real GDP growth, and the self-employment rate have a significant but negative impact on economic diversification. According to Jolo et al. [18], countries in the study support “resource-based growth rather than diversification into other technology- and knowledge-based sectors” (p. 1), which influences the process of economic diversification. The Saudi government, through its investment arm of the Public Investment Fund (PIF), owns majority shares (65%–75%) in big companies listed on the stock market, such as Aramco, SABIC, the Saudi Electricity Company, and the National Bank of Saudi Arabia, among others Capital Market Authority (CMA) [29]. These companies represent the supporting force of the government’s plans to diversify the economy, as they hold the major assets and a majority of the workforce in the Saudi economy. Also, these entities are given preferential deals, such as discount fuel prices for their production, exemptions from some regulations that govern the labor market, and other forms of support. The outcomes and revenues of these institutions are described as part of the private sector in government documents and statistics; however, these entities do not represent a purely private sector due to the government support they receive (Capital Market Authority (CMA), [29]; Ministry of Finance [30]; Saudi Arabian Central Bank (SAMA) [31].
Therefore, it could be argued that government spending in Saudi Arabia is the primary driver of activity in the economy (i.e., in the non-government sector, particularly the private sector). For example, mega projects introduced by Vision 2030 such as NEOM, the Red Sea Project, and the expansion of the Two Holy Mosques, as well as small and medium-sized capital projects implemented by the private sector, are funded by government allocations directly or through loans and bunds guaranteed by the government (Ministry of Finance [30]). This is illustrated in Figure 2, which shows that the contributions of both the public and non-government sectors fluctuate in response to changes in oil prices and the performance of the government sector. Given the significant shifts in the energy market, the Saudi government has focused recently on developing sectors other than oil and gas, particularly mining, tourism, and logistics, in an effort to diversify the economy (Vision 2030, [1]). Thus, attracting foreign investors to enhance the private sector’s contribution to GDP requires a good governing system and a healthy economy ecosystem that is diversified and well governed Albassam [32]; Sultan & AlTunisi [24]; Raid, Ahmad, Bagadeem, Alzyadat, & Alhawal [33]; Winters, Dietrich, & Mahmud [25]. In the case of Saudi Arabia, the government’s plan aims to reach 5.7% of GDP (compared to the current 3%) in foreign direct investment (FDI). Sultan & AlTunisi [24] examine FDI in Saudi Arabia within the framework of Vision 2030. They conclude that the Saudi government must work to enhance institutional quality—particularly by improving the quality of investment legislation and protecting intellectual property rights—to achieve the target percentage, especially given the competition from other countries in the MENA region.
Governance and Economic Diversification in Saudi Arabia
The main objective of government is to serve the public and develop strategic plans to best utilize the wealth of the nation (e.g., human capital, natural resources, geographical location). The result of government work influences and impacts beneficiaries, including individuals and non-government agencies (private and not-for-profit). However, an important question is which model is the best fit to reach sustainable development by creating jobs, raising educational outcomes, supporting research and creativity in the economy, and enhancing human well-being. Economic diversification has been introduced as a way of reaching sustainable development and has been extensively studied from an economic perspective, but more studies are needed from the administrative and governance perspective. The Saudi economy is a rentier economy that depends on revenues from natural resources (oil and gas). Therefore, development plans and Vision 2030 focus on how to utilize revenues from natural resources to achieve advanced levels of sustainable development and economic diversification. How to best utilize the revenues from natural resources depends on many factors, including institutional and financial system quality and good governance practices by governments Al‐Hashimi, Weerakkody, Elbanna, & Schwarz [34]; Emara & El Said [9]; Pang, Jin, Zheng, & Tien [35]; Radetzki [12]. Sweidan and Elbargathi’s [21] study on the Saudi economy shows that even though the government spending supports economic diversification, challenges are present due to low institutional quality and competition from other countries in the region; thus, they argue that “strengthening the KSA institutional framework and developing new forms of the social contract are critical to motivating the diversification process” (Sweidan and Elbargathi’s [21], p. 13).
Scholars assert the importance of economic diversification for sustainable economic growth Al‐Hashimi [34]; Afanasyev & Shash [3]. Delechat [4] stated that “economic diversification entails shifting from traditional sectors, like agriculture and mining, to a variety of high-quality services and sectors. This transition is crucial for adapting to global market fluctuations and promoting sustainable growth and improved living standards” (par. 1). Accordingly, many studies highlight the significant role of governance in organizational performance, government effectiveness and efficiencies, the quality of services introduced to the public Battilana, Beckman & Yen [36]; Meier, Prince, & An, 2024), and the efficiency and effectiveness of public spending on education and healthcare Özel, Parrado, & Yildirim [37]. Similarly, many studies on MENA region countries, particularly the oil-rich exporting nations, have concluded that achieving sustainable development is contingent upon achieving advanced levels of economic diversification in developing countries Albassam [19]; Alexeev & Conrad [38]; Bjorvatn, Farzanegan, & Schneider [39]; Busse & Gröning [7]; Matallah [6]; Tsui [8].
A study on the relationship between budget status (e.g., surplus, deficit, balanced) in Switzerland and Norway, two countries that have achieved advanced levels of economic diversification, observed “a lack of empirical evidence and appropriate theoretical generalizations about the existence of a cause-and-effect relationship between economic growth and the type of balance (deficit, surplus, ‘zero-based’) of the state budget”(Afanasyev & Shash [3] p. 84). The study’s findings support the idea that diversified economies are more stable and sustainable than undiversified economies that rely on budget surpluses and increasing public revenues to achieve economic growth. Many studies on the Saudi economy emphasize the importance of focusing on supporting economic activities that create jobs and sectors that have a comparative advantage in the Saudi economy Lashitew, Ross, & Werker [40]; Moreau & Aligishiev, [14]. Moreau and Aligishiev [14] analyse the Saudi National Investment Strategy (NIS), which launched in 2021 as part of Saudi Vision 2030, focusing on enhancing investment in a variety of economic and noneconomic sectors with the goal of diversifying the Saudi economy. The analysis concluded that the success of the strategy requires reforming the labour market from a supply perspective, establishing measurable indicators, enhancing institutional quality in government agencies (as they are responsible for implementation), and actively involving the private sector in the preparation and implementation phases of the plan Moreau & Aligishiev [14].
Meier et al. (2024) argue that good governance in a country influence not only organizations’ performance but also the beneficiaries of services introduced by these organizations. Additionally, having a strong and independent private sector that is not reliant on the support of the Saudi government is an important step toward economic diversification Hertog, 2013; Raid [33]; Raies & Ben Mimoun [41]. Accordingly, non-oil sectors, such as the agriculture and service sectors, must be supported and reregulated to enhance economic diversification. Also, learning from the experiences of similar countries whose national wealth benefited from economic diversification, like Norway (oil), Botswana (diamonds), and Chile (copper) can aid in developing an appropriate and measurable economic diversification plan Delechat [4]; Emara & El Said [9]; Matallah [6]; Döringer [15].
Methodology
Governance refers to a multidimensional set of principles, including accountability and equity as well as the exercise of legitimate authority through regulation, standards, targets, and processes for ensuring accountability and managing risk Kaufmann & Kraay [42]. The perceived quality of governance, aggregated for 215 economies over the time period of 1996 to 2023 by the World Bank [23], is defined by the six dimensions shown in Table 1. These six World Governance Indicators (WGIs) are Voice and Accountability (VA), Political Stability and Absence of Violence/Terrorism (PV), Government Effectiveness (GE), Regulatory Quality (RQ), Rule of Law (RL), and Control of Corruption (CC) Worldwide Governance Indicators [43]. Economic complexity refers to “the meeting point of different disciplines such as international trade, development economics and evolutionary economic geography”; however, “the drivers of economic complexity are under-investigated” (Antonietti [44] p. 1). Economic diversification is a “multidimensional approach to economic complexity that combines data on the geography of exports by product, patents by technology, and scientific publications by field of research” (Stojkoski [45] p. 1). The current paper studies the degree to which changes in the dimensions of governance may predict changes in economic diversification in the Saudi Arabian economy.
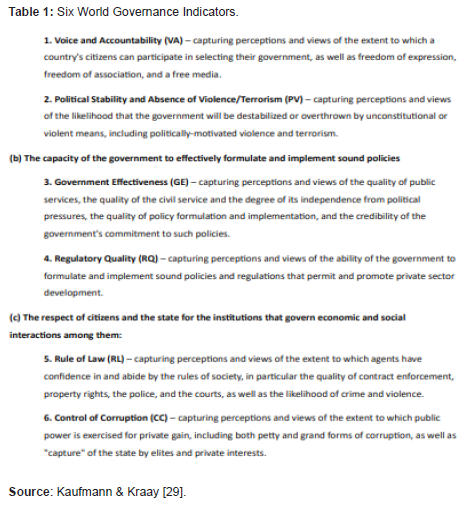
Each of the six indicators in the worldwide governance index impacts the government’s overall performance. For example, voice and accountability and control of corruption are essential for ensuring that laws and regulations are applied equally among individuals. Furthermore, the quality of government work can only be achieved by clearly defining accountability for each task and for every agency responsible for performing each task. Numerous studies have concluded that a country’s poor performance in one governance indicator directly translates to a lower ranking in the overall governance index Albassam [20]; Emara & El Said [9]; Kaufmann & Kraay [42]; Nabi & Suliman [46]; Raies & Ben Mimoun [41]; Wilson [27]. Thus, using an aggregate governance index rather than analyzing each indicator separately did not impact the outcome of the study. The use of an aggregate index of the six governance dimensions is thus used to maximize the value of the results and analysis of the current study, taking into account the study’s objective, the methodology used, and statistical limitations arising from the use of a general linear mixed model (GLMM).
Research Question
The question guiding this research, based on the PICOT mnemonic (P = Population, I = Intervention; C = Comparison; O = Outcome; T = Time; Alvesson & Sandberg [47] is as follows: In Saudi Arabia (P), to what degree did the annual changes in the dimensions of governance (I) predict the annual changes (C) in economic diversification (O) between the years 1998 and 2023 (T)?
Data Collection
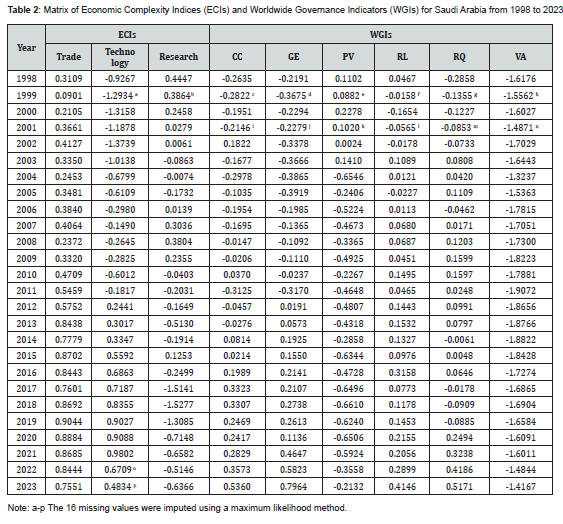
This study uses a purposive sample method. Data on the six dimensions of governance (WGIs) for Saudi Arabia Kaufmann & Kraay [42]; see Table 1, for a total of 26 years (1998–2023 inclusive) were extracted from the World Bank [43] website (https://www.worldbank.org/en/publication/worldwide-governance-indicators). A purposive sample of the three dimensions of economic complexity (ECI), measuring annual changes in the economic diversification in Saudi Arabia during the same time period, was extracted from the Observatory of Economic Complexity website (https://oec.world/en/rankings/eci/hs6/hs96?tab=ranking). Table 2 presents the complete data matrix. The WGIs and ECIs were measured using Z-scores, which facilitated meta-analysis by transforming the diverse units used to record econometric data from different sources with dissimilar frequency distributions into a common scale Moreno [48].
PLS-SEM
The PICOT question was addressed using partial least squares structural equation modeling (PLS-SEM) with SmartPLS software (https://www.smartpls.com). PLS-SEM “has established itself as a critical statistical method in economics, econometrics, and finance. It stands out for its effectiveness in handling non-normal data and modelling complex relationships between latent constructs” (Valls Martinez [49] p. 119). The two-step modeling procedure involved the validation of the measurement model followed by the assessment of the structural model Hair [50]. The validation process required the construction of a path diagram to define the two latent constructs (i.e., governance and economic diversification and the use of composite factor analysis to test the model for construct validity). The standardized path coefficient (β ± 95% CI) was estimated by bootstrapping with 5000 random sub-samples. The bootstrap approach was used because “it is a superior statistical method for the comparison of non-normal data with differing variances” Johnston & Faulkner [51] p. 23.
Power Analysis and Imputation of Missing Values
If the sample size is too small, then a statistical model may be meaningless Rahman [52]. The minimum sample size to provide adequate power (80%) to estimate the path coefficient (β) between two constructs (here, governance and economic diversification) using PLS-SEM Hair [50] is at least 52 if the effect size is small (R2 = .25); at least 33 if the effect size is moderate (R2 = .50); and at least 26 if the effect size is large (R2 = .75). The observed sample size for the Saudi Arabian governance and economic diversification data for the 26 years between 1998 and 2023 was not 26; it was reduced to 22 due to the presence of 16 missing values in 1999, 2001, 2022, and 2023 (see Table 1). However, the sample size was returned to 26 through multiple imputation of the 16 missing values using a maximum likelihood method based on multiple linear regression analysis with Trade as the predictor Lin & Tsai [53]. This method has been deemed effective by prior work: “Using multiple imputation thus approximates what results would look like with complete observations while allowing for representation of uncertainty in the results and maximizing the data set’s statistical power” Woods [54], para. 1.
Interpretation of Results
The PLS-SEM results were not interpreted by applying the classical Fisher and Neyman-Pearson theories of statistical inference regarding “significance” or “nonsignificance,” because the value of statistical inference based solely on p-values is a “myth” (Acree [55] p. 1). Consequently, the PICOT question above was answered by the effect size, defined as “a quantitative reflection of the magnitude of some phenomenon that is used for the purpose of addressing a question of interest” (Runge [56], p. 487). Significantly, “Effect-size methodology is barely out of its infancy and yet the effect size has already been proclaimed as the statistical coin of the realm for the 21st century” Sawilowsky [57]. The effect size was indicated by the coefficient of determination (R²) representing the proportion of variance in the six dimensions of governance, and explained the variance in the three dimensions of economic diversification. The interpretation of R2 using PLS-SEM was as follows: < 0.19 = very weak; 0.19 to 0.32 = weak; 0.33 to 0.66 = moderate; ≥ .67 = substantial Hair [50]. The smallest effect size to determine practical significance (i.e., if R2 was meaningful in the real world) must be specified Jané [58]. Here, a substantial point estimate of R2 > 75%, within an upper and lower 95% confidence interval between 50% and 100 %, was assumed to be the minimum effect size predicting that the annual changes in the dimensions of Saudi Arabian governance were very strong predictors of economic diversification between 1998 and 2023.
Checking Assumptions
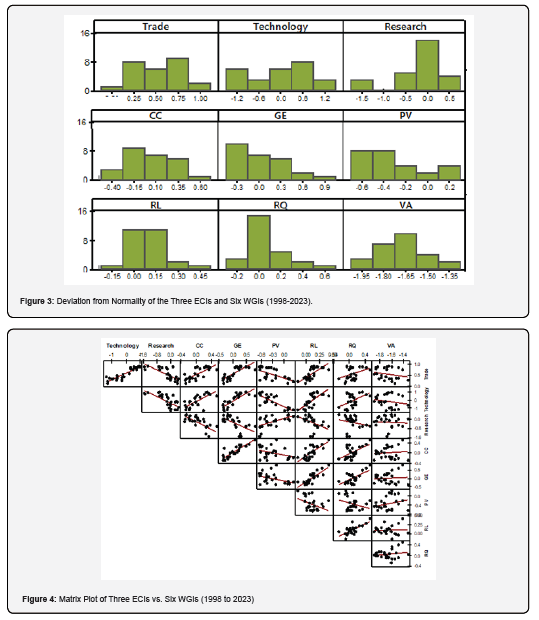
The asymmetrical frequency distributions of the five WGIs and the three ECIs displayed in Figure 3 were not normally distributed due to skewness and kurtosis. However, deviation from normality should not compromise the results of PLS-SEM so long as the deviation was not caused by extreme outliers or abnormal values Hair [50]. The distributions of the Z-scores in Table 1 were well within the expected normal limits (± 3.0), implying the absence of outliers Merza & Mohammed [59]. Multicollinearity (i.e., linear relationships between the predictor variables) causes inflation of the variances of the coefficients, compromises the statistical inferences, and weakens the power of multivariate models to identify meaningful effects Oke [60]; Shrestha [61]. The variance inflation factor (VIF) reflects multicollinearity; however, “one issue with VIF is that it is often interpreted using arbitrary rules of thumb” Shatz [62] p. 838. The VIF is not reported here because “No valid logical basis exists for using VIF thresholds to reject the possibility of multicollinearity” Kalnins [63], p. 58. Visual examination of the matrix plot in Figure 4 fitted with linear regression lines reflected a high level of multicollinearity within and between the WGIs and the ECIs. This implies that the six inter-correlated WGIs were not independent or uncorrelated predictors of the three inter-correlated ECIs. Multicollinearity violates the theoretical assumption that the predictors in PLS-SEM must not be related to each other Hair [50]. Consequently, the inter-correlated Z-scores were aggregated by composite factor analysis to operationalize one predictor construct (governance) with six indicators (VA, PV, GE, RQ, RL, CC) and one outcome construct (economic diversification) with three indicators (Trade, Technology, Research).
Descriptive Statistics
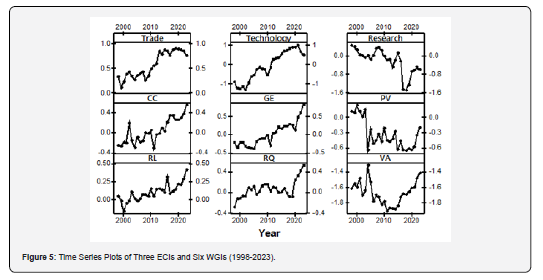
Figure 3 displays time-series plots of the fluctuations in the three ECIs and six WGIs every year from 1998 to 2023. Descriptive statistics (e.g., mean and standard deviation) were not appropriate to summarize the time-series of Z-scores because (1) the frequency distribution of the scores deviated from normality (see Figure 3), and (2) the scores collected over discrete time intervals are not genuine independent random replicates; rather, they are pseudo-replicates, which are closely interrelated. The analysis of pseudo-replicated data using methods designed for genuine replicated data may generate false statistics Jordan [64]; Lazic [65]. The changes in the three ECIs overtime, displayed in Figure 3, were non-linear. The Z-scores for Trade increased from 1998 (0.1309) to 2012 (0.5752) and then remained relatively constant from 2013 (0.8438) to 2023 (0.7551). Technology increased from 1998 (-0.9267) to 2021 (0.9802) and then declined between 2022 (0.6709) and 2023 (0.4834). Research was the only ECI that declined from a positive value (0.4447) in 1998 to a negative value (-1.5277) in 2018; however, it subsequently recovered (increased) until 2022 (-0.5146).
The fluctuations in the six WGIs over time were also non-linear. Crime and Corruption increased from a minimum (-0.2635) in 1998 to a maximum (0.5360) in 2023. Government Effectiveness similarly increased from a minimum in 1999 (-0.2822) to reach a maximum in 2023 (0.7964). Political Stability/Absence of Violence declined between 1998 (0.1102) and 2020 (-0.6506) but then increased until 2023 (-0.2132). Rule of Law improved steadily from 2000 (-0.1654) to 2023 (0.4146). Regulatory Quality improved from negative in 1998 (-0.2858) to positive in 2023 (0.4146). Voice and Accountability displayed an unusual time-series plot that declined from its highest score in 2002 (-1.7029) to its lowest score in 2011 (-1.9072), then rapidly improved until 2023 (-1.4167).
Validation of the Structural Model
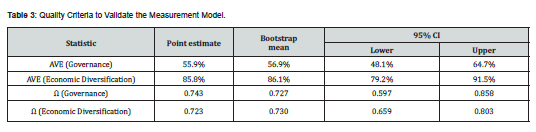
An exact copy of the path diagram output by SmartPLS is displayed in Figure 3. The quality criteria listed in Table 2 confirm the validity of the structural model based on the threshold values recommended by Hair [50]. The AVEs (average variance explained ± bootstrap 95% CI) were > 50%. The composite reliability coefficients (Ω ± 95% CI) exceeded the lower limit of 0.6 required to establish internal consistency reliability. The values of Cronbach’s α computed by SmartPLS are biased estimates of reliability, which “have very limited usefulness” Sijtsma & Pfadt [66], and thus are not reported. The values of the factor loading (λ) coefficients are displayed within the arrows flowing into the nine reflective indices (rectangular symbols) out of the two constructs (round symbols) in Figure 5. With one exception, these values were strong (0.632 to .927), confirming the construct validity of the model. The exception was in Voice and Accountability λ (-0.025), and it arose because the trajectory of VA over time was non-linear (see Figure 5); hence, VA was not linearly related to the other indices of governance. The positive λ coefficients for CC (0.885), GE (0.927), RL (0.889), and RQ (0.720) reflected that these four governance dimensions all increased over time between 1998 and 2023, whereas the negative coefficient for PV (-0.632) indicated that Political Stability/Absence of Violence declined during the same time period (see Figure 5). The positive λ coefficients for Technology (0.954) and Trade (0.961) reflected the improvements between 1998 and 2023 displayed in Figure 5, whereas the negative coefficient for Research (-0.861) was caused by the decline in research activities during the same time period (see Figure 5).
Evaluation of the Structural Model
The point estimate of the path coefficient between Governance and Economic Diversification in the PLS-SEM path diagram in Figure 5 & Table 3 (λ = 0.870), with narrow bootstrap 95% CI (80.9% and 93.7%), reflects the strength of the predictive relationship between Governance and Economic Diversification. Applying the threshold criteria proposed by Hair [50], where ≥ .67 = substantial, the coefficient of determination (R2 = 75.7%) with narrow bootstrap 95% CI (65.5%, 87.8%) reflects a substantial effect size.
Discussion and Analysis
Practically significant results were obtained to address the PICOT question using a reliable model constructed with PLS-SEM based on secondary data. In Saudi Arabia, the annual changes in the six dimensions of governance predicted the annual changes in the three dimensions of economic diversification between the years 1998 and 2023 to a substantial degree. The positive λ coefficients for CC (0.885), GE (0.927), RL (0.889), and RQ (0.720) reflected that these four governance dimensions all increased over time between 1998 and 2023, whereas the negative coefficient for PV (-0.632) indicated that Political Stability/Absence of Violence declined during the same time period (see Figure 6). The positive λ coefficients for Technology (0.954) and Trade (0.961) reflected improvements between 1998 and 2023, whereas the negative coefficient for Research (0.861) was caused by the decline in research activities during the same time period (see Figure 6).
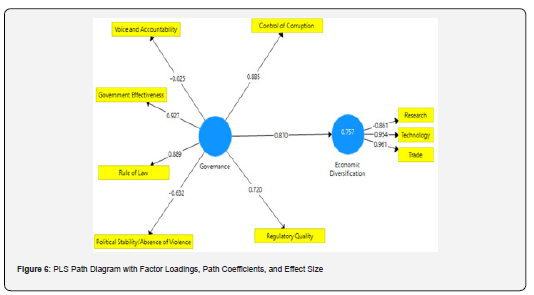
The point estimate of the path coefficient between Governance → Economic Diversification in the PLS-SEM path diagram in Figure 6 & Table 3 (λ = 0.870) with narrow bootstrap 95% CI (80.9% and 93.7%) reflects the strength of the predictive relationship between Governance and Economic Diversification. Applying the threshold criteria proposed by Hair [50] where ≥ .67 = substantial, the coefficient of determination (R2 = 75.7%) with narrow bootstrap 95% CI (65.5%, 87.8%) reflects a substantial effect size. Research and case studies on developed and developing countries that rank high in economic diversification indices have shown that good governance is a predictor of economic diversification Albassam [20]; Antonietti [44]; Cárdenas, García, & Salas, 2018; Delechat, Melina, Newiak, Papageorgiou, & Spatafora [4]; Emara, & El Said [9]; Ferraz, Moralles, Campoli, Oliveira, & Rebelatto, 2018; Matallah [6]; Rothstein [16]; Shih, Sun, & Wang [67]; Wang [68]. It is clear that research activity, as one of the Economic Diversification dimensions in decline during the period from 1996–2023, has an influence on the economic diversification process in Saudi Arabia. Research contributes to copyrights, knowledge management system quality, knowledge transfer, and enhancing industrial and service sector output Albassam [69]. On the other hand, the Voice and Accountability (VA) indicator has not shown a significant impact in predicting economic diversification. This might be explained by the political system in Saudi Arabia, where government sector has the upper hand in supporting and regulating economic development and growth in the country (Table 4).

Additionally, supporting the participation of non-government (private and non-profit) sectors in the process of economic growth and sustainability will contribute to enhancing government performance in WGIs and reaching the level of sustainable development intended by the government. It is also important to focus on adopting indicators to measure the results and impact of public programs and projects, rather than focusing solely on outputs Albassam [32]; Sultan & AlTunisi [24]. Furthermore, enhancing the participation of individuals and non-governmental sectors in monitoring the implementation of public programs and projects supports program implementation and strengthens the oversight role of civil society agencies in Saudi Arabia [70].
Conclusion
In the Saudi Arabian economy, the annual changes in the six dimensions of governance predicted the annual changes in the three dimensions of economic diversification between the years 1998 and 2023. It should be noted that the current paper uses an aggregate governance index rather than analyzing each indicator separately, but this potential limitation did not impact the outcome of the study. From the theoretical and statistical results, we can see that during the studied period, four of the Worldwide Governance Indicators (WGIs)—Control of Corruption (CC), Government Effectiveness (GE), Rule of Law (RL), and Regulatory Quality (RQ)—positively and significantly predict Economic Diversification (EC), while Political Stability/Absence of Violence (PS) is a negative predictor; and Voice and Accountability (VA) has no significant impact. Among the Economic Diversification (EC) dimensions, Trade and Technology were positively predicted by WGIs, while the Research dimension was negative during the period.
From a public policy perspective, Saudi Arabia have taken a series of steps toward economic sustainability by supporting economic diversification in the economy. Launching Vision 2030, issuing strategies for investment to attract international investors, and adopting regulations such as copyright and tax laws are steps in the right direction; however, further action is needed to ensure a long-term positive impact on the economy. One of the main pillars for reaching sustainable development is enhancing institutional quality, with all governance dimensions collectively and simultaneously enhanced, since each one supports the others. Moreover, supporting good governance should result in enhanced public and private sector participation in the economy as part of the Vision 2030 goals. In addition, the analysis shows that the government should pay special attention to supporting research activities and enhancing non-government sectors’ participation in the economic diversification process (planning, regulation, and implementation). The government should also consider adopting meaningful tools to improve voice and accountability in the economy, such as setting outcome indicators rather than concentrating on output indicators. The government should encourage effective engagement from the private sector and watchdog institutions in monitoring and controlling the execution of public projects and programs. Despite the Saudi government’s focus on strengthening governance, the road ahead is long and requires alignment with the nature of the Saudi economy, considering global trends in post-oil economies and competition from other countries in the region. These topics offer valuable avenues for future research to explore.
References
- Vision 2030 (2025) Overview.
- Ministry of Economy and Planning (MoEP) (2014) The First Development Plan pp. 1970-1975.
- Afanasyev M, Shash N (2020) Budget Surplus Managment and Fiscal Fine Tuning. Public administration 6: 84-97.
- Delechat MCC, Melina MG, Newiak MM, Papageorgiou MC, Spatafora MN (2024) Economic Diversification in Developing Countries: Lessons from Country Experiences with Broad-Based and Industrial Policies. International Monetary Fund. Departmental Papers.
- Auty R (1993) Sustaining Development in Mineral Economies: The Resource Curse Thesis. New York, NY: Routledge.
- Matallah S (2020) Economic diversification in MENA oil exporters: Understanding the role of governance. Resources Policy 66: 101602.
- Busse M, Gröning S (2011) The Resource Curse Revisited: Governance and Natural Resources. Public Choice 154(1): 1-20.
- Tsui K (2010) More Oil, Less Democracy: Evidence from Worldwide Crude Oil Discoveries. The Economic Journal 121(551): 89-115.
- Emara N, El Said A (2021) Financial inclusion and economic growth: The role of governance in selected MENA countries. International Review of Economics & Finance 75: 34-54.
- Haber S, Menaldo V (2011) Do Natural Resources Fuel Authoritarianism? A Reappraisal of the Resource Curse. American Political Science Review 105(1): 1-26.
- Jensen M, Johnston N (2011) Political Risk, Reputation, and the Resource Curse. Comparative Political Studies 44(6): 662-688.
- Radetzki M (2012) Politics not OPEC Interventions Explain Oil's Extraordinary Price History. Energy policy 46: 382-385.
- Hertog S (2010) Defying the Resource Curse: Explaining Successful State-Owned Enterprises States. World Politics 62(2): 261-301.
- Moreau F, Aligishiev Z (2024) Diversification in Sight? A macroeconomic assessment of Saudi Arabia’s vision 2030. International Economics 180: 100538.
- Döringer S (2020) Governance entrepreneurship in regional economic development: individual agency in Austria. Regional Studies, Regional Science 7(1): 550–567.
- Rothstein B (2024) The quality of government: Corruption, social trust, and inequality in international perspective. University of Chicago Press.
- Treisman D (2000) The Causes of Corruption: A Cross-National Study. Journal of Public Economics 76(3): 399-457.
- Jolo AM, Ari I, Koç M (2022) Driving factors of economic diversification in resource-rich countries via panel data evidence. Sustainability 14(5): 2797.
- Albassam BA (2015) Economic diversification in Saudi Arabia: Myth or reality. Resources Policy 44: 112-117.
- Albassam BA (2022) Government spending and economic growth in the Middle East and North Africa region. International Review of Administrative Sciences 88(4): 1124-1140.
- Sweidan OD, Elbargathi K (2023) Economic diversification in Saudi Arabia: Comparing the impact of oil prices, geopolitical risk, and government expenditures. International Economics 175: 13-24.
- AbouAssi K, Bowman AOM (2018) Toward a conditional analysis of NGO-local government relations in developing countries. Perspectives on Public Management and Governance 1(3): 222-235.
- Luciani G (2006) From Private Sector to National Bourgeoisie: Saudi Arabian Business. In Aarts, P. and Nonneman, G. (2006). Saudi Arabia in the Balance: Political Economy, Society, Foreign Affairs. Ney York, NY: NYU Press pp. 144-181.
- Sultan B, AlTunisi M (2025) Sustaining Foreign Direct Investment in Saudi Arabia: An Analysis of Investment Protection Frameworks and Their Impact on Economic Growth Within Vision 2030. Sustainability 17(19): 2071-1050.
- Winters MS, Dietrich S, Mahmud M (2017) Perceptions of foreign aid project quality in Bangladesh. Research & Politics 4(4).
- The National Center for Non-Profit Sector Development. (2025) National Center for Non-Profit Sector Showcases 2024 Achievements in Saudi Vision 2030 Report.
- Wilson R (2021) Economic Development in the Middle East (3rd). Routledge.
- Mohammed NAA, Xianhui G, Shah SAA (2021) Non-oil economic transition for economic and environmental sustainability in Saudi Arabia: a multi-factor analysis under fuzzy environment. Environmental Science and Pollution Research 28(40): 56219-56233.
- Capital Market Authority (CMA) (2025) Reports and Statistical Bulletins.
- Ministry of Finance (2025) Budget.
- Saudi Arabian Central Bank (SAMA) (2025) Statistical Report.
- Albassam BA (2026) Sustainable Development from a Governance Perspective. Sustainability 18(2): 1121.
- Raid M, Ahmad N, Bagadeem SA, Alzyadat J, Alhawal H (2024) The non-oil institutional sectors and economic growth in Saudi Arabia. Cogent Economics & Finance 12(1): 2300819.
- Al‐Hashimi K, Weerakkody V, Elbanna S, Schwarz G (2022) Strategic decision making and implementation in public organizations in the gulf cooperation council: The role of procedural rationality. Public Administration Review 82(5): 905-919.
- Pang D, Jin X, Zheng K, Tien NH (2024) A road toward green growth: Optimizing the role of mineral resources, fintech innovation and effective governance in G-20 economies. Resources Policy 92: 104983.
- Battilana J, Beckman CM, Yen J (2025) On Democratic Organizing and Organization Theory. Administrative Science Quarterly 70(2): 297-327.
- Özel ID, Parrado S, Yildirim K (2025) When trade-offs touch self-interests: attitudes on education spending in a cross-country analysis. Journal of Social Policy p. 1–20.
- Alexeev M, Conrad R (2009) The Elusive Curse of Oil. The Review of Economics and Statistics 91(3): 586–598.
- Bjorvatn K, Farzanegan M, Schneider F (2012) Resource Curse and Power Balance: Evidence from Oil-Rich Countries. World Development 40(7): 1308-1316.
- Lashitew AA, Ross ML, Werker E (2021) What drives successful economic diversification in resource-rich countries? The World Bank Research Observer 36(2): 164-196.
- Raies A, Ben Mimoun M (2025) Augmented Okun’s Law: Does Institutional Quality Shape the Unemployment-Growth Relationship? Insights From Developing and Emerging Economies. Administration & Society 57(7): 915-941.
- Kaufmann D, Kraay A (2024) The worldwide governance indicators: Methodology and 2024 update. World Bank Policy Research Working Paper pp. 152.
- World Bank (2025) The Worldwide Governance Indicators: Methodology and 2024 Update (English).
- Antonietti R (2024) Economic Complexity. In: Jodhka, S.S., Rehbein, B. (eds.) Global Handbook of Inequality. Cham: Springer.
- Stojkoski V, Koch P, Hidalgo CA (2023) Multidimensional economic complexity and inclusive green growth. Communications Earth & Environment 4(1): 130.
- Nabi MS, Suliman MO (2009) Institutions, banking development, and economic growth. The Developing Economies 47(4): 436-457.
- Alvesson M, Sandberg J (2024) Constructing research questions: Doing interesting research. Thousand Oaks, CA: Sage.
- Moreno I, Parrado-Martínez P, Trujillo-Ponce A (2022) Using the Z-score to analyze the financial soundness of insurance firms. European Journal of Management and Business Economics 31(1): 22-39.
- Valls Martínez M, Santos-Jaén JM, León-Gómez A, Amin Fu (2025) A new-generation statistical data analysis technique: partial least structural equation modeling (PLS-SEM) application in economics, econometrics and finance. In: Cruz Rambaud, S., Trinidad Segovia, J.E., García-García, C.B. (eds) Advances in Quantitative Methods for Economics and Business. Cham: Springer.
- Hair JF, Hult GTM, Ringle CM, Sarstedt M (2022) A primer on partial least squares structural equation modeling (PLS-SEM) (3rd) Thousand Oaks, CA: Sage.
- Johnston MG, Faulkner C (2021) A bootstrap approach is a superior statistical method for the comparison of non-normal data with differing variances. The New Phytologist 230(1): 23-26.
- Rahman MM (2023) Sample size determination for survey research and non-probability sampling techniques: A review and set of recommendations. Journal of Entrepreneurship, Business and Economics 11(1): 42-62.
- Lin WC, Tsai CF (2020) Missing value imputation: A review and analysis of the literature (2006–2017). Artificial Intelligence Review 53: 1487-1509.
- Woods AD, Gerasimova D, Van Dusen B, Nissen J, Bainter S, et al. (2024) Best practices for addressing missing data through multiple imputation. Infant and Child Development 33(1): e2407.
- Acree MC (2021) The Fisher and Neyman-Pearson theories of statistical inference. In: The Myth of Statistical Inference. Springer: Cham.
- Runge J, Gerhardus A, Varando G, Eyring V, Camps-Valls G (2023) Causal inference for time series. Nature Reviews Earth & Environment 4(7): 487-505.
- Sawilowsky S, Sawilowsky J, Grissom RJ (2025) Effect size. In: Lovric, M. (eds) International Encyclopedia of Statistical Science. Springer, Berlin, Heidelberg.
- Jané MB, Xiao Q, Yeung SK, Ben-Shachar MS, Caldwell AR, et al. (2024) Guide to effect sizes and confidence intervals. Collaborative Quarto Book.
- Merza EO, Mohammed NJ (2021) Fast ways to detect outliers. Journal of Techniques 3(1): 66-73.
- Oke J, Akinkunmi WB, Etebefia SO (2019) Use of correlation, tolerance and variance inflation factor for multicollinearity test. Global Scientific Journals 7(5): 652-659.
- Shrestha N (2020) Detecting multicollinearity in regression analysis. American Journal of Applied Mathematics and Statistics 8(2): 39-42.
- Shatz I (2024) Assumption-checking rather than (just) testing: The importance of visualization and effect size in statistical diagnostics. Behavior Research Methods 56(2): 826-845.
- Kalnins A, Praitis Hill K (2025) The VIF score. What is it good for? Absolutely nothing. Organizational Research Methods 28(1): 58-75.
- Jordan CY (2018) Population sampling affects pseudoreplication. PLoS Biol 16(10): e2007054.
- Lazic SE (2022) Genuine replication and pseudoreplication. Nature Reviews Methods Primers 2(1): 23.
- Sijtsma K, Pfadt JM (2021) Part II: On the use, the misuse, and the very limited usefulness of Cronbach’s alpha: Discussing lower bounds and correlated errors. Psychometrika 86(4): 843-860.
- Shih M, Sun M, Wang G (2012) The Historical Institutionalism Analysis of Taiwan’s Administrative Reform. International Review of Administrative Sciences 78(2): 305-327.
- Wang D (2014) Activating Cross-border Brokerage: Interorganizational Knowledge Transfer through Skilled Return Migration. Administrative Science Quarterly 60(1): 133-176.
- Albassam BA (2021) Achieving sustainable development by enhancing the quality of institutions in Saudi Arabia. International Sociology 36(3): 439-463.
- Organization of the Petroleum Exporting Countries (OPEC) (2025) OPEC Basket Prices.

























