


Optimal Location of UPFC and Voltage Stability Analysis in IEEE- 14 Bus Network using CPF Technique and PSAT Software
Bedel Giscard Onana Essama1*, Jacquie Therese Ngo Bisse2, Joseph Koko Koko3, Jacques Atangana4, Salomé Ndjakomo Essiane5 and Jean Gaston Tamba6
1,2,3,5Laboratory of Electrotechnics, Automatics and Energy, Department of Electrical Engineering, Higher Technical Teachers, Training College (ENSET) of Ebolowa, University of Ebolowa, P.O. Box 886 Ebolowa, Cameroon
1,6Higher Institute of Transport, Logistics and Commerce (ESTLC) of Ambam, University of Ebolowa, P.O. Box 22 Ambam, Cameroon
1,2,5Cameroonian Association for Research and Innovation in Environmental and Energetic Technologies (ACRITEE), P.O. Box 59 Ebolowa, Cameroon.
4Higher Teacher Training College of Yaounde, University of Yaounde I, P.O. Box 47 Yaounde, Cameroon
Submission: February 02, 2024; Published: February 20, 2024
*Corresponding author: Onana Essama Bedel G, Laboratory of Electrotechnics, Automatics and Energy, Department of Electrical Engineering, Higher Technical Teachers, Training College (HTTTC) of Ebolowa, University of Ebolowa, P.O. Box 886 Ebolowa, Cameroon Email: onanaessama@yahoo.fr
How to cite this article: Bedel Giscard Onana Essama*, Jacquie Therese Ngo Bisse, Joseph Koko Koko, Jacques Atangana, Salomé Ndjakomo Essiane and Jean Gaston Tamba. Optimal Location of UPFC and Voltage Stability Analysis in IEEE- 14 Bus Network using CPF Technique and PSAT Software. Robot Autom Eng J. 2024; 5(5): 555674. DOI: 10.19080/RAEJ.2024.05.555674
Abstract
We analyze the stability of IEEE -14 Bus (Institute of Electrical and Electronic Engineers) network using Flexible Alternating Current Transmissions Systems (FACTS) specially the Unified power flow controller (UPFC). Using the Newton-Raphson method and continuation power flow (CPF) technique associated to power system analysis toolbox (PSAT) software the network is analyzed without UPFC and with UPFC. Some results are presented such as the representation of 14 busbars network, power flow results, voltage profiles, active and reactive power losses, percentage of voltage variation, loading parameters and stability indices for UPFC locations. Thereafter, we also present comparative study including Static VAR compensator (SVC) and UPFC locations and stability margins for SVC and UPFC.
Keywords: FACTS; UPFC; SVC; CPF technique; Stability analysis
Abbreviation: FACTS: Flexible Alternating Current Transmissions Systems; UPFC: Unified Power Flow Controller; CPF: Continuation Power Flow; PSAT: Power System Analysis Toolbox; SVC: Static VAR Compensator; TCSC: Thyristor-Controlled Series Capacitor; SSSC: Static Synchronous Series Compensator; TCSR: Thyristor-Controlled Series Reactor; HPFC: Hybrid Power Flow Controller
Introduction
The devices that allow AC transmission system parameters to optimize transmission grid and power transfer capacity have been introduced for the first time in the 1990’s [1,2]. Those devices are called Flexible AC Transmissions Systems (FACTS). They are specially used to resolve power system problems such as the reduction of transmission congestion [2]. The classification of those FACTS devices leads to three groups known as series, shunt and hybrid compensators. Shunt compensators include for example static var compensator (SVC) and static compensator (STATCOM) [3-5]. Series compensators contain for example thyristor-controlled series capacitor (TCSC), static synchronous series compensator (SSSC) and thyristor-controlled series reactor (TCSR) [3-5]. Hybrid (series-shunt) compensators concern for example unified power flow controller (UPFC), hybrid power flow controller (HPFC) and optimal unified power flow controller (OUPFC) [3-5].
However, the problem of FACTS locations remains serious. Consequently, some methods have been developed able to allow an easy location of such devices. Those methods which can be called FACTS location techniques employing power system optimization methods. In general, FACTS can solve several problems in power systems. So, we classify those problems in two groups known as steady state and transient stability problems. The steady state problems appear in power system into several aspects known as voltage control, transmission line overloads reduction and power system optimization, decrease congestions and re-dispatching of generators, contingency analysis and cost minimization [6,7]. The problem of voltage control concerns optimization of bus voltage values which consider the stability of power system voltages. The problem of power system optimization refers to power system optimal power flow investigations. Moreover, cost minimization concerns the problem of decrease of the cost of power transmission or FACTS device cost optimization [6,7]. The second classification concerns transient stability problems where the performances of power system are improved by FACTS under some conditions. This second classification presents two categories of problems those linked to voltage stability and those related to angle stability. According to voltage stability and voltage collapse, this aspect concerns the determination of weakest bus of power system [8]. Concerning angle stability and power oscillations, this aspect concerns the minimization and the damping of power oscillations.
According to all the problems above mentioned that occur in power systems, we can propose some optimization methods related to optimal locations of FACTS devices. The classification presents four categories of those methods known as classical optimization methods, technical criteria-based methods, heuristic and meta-heuristic methods, and simulation-based methods [9]. Classical optimization methods concern system modeling by mathematical equations that are solved by some technique of programming [10-12]. Technical criteria-based methods employed a technical criterion coming from steady state investigations or transient analysis [7]. Heuristic and metaheuristic methods concern computational methods that improve the objective function coming from an equation system [13,14]. Simulation based methods employ simulation tools such as PSAT, MATLAB, continuous power flow simulations and time domain simulation methods [15,16]. This paper is devoted to the analysis of the static voltage stability of IEEE 14-Bus test power system using the CPF (continuation power flow) technique. We use UPFC to stabilize the voltage of the network. This analysis is done with software called power system analysis toolbox (PSAT). The paper is organized as follows. In Sect 5, we present the methodology and the network elements modeling where a mathematical development related to Newton - Raphson is presented. The analysis of the system uses this mathematical development associated with CPF technique and PSAT software. In Sect 6, we analyze the IEEE 14-Bus network without and with UPFC. We present some interesting results including the network voltage profile, stability indices of UPFC and SVC locations, comparison of different stability margins for SVC and UPFC, load factor with and without UPFC, PV characteristics of the network, power flow results at initial state and with UPFC. In Sect. 7, we conclude.
Methodology and network elements modeling
Newton-Raphson method
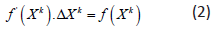
This method is based on the Taylor series expansion. This last technique is obtained successively from first-order approximations [17]. In fact, among the many methods available for power flow analysis, the Newton-Raphson method is the most refined and important method. It is not the simplest than the Gauss Seidel method, but it is the fastest, especially for large networks [18]. It is described by the following equations:

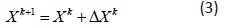
where  is the Jacobean of f(x). From an initial value x0,
we obtain the corrections Δxk by solving the linear system:
is the Jacobean of f(x). From an initial value x0,
we obtain the corrections Δxk by solving the linear system:
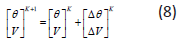
In the network, we correct the angle and the modulus of the voltage which are given by the two equations:
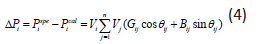
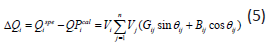
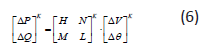
Using Eqs. (4) and (5) and dividing the Jacobean into submatrices, we apply to obtain the following matrix system:
The variable ΔV can be divided by V:
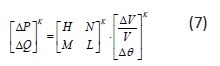
And Eq. (7) is transformed into the following matrix system:
With:
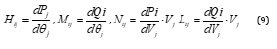
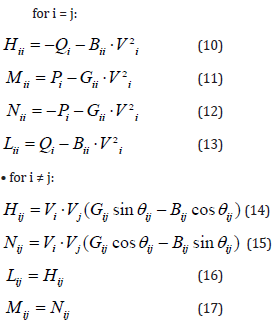
The Jacobean matrix exhibits the following elements:
for i = j:
For each iteration, we calculate  ,
by solving Eq. (7).
The process will stop for| ΔP |≤ε et | ΔQ |≤ε [18]. Because of the
quadratic convergence of this method, a high-precision solution
can be obtained in just a few moments. It therefore significantly
simplifies power flow calculations [19]. From the above, i, order
to analyze the electrical network, it is necessary to calculate
the power flow, the calculation of which must go through the
resolution of the nonlinear equations, where the recourse to
numerical methods is inevitable. Some methods are studied, and
we conclude that the Newton-Raphson method has enormous
advantages compared to the other methods, it is for this reason
that we will use it in the part of the power flow calculation.
,
by solving Eq. (7).
The process will stop for| ΔP |≤ε et | ΔQ |≤ε [18]. Because of the
quadratic convergence of this method, a high-precision solution
can be obtained in just a few moments. It therefore significantly
simplifies power flow calculations [19]. From the above, i, order
to analyze the electrical network, it is necessary to calculate
the power flow, the calculation of which must go through the
resolution of the nonlinear equations, where the recourse to
numerical methods is inevitable. Some methods are studied, and
we conclude that the Newton-Raphson method has enormous
advantages compared to the other methods, it is for this reason
that we will use it in the part of the power flow calculation.
Generator modeling
Generators are elements of the electrical network that allow
the conversion of energy (mechanical, chemical) into electrical
energy able to provide active power to the system. They also
supply or consume reactive power to maintain a certain voltage
level. The modeling of the generator uses the quantities:  , 𝑃𝐺𝑖,
and 𝑄𝐺𝑖 respectively stand for complex apparent power generates
by the generator to the busbar i, active power produces by
generator to busbar i and reactive power induces by generator to
busbar i. Other terms are also considered such as i V and 𝛿𝑖 which
respectively stand for complex voltage at busbar 𝑖 and phase shift angle of the voltage at busbar 𝑖. For the calculation of the power flow, the power 𝑃𝑐hi produced and the modulus of the voltage 𝑉𝑖
are kept at constant values. Phase 𝛿𝑖 and reactive power depend
on the state of the network. When 𝑄𝐺𝑖 exceeds one of these limits,
it is fixed at latter and the voltage can no longer be controlled. The
node then behaves like a load node.
, 𝑃𝐺𝑖,
and 𝑄𝐺𝑖 respectively stand for complex apparent power generates
by the generator to the busbar i, active power produces by
generator to busbar i and reactive power induces by generator to
busbar i. Other terms are also considered such as i V and 𝛿𝑖 which
respectively stand for complex voltage at busbar 𝑖 and phase shift angle of the voltage at busbar 𝑖. For the calculation of the power flow, the power 𝑃𝑐hi produced and the modulus of the voltage 𝑉𝑖
are kept at constant values. Phase 𝛿𝑖 and reactive power depend
on the state of the network. When 𝑄𝐺𝑖 exceeds one of these limits,
it is fixed at latter and the voltage can no longer be controlled. The
node then behaves like a load node.
Transformer modeling
Transformers are represented by their impedance connected
in series with an ideal transformer. The transformation ratio
is real for a conventional transformer whereas it is complex in
the case of phase shifting transformer. In general, the complex
transformation ratio  is defined as:

Where the quantities  and
and  respectively correspond to
complex voltages at nodes i and m.
respectively correspond to
complex voltages at nodes i and m.
Loads modeling.
The loads represent consumers connected to network corresponding to negative injections at nodes. They are modeled by constant powers independent of the modal voltage given by:
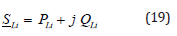
Where the quantities  , PLi, and QLi respectively stand for
complex load power, active power and reactive power (it can be
positive or negative if the load is inductive or capacitive).
, PLi, and QLi respectively stand for
complex load power, active power and reactive power (it can be
positive or negative if the load is inductive or capacitive).
Transmission line modeling
The lines are defined by their 𝜋-diagram (see Figure 1) which usually characterizes mean lines whose parameters are resistance r, reactance 𝑥 = 𝐿 ω and susceptance b =𝐶𝜔. In the case of long lines, they can be always reduced to an equivalent 𝜋-diagram. The transmission lines are modeled by the classical 𝜋-diagram in which the transverse conductance is neglected. The nodal admittance matrix connecting a node i to a node k is given by Eq. (20) as follows:
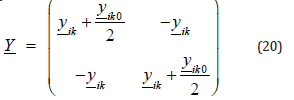
Where the longitudinal admittance
 is given by:
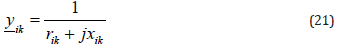
The quantities rik and 𝓍ik respectively stand for longitudinal resistance and longitudinal reactance of the line. The transverse admittance related to capacitive effects is written as:
where 𝑏ik0 is the transverse susceptance of the line.
UPFC modeling
According to the equivalent diagram of UPFC (see Figure 2), it is modeled by a complex voltage VS ∠δS connected in series with an impedance ZS; all connected in series with the line. Moreover, parallel voltage VP ∠δP connected in series with an impedance ZP.

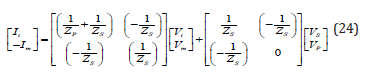
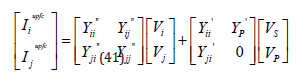
The currents Ii and Im can be reformulated as function of Vi and Vm as follows:
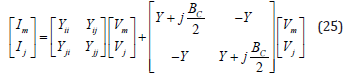
At the same way, the currents Im and Ij can be formulated as function of voltages Vm and Vj. So, we obtain:
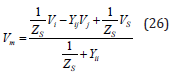
According to Eqs. (24) and (25), the voltage Vm can be written as a function of voltages Vi and Vj as follows:
According to Eqs. (24), (25) and (26), we obtain:
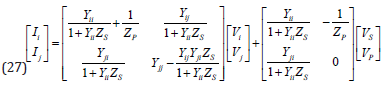
Then, Eq. (27) can be reformulated as follows:
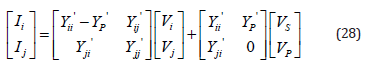
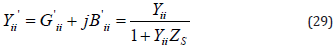
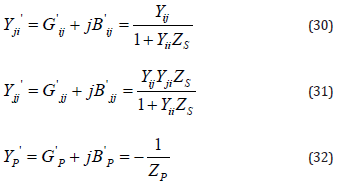
where:
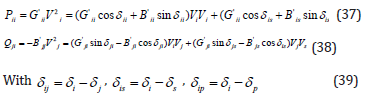
Equations representing power flow from node i to node j and vice versa, are written as follows:
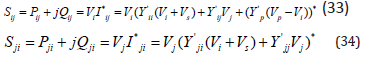
with,
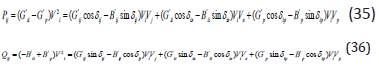
At the same way,
Finally, the currents  and
and  introduced to the line
are obtained as follows:
introduced to the line
are obtained as follows:
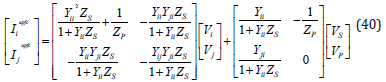
Another reformulation is given such as:
Where:
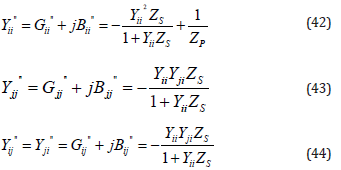
The powers introduced by UPFC are given as follows:
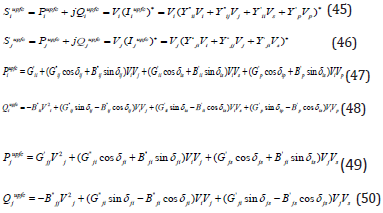
Those equations of powers are obtained by Newton Raphson method. They will be used in CPF (continuation power flow) technique by PSAT (power system analysis toolbox) software to generate the results obtained in Sec. 6.
Numerical results
Some important data needed to begin the simulation are presented in Tables 1, 2, 3 and 4 in Sec. 6.1. Those data that are introduced in PSAT software are related to generators, loads, transformers and transmission lines.
Network data at the beginning of simulation on PSAT
At the beginning of the simulation the parameters of the network are given as follows:
Analysis related to IEEE 14-Nodes standards network
The IEEE-14 bus transport network illustrated in Figure 3 is constituted by PV nodes, PQ nodes and synchronous generators. Using the CPF technique, voltage stability is investigated. The behavior of the test system considered without and with FACTS devices under different load conditions is also presented. The optimum location of the UPFC is determined through the network CPF by determining the most sensitive busbars according to two indices known as the total active losses and the stability margin (λmax). A classical PQ model is used for the loads. Generator limits are ignored. The voltage stability analysis is performed by starting from an initial stable operating point and then increasing the load by the factor 𝜆 until reaching the singularity point of the power flow linearization.
Analysis of 14-Busbars network without UPFC
1.1.1. Power flow results at initial state: Power flow results coming from PSAT software at the initial state are given by Table 1. The quantities P and Q stand for active and reactive powers respectively. According to Table 5, we can illustrate the network voltage profile at the initial state of the system as depicted in (Figure 4).
1.1.2. Determination of stability margin: To determine the stability margin by CPF method it is necessary to limit the reactive power because each generator is limited by a reactive power [Qmin Qmax]. So, we obtain Table 6. Applying the CPF method we obtain the maximum load factor 𝝀max = 1.1896 p.u. It is the maximum load factor that a network can withstand without losing its stability (for a larger value a network loses its stability). According to Table 6, we obtain Figure 5 where the voltage modulus profiles are illustrated at the stability margin after simulation. We consider the superimposition of the two graphs represented in Figures 4 and 5 and we obtain Figure 6. This Figure 6 presents a comparison between voltage modulus profiles at initial state and at network stability margin. Total active and reactive power losses obtained in Tables 1 and 2 lead to Figure 7. According to Figures 6 and 7 we outline that:


i. The voltage modulus of CPF state decreases from the initial state due to the increase of load.
ii. The active and the reactive losses at the stability margin increase compared to the initial state (with the increasing load and decreasing voltage modulus).


Determination of the most sensitive busbar: The most sensitive busbars (critical network nodes) must be determined for the optimal location of UPFC. This is based on the percentage voltage variation (Δv/v) at each busbar compared to the initial state. This fact leads to Table 7. Using CPF on the network without including UPFC, the calculation shows that the most sensitive node is node number 14. In fact, the observation of results obtained in Table 3, shows that busbars 11, 12, 13 and 14 are considered as critical nodes of our system because the percentages of voltage variations are higher compared to other busbars. Moreover, according to Figure 8 above presented, it appears that busbar which tends towards the point of the voltage collapse before the others stands for busbar 14 since it is most sensitive to voltage variation as a function of reactive power.


Analysis of the network without UPFC
The main goal in this section concerns the determination of an ideal location for UPFC device able to produce an increase of the voltage stability leading to the growth of the load factor 𝜆 of the system. This fact imposes voltage control and the decrease of active and reactive power losses. So, we place UPFC device on these various weak nodes to observe their impact on the system. After the determination of weak node which needs to be supported in the considered network the nominal values of UPFC should be chosen. It is expected that the introduction of UPFC device at critical nodes leads to the increase of load factor and the voltage profile will be plat. Electricity network managers impose ± 5% as tolerance on transmission network voltage to guarantee the quality of electricity distribution. We therefore take 𝑈𝑚𝑖𝑛 = 0. 95p.u and 𝑈𝑚𝑎𝑥 = 1.05p.u. In our simulations we set the injected voltage within its limits as well as UPFC compensation rate. The connection of UPFC to each sensitive node for the determination of the optimal location is given in Figure 7 and 9.


We have obtained in Table 3 that busbars 11, 12, 13 and 14 are the most sensitive of the network. So, those busbars have received UPFC device to build up Table 4. Total active and reactive losses and stability margin are measured for each busbar as seen in Table 8.
According to Table 4, the stability margin is illustrated in Figure 10. Concerning the results of Table 8, we note that the stability margin in the initial state is lower than that in the integration state of the UPFC. The introduction of UPFC device at nodes 14, 13, 12 and 11 gives the voltage stability margins respectively as follows: 2.0023, 1.8802, 1.8337 and 1.8927. According to these results, it clearly appears that the introduction of UPFC device at node 14 provides the best node of stability margin compared to other nodes. It also appears that the introduction of UPFC device at node 14, gives a better improvement in voltage stability and minimal active losses compared to other nodes in the system. According to Table 8, reactive losses for one location of UPFC at busbar 12 are higher compared to the other locations since the compensator absorbs the reactive power leading to the decrease of the voltage profile and the increase of losses. According to Figures 10 and 11, when integrating UPFC at note 14 there is an improvement in the voltage modulus and stability margin.
voltage stability in IEEE 14-Bus network
In general, the goal of FACTS devices such as SVC and UPFC is to improve the performance of the network. Among these performances we have the stability improvement, the voltage regulation and the increase of the transmission power providing reactive energy which stabilizes the voltage. According to the investigations done in [20], the stability of SVC at nodes 14, 13, 12 and 11 respectively gave the following voltage stability margins: 1.421, 1.381, 1.399 and 1.412. This fact confirms that the introduction of SVC at node 14 provides the best margin of voltage stability and minimal losses compared to other nodes. Table 9 shows the stability indices for the locations of the SVC and UPFC at node 14. The various compensators (UPFC and SVC) above introduced in IEEE -14 Bus transport network all have their own advantages and disadvantages. Figures 12 and 13 summarize the use of different compensators. Our choice of node 14 as weak node that needed support is reasonable according to its contribution (see Table 8). According to Table 9, the use of UPFC provides a better margin of stability than SVC providing better voltage stability as seen in Figure 13.
Conclusion
In summary, we have analyzed the stability of an IEEE -14 Bus network using FACTS, specially UPFC. We have employed Newton-Raphson mathematical development and CPF technique associated to PSAT software to analyze the network without UPFC and with UPFC. It appears that network performance analysis focuses on supporting the voltage profile, increasing voltage stability, and decreasing active and reactive losses for voltage collapse. The tests carried out have shown several interesting results. First, the FACTS system ensures an overall stabilization of the network. Indeed, the UPFC tends either to stabilize all the nodes, or to stabilize some, without affecting the others. In fact, it improves the performance of the power grid (especially in terms of stability and voltage support) by providing reactive power in the load area. The results obtained for voltage stability remain valid for the support of voltage profile. It can, however, be noted that the stability of a node does not depend only on its level of voltage, that is, a node with high voltage can still be unstable.
Conflict of Interest
The authors declare no conflict of interest.
References
- IEEE (1997) Proposed terms and definitions for flexible AC transmission system (FACTS). IEEE Transactions on Power Delivery 12(4 ): 1848-1853.
- Adapa R (1995) Flexible AC Transmission System (FACTS): System Studies to Assess FACTS Device Requirements on the Entergy System. Electric Power Research Institute. TR-105260.
- Chirag Tanti1 Dinesh P (2015) A Review of Optimal Placement of Shunt FACTS Devices using Optimization Techniques. IJSRD - Int J Scientific Res & Dev 2(12): 2321-0613.
- Ashfaq H, Muhammad A, Khan RD, Fayyaz Ahmad C (2018) Optimal Allocation of Flexible AC Transmission System Controllers in Electric Power Networks, Indian National Academy of Engineer 3: 41-64.
- Cevdet E, Engin K (2016) Optimum allocation of FACTS devices under load uncertainty based on penalty functions with genetic algorithm, Electr Eng.
- Mohan Mathur R (2002) Thyristor based FACTS controllers for electrical transmission systems. IEEE Press Series on Power Engineering,Wiley-Interscience.
- Aitor Hernández Sautua, M. Ángel Rodríguez Vidal, Esther Torres Iglesias, Pablo Eguia Lopez (2003) Survey and Crossed Comparison of Types, Optimal Location Techniques, and Power System Applications of FACTS, 2013 IEEE Grenoble Conference. IEEE power & Energy magazine. The FACTS on Resolving Transmission Gridlock p. 41-46.
- Yamille E Del Valle (2009) Optimization of Power System Perfrmance Using FACTS Devices. School of Electrical and Computer Engineering. Georgia Institute of Technology.
- Jordehi AR, Jasni J (2012) Approaches for FACTS Optimization Problem in Power Systems”. Power Engineering and Optimization Conference (PEDCO) Malacca, Malaysia, 2012 IEEE International.
- Seungwon A, John C, Gedra W (2007) An Ideal Transformer UPFC Model, OPF First-Order Sensitivities, and Application to Screening for Optimal UPFC Locations. IEEE Trans on Power Systems 22(1).
- Mansour Y, Xu F Alvarado W, Rinzin C (1994) SVC Placement Using Critical Modes of Voltage Stability, IEEE Trans. on Power Syst 9 : 757-762.
- Visakha K, Thukaram D, Jenkins L, Khincha HP (2003) Selection of UPFC Suitable Locations for System Security Improvement Under Normal and Network Contingencies. TENCON Conference.
- (2003) Convergent Technologies for Asia -Pacific Region 2 : pp. 755-760.
- Surender Reddy S, Sailaja Kumari M, Sydulu M (2010) Congestion Management in Deregulated Power System by Optimal Choice and Allocation of FACTS Controllers Using Multi-Objective Genetic Algorithm. Transmission and Distribution Conference and Exposition, IEEE PES.
- Sidhartha P, Ramnarayan NP (2006) Improving Power System Transient Stability with an Off-centre Location of Shunt Facts Devices. J Electrical Engineer 57(6): 365-368.
- Farbod L, Homayoun MK, Pishvaei M, Ali J (2009) Optimal location of STATCOM and SVC based on contingency voltage stability by using continuation power flow: Case studies of khouzestan power networks in Iran”. Second International Conference on Computer and Electrical Engineering, Dubai.
- Zahira S (2009) Optimisation de l'écoulement de puissances dans un système d'énergie électrique par la méthode du point inérieur, Mémoire de Magister, Université Hassiba Ben Bouali De Chlef.
- Issam, Réduction des pertes dans les réseaux électriques par la compensation série TCSC, Université Mohamed Khider Biskra, Faculté des Sciences et de la Technologie, 2012.
- Vijay Vihal AR (2000) Power Système Analysis.
- Sabrina Maannser (2019) Amélioration de la stabilité du réseau électrique au moyen des systèmes FACTS, Université Mohamed Khider Biskra.


