


Real-Time Heart Rate Estimation using Fast Independent Component Analysis and Hangover-Time Filter
Karthik Gottumukkula and Mansour Tahernezhadi*
Department of Electrical Engineering, Northern Illinois University, DeKalb, USA
Submission:June 14, 2019; Published:July 22, 2019
*Corresponding author: Mansour Tahernezhadi, Department of Electrical Engineering, Northern Illinois University, DeKalb, IL, USA
How to cite this article: Karthik G, Mansour T. Real-Time Heart Rate Estimation using Fast Independent Component Analysis and Hangover-Time Filter. Robot Autom Eng J. 2019; 4(4): 555645. DOI: 10.19080/RAEJ.2019.04.555645
Abstract
Heart rate is one of the physiological parameters which is measured for our health and well-being. By estimating it one can act pre-emptively in case of emergencies. In the past few years, various techniques were proposed, subjecting motion artifacts to increase the robustness of the system. This paper presents a real-time method of detecting the human heart rate, remotely, using a laptop camera. This paper also proposes on using a Hangover-Time filter for robust detection. Following the recent research [1], this project also utilizes OpenCV for face detection and isolating the forehead region, Fast Fourier Transform Analysis and Band-Pass Filter. Compared to the adaptive filter, the hangover-time filter has a difference in a mean error of ~0.26BPM and the corresponding Complement of the Absolute Normalized Difference (CAND) of 95.05% is achieved.
Keywords:Rppg; Vital parameters; Independent component analysis; Hangover-time filter; Adaptive filter; Heart rate estimation
Introduction
Plethysmography (‘Plethysmos’ means ‘to increase’ in Greek is a technique that can detect a change in the amount of blood present in an organ such as the heart. Photo-plethysmography (PPG), in particular, is a method of detecting a plethysmography signal by the effect of light reflectance or transmission from the skin. PPG was introduced in 1937 [2] and works on the principle that blood absorbs light and that variations in blood volume influence the amount of light’s reflectance or transmission. This serves as a potential tool to determine vital signs through the skin, thus opening numerous applications in the field of medicine and home automation systems.
Cardiac activity measurement is an essential tool in medical practice to measure a person’s physiological state. Traditional contact methods, such as electrocardiograph (ECG) offer high accuracy in measuring the cardiac cycle. ECG was developed by Willem Einthoven in 1901, which measures the electric potential between two points on the skin of a human body. ECG is the most common instrument used in the medical field. This project also utilizes ECG technique for benchmarking and testing purposes.
The first contactless vital sign measurement was proposed in 1997 [4]. The system was developed to pick up heartbeat and respiration signatures from 10 meters using a radar-based system. Based on the Doppler variations built on the chest movements, this system was used in 1996 Olympics for assessing an ath lete’s performance in archery and rifle competitions. Since radar can also pass through walls, this system could detect heartbeat through the walls. The only disadvantage of the system was that artifacts introduced by the subject’s movement contaminated the measurements. By using the same principle, near infrared (IR) light source developed by Humphreys et al. [5] was the first PPG-based system for detecting cardiac activities.
Humphreys et al. [5] subjected the near IR light on a finger and looked at the transmitted light on the other side, through a CMOS camera. The camera was placed above the finger at a height of 30-50cm. Similarly, a contact-based PPG system was developed by [6] in 2006, where PPG signals were found by studying the variations in the light that’s been reflected or unabsorbed by the finger. It is noteworthy to point out that this is the basic concept used in smartwatches and finger-tip-based measurement systems. In 2007 [7], IR-based cameras were used for measuring cardiac pulses. The study used periodic properties of the cardiac pulse’s thermal field, which was later analyzed through Fourier transform. However, it was not until 2008 [8] where contact-less PPG-based measurement of heart rate was performed in the visible spectrum using the fact that the green light is absorbed more into the blood, containing oxygen, than red or blue light. By analyzing the amount of absorption of green light, we can analyze the variation in blood flow in the vessel, indirectly measuring the heartbeat. The study [8] used pre-recorded RGB videos in ambient light conditions. They concluded in their research that among the three-color channels, green-channel contained more PPG signal than red, blue-channels. Thus., they could successfully measure heart rate and respiration-rate of a person. This research required the subjects to be stationary in order to reduce motion artifacts, establishing a promising framework and methodology for carrying out non-real time remote-sensing PPG in the visible spectrum. Nonetheless, this technique suffered from low accuracy and artifacts due to poor resolution of low-cost visible light cameras.
The research done in 2010 [3] has drawn a lot of attention towards heart rate detection, which inspired a new method in blind-source separation using joint approximation diagonalization of eigenmatrices (JADE) algorithm. Consumer laptop cameras, in recent years, have improved spatial and temporal resolution, which make this method easy to implement and use. This is a noncontact- based system, which is an advantage over the traditional contact-based system. This system avoids skin irritations and other discomforts provided by contact-based systems.
Blind Source Separation (BSS) method is one of a prominent method in digital image processing. Independent Component Analysis (ICA) is one of BSS technique, where independent signal sources can be filtered from a mixed signal. The same procedure is done by [8], instead of directly analyzing the three-color channels into Fourier analysis, ICA can be used as an intermediate filter before FFT [2]. By implementing ICA as a blind source separation technique [2], the system equipped with a laptop camera pointed on the entire face managed to reduce small motion artifacts, thereby increasing the stability in heart rate estimation. Later, this idea inspired another work [11] by which temporal filters were used only on the forehead region of the face. A similar technique was used in [12] in near IR spectrum which made the system motion robust. Using the forehead region made it much more convenient to develop the system. Another approach was proposed in [13], where principle component analysis (PCA) was used as a BSS technique in order to decrease the computational complexities while comparing to ICA.
Implementing a new PPG-based method of BSS called FastICA was developed by Wiede et al. [1]. FastICA reduces complex multiplication when compared to traditional ICA. Post fast ICA, they implemented an adaptive filter in order to combat motion artifacts introduced by the subject’s motion.
Using the framework proposed in [1], this paper implements a real-time fast ICA contact-less PPG method using OpenCV library in Python environment for detecting a person’s heartbeat. Moreover, this paper proposes a hangover-time filter to further improve system performance against motion-induced artifacts. This paper is organized as follows. Chapter II provides coverage on the proposed system overview and methodology. Chapter III demonstrates the experimental results. Chapter IV provides discussions of results and real-time applications. Finally, conclusions and future works are presented in Chapter V.
System Overview and Methodology
System Overview

Figure 1 describes the flow of the design. The design contains the following modules: Temporal Signal Extraction, Band Pass Filtering, Independent Component Analysis, Frequency Analysis, Adaptive and Hangover-time Filters. At the start, frames are acquired and then facial detection in each frame is processed. After the detection and isolating of the forehead, with the command from the user, frames are sent to temporal extraction. Temporal extraction is separating the three-color channels from the frames. After color separation, the three signals are sent to a bandpass filter. Bandpass filter filters out the signal containing frequencies other than the natural frequency of the human heart rate. After bandpass, the data is sent to ICA and from there to Frequency analysis which determines the final (raw) heart rate. The final heart rate signal contains outliers which can be filtered out by using an adaptive or hangover-time filter. A laptop (Dell Inspiron 5558) equipped with a webcam was used for image acquisition. The frames per second parameter was set by default to ~30fps. The webcam provided 640x480 resolution and before the user command, the automatic controls for exposure and white balance are set to true. After the user command, it’s set to false.
Face Detection and Isolating the Forehead
Face detection is achieved by traditional Viola-Jones detector [16] in OpenCV. The classifier used in OpenCV is Haar classifier. OpenCV locates the face by drawing a box across. The coordinates (x, y- axes, height, and width) of the box can be used for drawing a region of interest (ROI) on the forehead automatically. In Figure 2, the ROI can be calculated by the following set of equations:
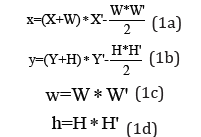

where X, Y, W, and H are as shown in Figure 2 and X ',Y ',W ',H ' are calibration constants. This feature enables us to automatically draw an ROI on the forehead, concerning the coordinates provided by face detection. The reason why the forehead is chosen as ROI is that it has good exposure, as demonstrated in [8,3]. It also exposes superficial blood vessels where light can easily transmit and bounce back to the camera. It has good light reflection characteristics with low light absorption of the tissue. Motion artifacts generally occur due to hair and eyebrows which contaminate the ROI. By effectively drawing ROI, free from hair or eyebrows, one can increase the motion robustness of the system.
Temporal Signal Extraction and Band Pass Filtering
After the user’s input, all the pixels in the ROI are summarized and averaged. By effectively programming equations (1) for temporal extraction, we can separate the color channels as:
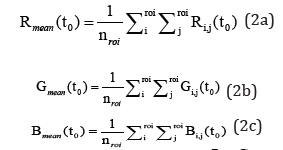
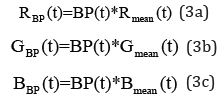
Every single pixel in ROI is denoted by , , , i j i j R G and i, j B corresponding to their color channels. Also, for every frame at time t_0, there is consequently one value for each color channel. The mean is obtained by averaging all the i, j X values in that ROI at their respective frames. After calculating the mean for all the three-color channels, they should be further filtered out to remove frequencies that are unrealistic for a human heart. Bandpass filter, which passes frequencies within a certain range and rejects frequencies outside that range, is set in between 0.5Hz (30BPM) and 3Hz (180BPM). The filter used in Python has an built-in pre-whitening process which can be used for ICA. By multiplying these band passes to the mean values, filtered channels are achieved:
The Bandpass Filter used for this application is an analog 9th order Butterworth lowpass filter which is transformed to a bandpass filter. Subsequently, a bilinear transformation is used to transform the analog filter into a digital filter. Equation (4), is the general 9th order analog Butterworth lowpass filter used in this paper. To transform this to a bandpass filter, s is transformed using Equation (5).
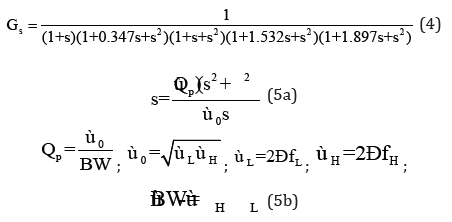
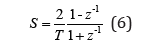
In Equation (5), p Q is the quality factor of the design. After substituting the above values into Equation (4), the analog Butterworth bandpass filter is achieved. Bilinear transformation is applied to convert this analog filter to a digital filter by using Equation (6). This equation requires a sampling time (T), which is the inverse of the sampling frequency. In this case, the sampling frequency is 30 frames-per-second (fps) or 30Hz.
Independent Component Analysis
The signals in Equation (3a-3c) contain distortion, white noise from camera and motion artifacts. To get the actual independent signal sources ICA is used by decomposing the three signals into true signals. ICA assumes that our observations are linear transformation of original data. Let us denote x a zero-mean n-dimensional variable that is observed, and s its n-dimensional independent source transform. Then by determining a demixing matrix W , which relates the relationship between x , s as:

From Equation (7), consider x to be the observed data from Equation (3). Consider s , to be the true signal that we need for further analysis. So, by multiplying a weight W , that could limit the motion artifacts and other noises in the original signal, the true sources can be achieved. This expression can be written in the form of matrices as:
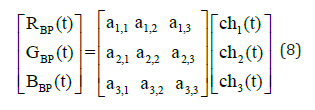
In Equation (8), the matrix containing n,m a is a matrix which is the inverse of the weight matrix W . The true sources are represented as ( ) n ch t . When compared to traditional ICA, this method is much faster and accurate. Unlike traditional ICA, FastICA assumes a random matrix as its weight and checks for convergence in the data. FastICA follows the property by maximizing the non-Gaussianity in the data. The more the data is non-Gaussian, the faster it converges. To increase the non-Gaussianity, the data should be pre-whitened. Pre-whitening is the process of centering the data to the zero-mean signal (by subtracting the mean all over the data) and whitening it using spectral decomposition (in terms of eigenvalues and vectors). After pre-whitening the data, the weight is estimated. This weight or mixing matrix is multiplied by the observed signal to get the original true sources. This calculation takes place at every one-second window or for every 30 frames.
Figure 3 shows all the three signals, extracted from the FastICA algorithm. The spectrum with the highest periodicity, which is visible in harmonics, is the component which is sent to the Fourier analysis. In Figure 3, the blue channel is seen to have no harmonics, because the FastICA in Python couldn’t converge at one specific time. Convergence is volatile in FastICA. So, Fourier analysis was performed on all the three channels and the maximum value is recorded. The signal produced may be smoothed out by using another lowpass filter for removing high-frequency noises, which is caused by the FastICA.

Frequency Analysis and Calibration
Fast Fourier Transform is used for spectral analysis. The analysis is performed for every second to find the maximum magnitude in the true signal. In Figure 4, the peak represents the heart rate max HR at time 0 t . To estimate it in less time, a calibration constant is required. Another work [15] suggested multiplying the final BPM value with a constant number 60. From numerous test cases, it is observed that the algorithm estimates precisely after 60 seconds. As a result, a calibration equation is formulated and is shown below
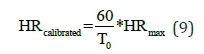
In the above equation, 0 T is the current time when the data is taken. 0 T ranges from 1 to n seconds. The calibration equation is written for the first 60 seconds.
Adaptive and Hangover-Time Filter
For eliminating false detections appearing due to sudden changes in the heart rate or sudden changes in data intake from one time to the next time, [1] suggested in using an adaptive filter. The working principle of the adaptive filter is to check the absolute difference between the current heart rate value ( ) 0 HR t and the previous heart rate value ( ) 0 HR t − Δt . This computed value is set as the threshold (T ) as shown in Equation (10). If the threshold is higher than 10BPM, then a sliding average is computed using the last 10 values represented below:
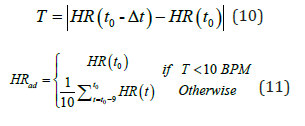

Hangover-time filter also works similarly but contains some extra filtering steps. When the threshold is found to more than 10 BPM, a timer is started to count for 3 seconds. While counting for 3 seconds, the previous value HR(t0 − Δt ) is considered as the output. After 3 seconds, there would be another comparison with the new heart rate value. If again the threshold is found to be more than 10BPM, then an average of the last 10 values is considered as the output. This is represented in a flow chart shown in Figure 5.

Experimental Results
The Setup
The experiment is conducted on a Dell Inspiron 5558 laptop which uses the in-built webcam (0.9 Megapixels). The webcam records the input at ~30fps. Automatic controls for exposure and whitening stays true until there’s a command from the user. The experiment is conducted in a closed lab environment with a white light source and also in ambient light areas in daylight. The subject was at a distance of 40.64 centimeters (16 inches) from the camera. The real-time heart rate determination is achieved in less than 15 seconds.
In Figure 6, an ECG monitor system is built using Arduino UNO to further test the project. The ECG is built using an instrumentation amplifier, a lowpass filter and a two-stage amplifier for getting an output of 3-5 V DC signal to feed into the Arduino for further computation. The input signals are directly taken from the chest area, by using contact electrodes.


Accuracy

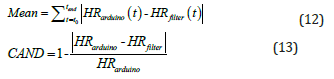
The test ranged the average heart rate from 55 BPM to 120 BPM. The mean error is calculated by using the equation provided in [1]. Equation (12) calculates the mean error for each time from 0 t to end t as the absolute difference between the measured heart rate ( ) filter HR t and the reference heart rate ( ) arduino HR t . Complement of the Absolute Normalized Difference (CAND) is also performed, shown in Equation (13).
Looking at Table 1, the CAND is expressed in %. The higher the percentage the better the algorithm. In Table 1, raw corresponds to the data which isn’t filtered out using any of the proposed final filtering methods. Raw is data coming after Fourier analysis. When compared to the Adaptive filter, the results show that Hangover- Time Filter has less mean error and higher CAND. The averages below are calculated using the data plots shown in Figure 7.


The intensity of the color channels can be tracked by using a simple camera. Hue, saturation, lightness (HSL) is an alternative to RGB color channels. Intensity or brightness or lightness is a component that is a part of the color channels. But to look at the intensity of the color, it should be converted into a pure black and white frame, where black and white corresponds to darkness and brightness respectively. Although HSL model is better compared to RGB model, it is suggested to stick to RGB model. So, it is only advisable to use this algorithm in RGB setting.
The computational speed of the algorithm takes approximately 34ms; which corresponds to 30fps for detecting, analyzing and deriving the heart rate. To increase the computational speed, analyzing red and green components of RGB channel is suggested. There are a wide variety of applications for remote estimation of heart rate. Home health care systems can implement such an algorithm. These systems can monitor the heart rate and act pre-emptively before an emergency occurs. Most of the health care systems are IOT based devices. Such systems can monitor people from remote locations.
In Kinesiology; in monitoring an athlete’s performance. This system can also be upgraded to monitor multiple athlete’s heart rate, who are performing the same task. Thus, eliminating contact- based interferences to the system. Since polygraph systems detect the sudden changes in respiration and heart rate patterns, this system can be used as a lie detector. There are publications [8,14], who estimated the respiration rate with the same data used for estimating the heart rate of a person. Implementing such a system in real time can eliminate the contact-based polygraph system.
Conclusion
There are some other techniques in drawing a ROI on the forehead. By tracking the location of the eyes [11], ROI can be drawn on the forehead with some variable constants. One can also achieve this simple implementation by tracking the eyebrows and draw an ROI where the lines intersect. For future work, using an advanced camera can increase the total resolution of the system. The algorithm can also favor other cameras like IR camera. Using Xbox Kinect, which has RGB, IR and depth sensor capabilities can be an advantage for further research. Increasing the frames-persecond can affect the results greatly, which is an advantage. The more the data intake in less time, the faster the results. In this paper, a hangover-time filter is discussed. Hangover-time filter is an upgrade to the adaptive filter. Heart rate is estimated remotely, using ICA and hangover-time filter. With the upcoming surge in cloud computing, this project can be utilized for computing a person’s heart rate remotely.
References
- Wiede C, Richter J, Apitzsch A, Khair Aldin F, Hirtz G (2016). Remote Heart Rate Determination in RGB Data - An Investigation using Independent Component Analysis and Adaptive Filtering, pp. 240-246.
- Hertzman AB, Spealman CR (1937) Observations on the finger volume pulse recorded photo-electrically, Am J Physiol 119: 334-335.
- Ming-Zher Poh, Daniel J McDuff, Rosalind W Picard (2010) Non-contact, automated cardiac pulse measurements using video imaging and blind source separation. Opt Express 18(10): 10762-10774.
- Greneker EF (1997) Radar sensing of heartbeat and respiration at a distance with applications of the technology. Radar 97 (Conf. Publ. No. 449), Edinburgh, UK, pp. 150-154.
- Humphreys Kenneth, Markham Charles, Ward Tomas (2005) A CMOS camera-based system for clinical photoplethysmographic applications. Proceedings of SPIE - The International Society for Optical Engineering 5823: 88-95.
- John A (2007) Photoplethysmography and its application in clinical physiological measurement. Physiol Meas 28(3): R1-39.
- Garbey M, Sun N, Merla A, Pavlidis I (2007) Contact-Free Measurement of Cardiac Pulse Based on the Analysis of Thermal Imagery. IEEE Transactions on Biomedical Engineering 54(8): 1418-1426.
- Verkruysse W, Svaasand LO, Nelson JS (2008) Remote plethysmographic imaging using ambient light. Optics express 16(26): 21434-21445.
- van Gastel MJH, Zinger S, Kemps HMC, de With PHN (2014) e-health video system for performance analysis in heart revalidation cycling," 2014 IEEE Fourth International Conference on Consumer Electronics Berlin (ICCE-Berlin), Berlin, 2014, pp. 31-35.
- van Gastel M, Stuijk S, de Haan G (2015) Motion Robust Remote-PPG in Infrared. IEEE Transactions on Biomedical Engineering 62(5): 1425-1433.
- Lewandowska M, Rumiński J, Kocejko T, Nowak J (2011) Measuring pulse rate with a webcam - A non-contact method for evaluating cardiac activity. Federated Conference on Computer Science and Information Systems (FedCSIS), Szczecin, pp. 405-410.
- Wu Hao-Yu, Rubinstein M, Shih E, Guttag J, Durand F, et al. (2012) Eulerian Video Magnification for Revealing Subtle Changes in the World. ACM Transactions on Graphics - TOG.
- De Haan G, Jeanne V (2013) Robust Pulse Rate from Chrominance-Based rPPG. IEEE Transactions on Biomedical Engineering 60(10): 2878-2886.
- Balakrishnan G, Durand F, Guttag J (2013) Detecting Pulse from Head Motions in Video. 2013 IEEE Conference on Computer Vision and Pattern Recognition, Portland, pp: 3430-3437.
- Tiba IN, Li L (2013) Image-Based Automatic Pulse Rate Monitoring System using PC Webcam. International Journal of Engineering Research & Technology (IJERT) 2(12): 841-847.
- Viola P, Jones MJ (2004) International Journal of Computer Vision 57: 137.


