Potentiometric Determination of Asenapine Maleate Using PVC Membrane and Carbon Paste Ion-selective Electrodes
Nesrin K Ramadan1, Taghreed A Mohamed2, Rowayda M Fouad2* and Azza A Moustafa1
1 Department Analytical Chemistry, Faculty of Pharmacy, Cairo University, Egypt
2Department of Pharmaceutical Chemistry, National Organization for Drug Control and Research, Egypt
Submission: August 28, 2018; Published: September 20, 2018
*Corresponding author: Rowayda M Fouad, National Organization for Drug Control and Research, P.O Box 29, Giza, Egypt, Tel: +20237496077; Email: dr_rodi225@yahooo.com
How to cite this article: Nesrin K R, Taghreed A M, Rowayda M F, Azza A M. Potentiometric Determination of Asenapine Maleate Using PVC Membrane and Carbon Paste Ion-selective Electrodes. Organic & Medicinal Chem IJ. 2018; 8(1): 555726. DOI: 10.19080/OMCIJ.2018.08.555726
Abstract
Three sensitive and selective electrodes were developed for the determination of asenapine mallet. One electrode containing PVC membrane, ammomium renikate as an anion exchanger and dibutyl phthalate as a plasticizer (sensor I). Two carbon past ISE using phosphodiester acid and ammomium renikate as an anion exchanger (sensors II and III) and dibutyl phthalate as a plasticizer. The proposed electrodes showed a near-sensation response in the range from 1.00×10⁻⁵ to 1.00×10⁻² mol/L for sensor I and 5.00×10⁻⁵ to 1.00×10⁻² mol/L for both sensor II and III. The selectivity of the proposed electrodes to a number of interferences was investigated. Asenapine was successfully determined in pure form, pharmaceutical formulation and in presence of its oxidative degradation product.
Keywords: Asenapine (AS); Ion-Selective Electrodes (ISES); Polyvinyl Chloride (PVC); Carbon Paste; Potentiometry
Introduction
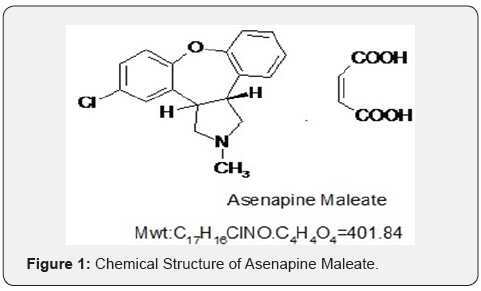
Asenapine maleate is a white to off-white non hygroscopic powder, slightly soluble in water (5.80 mg/mL) [1], sparingly soluble in 0.1 M HCl, soluble in methanol. The pH of a saturated asenapine solution in water is 4.2 at 23.5 ⁰C, its pKa is 8.6. AS is atypical antipsychotic drug developed for the treatment of schizophrenia and acute mania associated with bipolar disorder [2]. It shows high affinity for numerous receptors like serotonin, adrenergic, dopamine, histamine [3]. Many methods have been mentioned in the literature for the determination of AS in pure form, in pharmaceutical formulation, as well as in biological fluids as, Titrimetric method [4], Spectrophotometric methods [5-8]. Gas chromatography [9], Liquid chromatography [10,11] and Thin layer chromatography [12]. Different HPLC methods using different mobile phases and detectors [13-24]. There were 5 stability indicating HPLC methods [25-29]. No electrochemical method was introduced for determination of asenapine. Ion-selective electrodes have been used recently for quantitative determination of drugs as it has many advantages comparing to other sophisticated methods [30,31]. ISEs have low detection limit, good accuracy, wide concentration range and good applicability to turbid and coloured solutions. ISEs give high selectivity towards the drugs in the presence of different excipients. The proposed work introduces three different electrodes for the determination of asenapine maleate according to ICH guidelines [32]. The electrochemical sensitivity of the electrode is based on the incorporation of ion pair (AS-AR and AS–PTA) using PVC membrane and carbon paste (Figure 1).
Experimental
Apparatus
i. Jenway 3510 PH meter (Braloworld Scientific Ltd, Dunmous, Essex CM63LB. UK), serial no. 04487 with Ag/AgCl double junction reference electrode no. 924072-BO3-Q11C.
ii. pH glass electrode (Jenway, UK) no. 924072-BO3-Q11C
iii. Hot plate stirrer, CB302 (Biocote, UK assemble by PRC).
Samples
Pure Samples: AS was kindly supplied by Hikma Pharma S.A.E, 6th October City, Egypt (Batch No.AOLM0040514). According to the manufacturer’s method [33] its purity was found to be 100.1 ± 0.310.
Pharmaceutical Formulation: Asenapine-Hikma Pharma tablets, (Batch No 003) were claimed to contain 10mg AS manufactured by Hikma Pharma S.A.E Company and were purchased from a local market
Degraded Sample: An accurately 100mg of AS was transferred into 250mL round-bottom flask and 100mL 30% H2O2 solution was added then refluxed for 3hours.The refluxed solution was evaporated to dryness, the residue was left to cool, then washed 5 times with methanol. The pure residue was accurately transferred into a 100mL volumetric flask. The volume was completed to the mark with methanol and finally filtered to get final concentration equivalent to (1mg/mL AS deg). Then the methanolic solution was evaporated to dryness and the residue was dissolved in 10 mL methanol. The solution was applied as separate compact bands, 10mm from the bottom of the TLC plates, using 25μL Hamilton micro syringe. The plates were developed in a chromatographic tank previously saturated with toluene- methanol- chloroformammonia solution 33% in the ratio of (5:3:6:0.1, by volume) for 45 minutes. The plates were developed (over a distance of 18cm) in an ascending manner and air-dried. Then the degradate was scratched from TLC plates after detection under UV lamp and extracted with methanol. The methanolic solution was evaporated to dryness and used for the suggested method.
Chemicals and Reagents:
a) All chemicals and reagents used were of analytical grade.
b) Methanol (Fischer Scientific, UK).
c) H2O2 (30% solution: Fischer Scientific, UK).
d) Poly vinyl chloride (PVC) of high mol/L /L ecular weight, (Fluka Chemie, Germany)
e) Dibutylphthalate (DBP) (Merck, Newgersy USA).
f) Graphite powder and Ammonium renikate (AR) (Sigma Aldrich).
g) Phosphotungestic acid (PTA) (BDH Ltd, Poole, UK).
h) Tetrahydrofurane (THF) (Lab-Scan Analytical Science)
i) 1 M Sodium hydroxide, 1 M Hydrochloric acid, aqueous solution (Prolabo VWR International, West Chester, PA).
j) Bi-distilled water.
Standard and Degraded Solutions
a) AS stock standard solution: (1.00×10⁻² mol/L) in bidistilled water
b) AS working standard solution: (1.00×10⁻⁶ to 1.00×10⁻³ mol/L) in bi-distilled water
c) AS deg stock solution: (1.00×10⁻³ mol/L) in bi-distilled water.
Laboratory Prepared Mixtures Containing Different Ratios of AS and AS deg
A 10mL volume of AS solution (1.00×10⁻³ mol/L) was quantitatively transferred into a series of 100 mL volumetric flasks. Aliquots from the corresponding degradation product solution (1.00 ×10⁻³ mol/L) were added, and the volume was completed with bi-distilled water to prepare mixtures containing 10:1, 10:2, 10:3, 10:4, 10:5, 10:6,10:7,10:8 and 10:9 AS: AS deg ratios.
Procedure
Preparation of AS-AR and AS-PTA Ion Pair
AS-AR and AS-PTA ion-pairs were prepared by adding 100mL of 1.00 ×10⁻² mol/L AS to 100mL 1.00×10⁻² mol/L ammonium renikate and phosphotungestic acid separately. The solutions were stirred for 10min. The pink and buff precipitate was filtered, washed with bi-distilled water and left to dry over night at room temperature.
Sensor I Fabrication (PVC Membrane Based Electrode)
The PVC membrane (electrode I) was prepared by dissolving in a glass petri dish (7.5cm diameter), 20.00 mg of AS-AR ion pair, 190.00mg DBP and 190.00mg PVC in 6mL THF. The petri dish was then covered with a Whatman No. 3 filter paper and left to stand overnight to allow solvent evaporation at room temperature. A master membrane with a thickness of 0.1mm was obtained. A disk (about 7mm diameter) of the membrane was cut out and glued with the aid of PVC/THF slurry to the end of a PVC tube.
Sensor II and III Fabrication (Carbon Paste Electrode)
The carbon paste electrode, sensor II was prepared by dissolving in a glass mortar 50.00mg of AS-AR ion pair in 475.00mg of DBP with aid of 2mL of THF. About 475.0mg of carbon powder was added to the mixture. While sensor III was prepared by dissolving in a glass mortar 32.00mg of AS-PTA in 484.0mg of DBP with aid of 2mL of THF. About 484.0mg of carbon powder was added to the mixture. The THF in the two sensors was allowed to evaporate at room temperature and the formed pastes were mechanically homogenized with glass rods.
Electrode Assembly
In Case of Sensor I: Equal volumes of 1.00×10⁻²M AS and 1.00×10⁻² mol/L potassium chloride (prepared in bi-distilled water) were mixed in the previously prepared PVC tube and used as an internal reference solution. Ag/AgCl wire (1mm diameter) was immersed in the internal reference solution as an external reference electrode. Sensors I was then conditioned by soaking in AS (1.00×10⁻² mol/L) stock standard solution for 24 hours and stored in the same solution when not in use. The electrode was preconditioned by soaking in distilled water for ½ hour before use. A double junction Ag/AgCl electrode was used as an external reference electrode. The electrochemical system for the PVC electrode is represented as follows:
Ag/AgCl/internal filling solution/PVC membrane/test solution//KCl salt brige/Ag/AgCl.
In Case of Sensors II and III: An empty 50μl plastic tip was used as electrode body. The tip was completely filled with each paste. The back connection was made by inserting a copper wire into the paste through the apex of the tip. The wide open of the tip served as the electrode surface. Complete and compact packing of the paste was confirmed by pressing the tip (at the wide open) into the paste several times. The surface of the paste at the wide open was smoothed onto a paper until it had a shiny appearance with no cracks. The electrode was used directly for measurements. A double junction Ag/AgCl electrode was used as an external reference electrode. The electrochemical system for each electrode is represented as follows:
Cu wire/carbon paste/test solution//KCl salt brige/Ag/AgCl.
Direct Potentiometric Determination of AS in Pure Samples Using the Fabricated Sensors I, II and III: Aliquots of 25mL from (1.00×10⁻⁶ –1.00×10⁻² mol/L) standard solutions of AS were transferred into a 50mL beaker. Each sensor separately was conjugated with double junction Ag/AgCl reference electrode, calibrated by being immersed in its respective drug solutions and allowed to equilibrate while stirring until constant reading of the potentiometer. Then the electromotive forces (e.m.f) were recorded within ± 1 mV. Calibration graphs were plotted relating the recorded electrode potentials obtained by the three proposed sensors versus -log molar concentrations of AS and the regression equations were computed. The fabricated sensors were washed with bi-distilled water before and after each run till reaching a constant potential. The calibration graphs or the computed regression equations were used for subsequent measurements of unknown concentration of AS.
The slope of the calibration graph was calculated using Nernestain equation

Where: R is the gas constant, F is the Faraday equivalent and z is the charge of the analyte. The term is a constant which is the sum of all invariants in the system.
Accuracy
The accuracy of the results was checked by applying the proposed method for the determination of different samples of AS. The concentrations were obtained from the corresponding regression equations.
Precision
Repeatability: Three concentrations of AS (5.00 ×10⁻³, 1.00×10⁻³ and 5.00×10⁻⁴ mol/L) were analyzed three times, each intra-daily using the previously mentioned procedures under (Direct potentiometric determination of AS in pure samples). The standard deviations for the proposed drug were calculated from the computed regression equations.
Intermediate Precision: The above mentioned AS samples were analyzed on three successive days using the previously mentioned procedures under (Direct potentiometric determination of AS in pure samples). The standard deviations for the studied drug were calculated from the computed regression equations.
Direct Potentiometric Determination of Laboratory Prepared Mixtures Containing Different Ratios of AS And AS Deg (Specificity): The prepared electrodes (sensors I, II and III) in conjunction with the double junction Ag/AgCl reference electrode were immersed separately in the prepared mixtures (Direct potentiometric determination of AS in pure samples.), the resulting potential was recorded for each solution at constant stirring at room temperature and then the respective concentration was calculated from the corresponding regression equations.
Direct Potentiometric Determination of AS In Pharmaceutical Formulation: The contents of twenty Asenapine tablets were accurately weighed, an amount equivalent to 100.00 mg AS was accurately weighed and transferred into a 25-mL volumetric flask, about 15mL of bi-distilled water was added, sonicated for 30min and finally diluted to the mark with bidistilled water to obtain solution of concentration 1.00×10⁻² mol/L of AS. Suitable dilution was made to prepare solution containing 1.00×10⁻³ mol/L. The prepared electrodes (sensors I, II and III) in conjunction with the double junction Ag/AgCl reference electrode were immersed separately in 25mL of the prepared solution, the resulting potential was recorded and then the respective concentration was calculated from the corresponding regression equations. The validity of the proposed method was assessed by applying the standard addition technique.
Results and Discussion
In this section ISEs were introduced for determination of AS in pure form, in pharmaceutical formulation and also in presence of its degradation product. ISEs have many good advantages as it has the capability of performing direct measurements in turbid and colored samples. They show rapid response to change in the concentration. Furthermore, they may be used for measurement over a wide concentration range. ISEs are generally tolerant to small changes in pH. A further advantage is that they are relatively simple and not expensive to develop, set up and run. Moreover, the chemical design of the electrodes has been developed to give superior selectivity and response. The most common type of potentiometric ISE comprises a sensing membrane, usually a PVC membrane, sandwiched between two solutions, the sample and the inner filling solutions [34] such configuration requires a good deal of practice and patience and requires large volumes of samples for analysis.
In contrast to PVC membrane ISEs, the carbon paste ISEs have no inner filling solution [35,36]; hence, they have the advantage of simplicity and ease of preparation. In addition, the carbon paste ISE has the advantage of ease of regeneration; simply, a new active surface can be obtained by rubbing the electrode surface against a filter paper. This study introduced one PVC membrane electrode using ammomium renikate (AR) as an anion exchanger and dibutyl phthalate (DBP) as a plasticizer (sensor I). Two carbon past ISEs using phosphotungestic acid (PTA) and AR [37-39] as an anion exchanger (sensors II and III) and DBP as a plasticizer.
Optimization of The Method
Effect of Composition or Sensors Fabrication: The composition of the PVC membrane electrode was optimized by studying the potentiometric response of four PVC membranes (Table 1). An optimum Nernestian response of 58.314mV/decade over the concentration range from 1.00x10⁻⁵ to 1.00x10⁻² mol/L was observed with a membrane containing 5.00% AS-AR, (Figure 2). Different carbon paste electrodes were prepared with 2.50, 5.00, 7.50 and 10.00 % (w/w), of AS-AR and 3.2, 6.4, 9.6 and 12.80%, of AS-PTA. The best composition was that containing 5.00% and 3.20% for AS-AR and AS-PTA respectively. The electrode showed a Nernestian slope of 58.457 and 58.114mV/decade for AS-AR and AS-PTA respectively, over the concentration range from 5.00x10⁻⁵ to 1x10⁻² mol/L for both sensor as shown in Figures 3 and 4 and (Table 1).
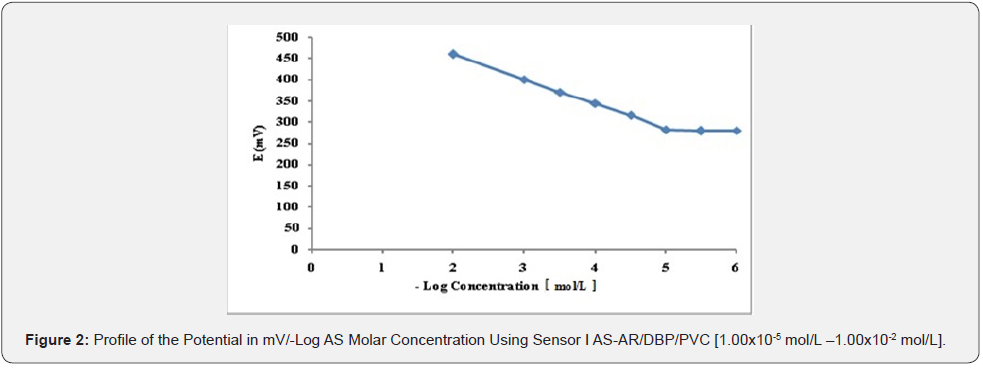
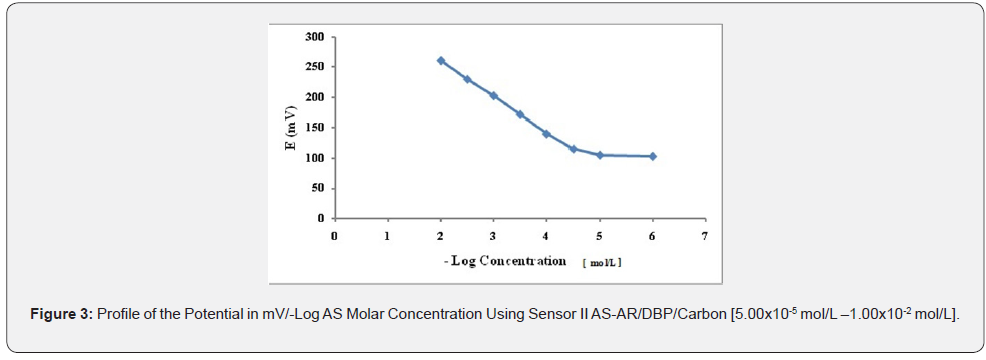
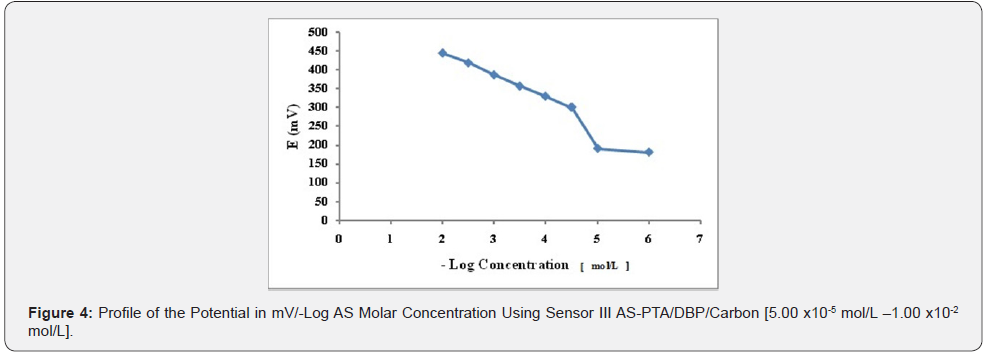

The Slope, Response Time and Operative Life of The Electrodes: The electrochemical performance of the three proposed sensors was evaluated according to the IUPAC recommendations data [40]. The slope, linear range and detection limit of the PVC membrane electrode was recorded at different time intervals over a period of several days of continuous soaking in water. The PVC polymeric membrane can withstand the effect of soaking for up to 6 weeks. The electrode showed a constant slope about 58.30mV/decade for 6 weeks. The carbon paste electrode possesses the advantage of ease of surface regeneration. The surface can be regenerated by simply rubbing the electrode surface against a filter paper. The slope of the carbon paste electrode before and after regeneration was about 58.50 mV/decade.

Average of three determinations.
**All interferents are in the form of 1.00 × 10⁻³ mol/L solution.
Selectivity of the Electrodes: The selectivity of the proposed electrodes to AS in presence of tablets excipients, organic and inorganic related substances, was assessed using the separate solution method (SSM) [39]. The SSM is dependent on Nickolsky- Eisenman equation. Table 2 summarizes the selectivity coefficient of the three electrodes for some common cations, sugars and amino acids. Due to the very small values of (– ), they were tabulated as the negative logarithm (– ). The small values of the selectivity coefficient of the electrode reflect a very high selectivity for AS cations in the presence of interfering ions.
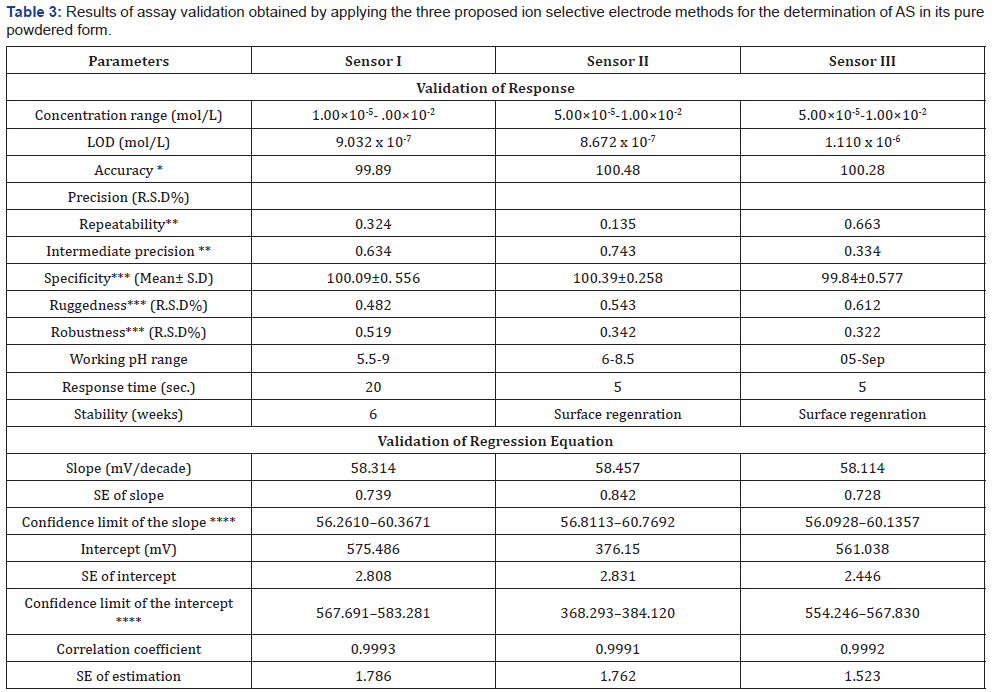
*n = 6. ** n = 3×3. *** n = 6. **** 95% confidence limit. LOD (Limit of detection) was measured by interception of the extrapolated arms of Figures 1-3.
Sensors Calibration and Response Time: The slopes of the calibration plots were 58.314, 58.547 and 58.114 mV/decade for sensor I, II and III respectively, the typical values of monovalent substance as AS behaves as monovalent via its amino group. Deviation from the ideal Nernstian slope (60mV/decade) stems from the fact that the electrodes respond to the activity of the drug rather than its concentrations. The dynamic response time of the proposed electrodes was studied by measuring the time required to achieve a steady state potential (within ±1 mV) after successive immersion of the electrodes in a series of stirred AS solutions (1.00×10⁻⁶ to 1.00×10⁻² mol/L). The required time was found to be and 20 seconds for sensors I and 5 seconds for sensors II and III, Table 3.

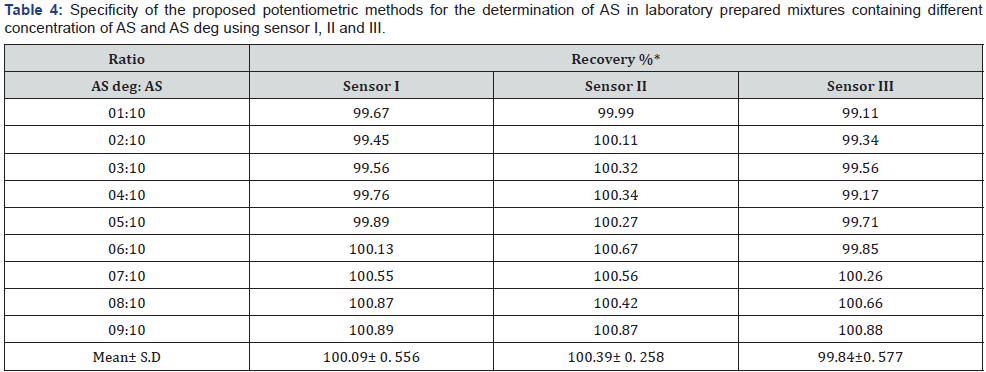
*Average of three determinations.
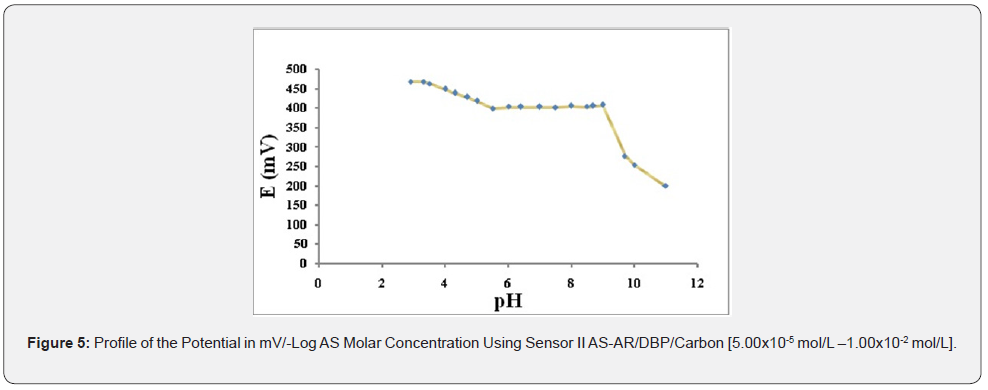
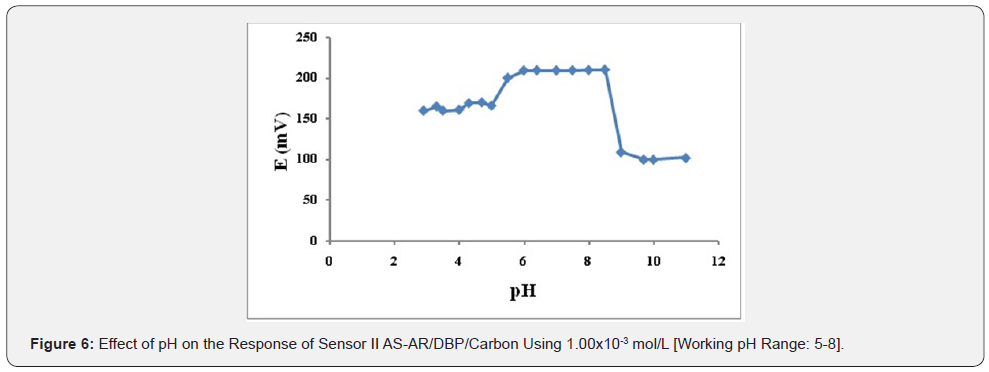
Effect of pH: The effect of pH on the potential of electrodes was investigated by recording the variation in the cell potential when small volumes of hydrochloric acid and/or sodium hydroxide (0.1- 1.0M of each) were added to 1.00×10⁻³ mol/L AS (Figures 5-7). It is obvious that the electrodes do not respond to pH changes in the range from 5.5-9, 5-8 and 5-9 for electrode I, II and III respectively (Table 3). The decrease in the cell potential at pH values higher than 9 is most probably due to the formation of the free AS base in the test solution or the formation of non-protonated drug. The proposed electrodes were successfully applied for the determination of AS in pure solution from1.00×10-5 to 1.00×10- 2 mol/L for sensor I and 5.00×10⁻⁵ to 1.00×10⁻² mol/L for both sensor II and III (Figure 5-7). Validation of the proposed method was assessed according to ICH guidelines [32] by measuring range, linearity, accuracy, precision and specificity. Results obtained are depicted in. The proposed method was successfully applied for the determination of the drug in pure powdered form with mean percentage recoveries of 99.89 ± 0.489, 100.48 ± 0.309 and 100.28 ± 0.544 for sensor I, II and III respectively (Table 3). The specificity of the proposed potentiometric method was emphasized upon analyzing laboratory prepared mixtures containing different percentage of the drug and its degradation product. The Potentiometric measurement valid in the presence of up to 90 % of AS deg, as shown in Table 4.
*Average of five determination
**average of three determination
Claimed amount (1.00×10⁻³ mol/L =0.40mg/mL).

*HPLC method: using Intersil C8 column {250x4.6mm, 5μm} and isocratic elution; mobile phase A (buffer di potassium hydrogen phosphate 3.48g/1000, 0.5mL TEA adjusted to pH=6.7): mobile phase B (acetonitrile: water 90:10) in the ratio of 38: 62 v/v , with flow rate 1mL/min , at 40ºC and detection at 220 nm .
** Figures in parentheses are the corresponding tabulated values at p = 0.05.
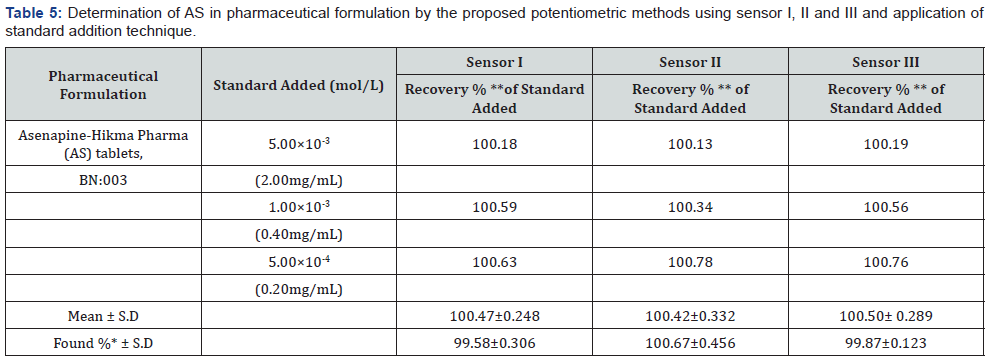
To study the method ruggedness, three different concentrations (5.00×10-3,1.00×10-3 ,5.00×10-4 mol/L) solution of AS were analyzed in different laboratory using different apparatus did not have a significant effect on the potentiometric measurement proved the stability of the method upon change the laboratory or even the instrument. While for the robustness, the above solutions of AS were determined using AR and PTA from different company did not have a significant effect on the potentiometric measurement, illustrating the robustness of the method. The proposed method has been successfully applied to assay AS in Asenapine tablets. The validity of the proposed method was further assessed by applying the standard addition technique for the analysis of asenapine tablet (Table 5). The results obtained by applying the proposed method for the analysis of the studied drug in pure form were statistically compared with those obtained by applying the manufacturer method [33] for AS. The values of the calculated t and F are less than the tabulated ones which reveal that there is no significant difference with respect to accuracy and precision [41] as shown in Table 6.
Conclusion
The responses of the fabricated sensors are sufficiently precise, accurate and prove the great selectivity of the sensors for the quantitative determination of AS in pure form, in pharmaceutical formulations and in presence of its degradation product. Moreover, the use of the proposed sensors compromises the great advantage of eliminating any need for drug pretreatment or separation steps. They can therefore be used for routine analysis of AS in quality control laboratories. In general, the ISEs proposed here offer simplicity in design and a very low limit of detection as well as being rapid, inexpensive and could compete with the many sophisticated methods currently available.
References
- Blatter F, Reinach CH, Katharina R, Rheinfelden DE Novel crystalline asenapine hydrochloride salt forms.
- Van Der Sterren, JEM, Van Den Heuvel, DJM (2008) Intranasal administration of Asenapine and pharmaceutical compositions therefore.
- Shahid M, Walker GB, Zorn SH, Wong EHJ (2009) Psycho pharmacol 23(1): 65-73.
- Kiran A, Manish KT, Raghunandan N (2012) JAPS 2(8): 41-145.
- Mrudulesh Y, Ravisankar P, Devadasu Ch, Srinivasa BP (2013) JPCS 6(4): 227-230.
- Halima OA, Aneesh TP, Reshma G, Nathasha RT (2012) Development and validation of UV spectrophotometric method for the estimation of asenapine maleate in bulk and pharmaceutical formulation. Der Pharma Chemica 4(2): 644-649.
- Borkar AA, Gaikwad N (2016) JPSR 7(7): 3080-3084.
- Surekha ML, Swapna M, Swamy GK (2013) Indo Am J Pharm Res 3: 4637-4644.
- Caitlin M, Oscar P, Dan A, Diane MM, Norman WJ (2013) Anal Toxi 37: 559-564.
- Ambavaram V, Bhaskar R, Nandigam V, Gajulapalle MJ (2013) Pharma Anal 3(6): 394-401.
- Theo B, Erik M, Henri M, Jaap W, Peter D, et al. (2012) Biomed Chromatogr 26(2): 156-165.
- Patel BR, Naregalkar SN, Patel RMJ Liq (2015) Chromatogr and Related Techno 38(19): 1731-1739.
- Krebbers VW, Jacobs SF, Kemperman MPL, Spaans GJ, Peters E, et al. (2011) Development and Validation of Stability-Indicating Spectrophotometric and Spectrofluorimetric Methods for the Determination of Asenapine Maleate Drug Metabol. Dispos 39: 580- 590.
- Nagarajan G, Shirisha K, Archana Mu, Sravanthi P, Ramana BV (2012) Der Pharma Lett 4(6): 1805-1810.
- Chander P, Mehta T (2013) Thermo Fisher Sci Inc Appl Note 20: 739- 744.
- Kiran A, Manish KT, Raghunandan NJ (2012) Chem Pharm Res 4(5): 2580-2584.
- Parthasarathi TR, Srinivas TS, Vanitha SMS, Ram S, Basha MM, et al. (2012) Int J Pharma Bio Sci 3: 360-366.
- Geetharam Y, Ramamohan GV, Srikumar PP, Rusyendra GV, Lavanya N (2013) Asian J Pharm Anal Med Chem 1: 132-139.
- Theo B, Erik M, Henri M, Jaap W, Peter D, et al. (2012) Bio chromatogr 26: 1461-1463.
- Kumaraswamy G, Surekha ML, Swapna M (2013) Contemp Investi Obser Pharm 2(3): 79-84.
- Chhalotiya UK, Bhatt KK, Shah DS, Patel JR (2012) Sci Pharm 80: 407- 417.
- Narke R, Mandlik S, Kapure S (2015) Invent Impact Bio Anal 1: 5-8.
- Aneesh TP, Rajasekaran A (2012) J Inter pharmacy and pharm Sci 4(4): 448-451.
- Yadav BK, Sathish NK, Lamichhane M, Acharya A (2015) Der Pharma Lett 7(6): 214-219.
- Kalpana GL, Devalarao G, Raju MB, Praveenkumar T (2015) J Inter pharmacy and pharm Sci 7(11): 61-65
- Aneesh TP, Rajasekaran A (2012) J Inter pharmacy and pharm Sci 4(4): 448-451.
- Narke R, Mandlik S, Kapure S (2015) Invent Impact Bio Anal 1: 5-8.
- Chhalotiya UK, Bhatt KK, Shah DS, Patel JR (2012) Sci Pharm 80: 407- 417.
- Ramadan NK, Mohamed TA, Fouad RM, Moustafa AA (2017) JPC 30(4): 313-322.
- Moody G, Thomas J (1979) Selective Ion Sensitive Electrode. Chapter 1, Merrow technical library, 1979.
- Hosny MM (2007) Taiwan Pharma J 59(25): 25-30.
- (1996) The European Agency for the Evaluation of Medical Products ICH Topic Q2B Note for Guidance on Validation of Analytical Procedures; Methodology, 1996 CPMP/ICH/281/95.
- Manufacturer’s procedure, supplied by Hikma pharma Co (Cairo, Egypt) by personal communication.
- Refat FA, Mohamed GG, Mohamed HA (2012) American J Anal Chem 3: 576-586
- Ismail NS (2016) Iranian J Pharma Sci 12(1): 45-58.
- Frag EYZ, Mohamed GG, Nour El Dien FA, Mohamed ME Analyst (2011) 136: 332-339.
- Al Tamimi SA, Al Mohaimeed M, Alarfaj NA, Aly FA (2013) Int J Electrochem Sci 8: 3988-4001.
- Erdem A, Dalbasti T, Baş MI, Aysem OM (1999) Acta Pharmaceutica Turcica 41: 29-35.
- Hassan SS, Ma TS (1982) Organic Analysis Using Ion Selective Chapters 1 and 2, Academic press, London, UK.
- Umezawa Y, Buhlmann P, Umezawa K, Tohda K, Amemiya S (2000) International union of pure and applied chemistry (IUPAC), analytical chemistry division, comission on analytical nomenclature. Potentiometric selectivity coefficients of ion-selective electrodes. Pure and Applied Chemistry 72(10): 1851-2082.
- Gardiner WP (1997) Statical Analysis Methods for Chemists: A Software-Based Approach. The Royal Society of Chemistry UK 42(72): 330-333.


