Predicting Tissue Viability in Ischemic Stroke with Diffusion and Perfusion MRI
Yu Xie1,2, Liang Liao1,3, Francis Guillemin4, Bailiang Chen1,5, Jacques Felblinger1,5, Gabriela Hossu1,5, Serge Bracard1,3*
1Université de Lorraine, Inserm, IADI, France
2Department of Neurology, Zhongnan Hospital of Wuhan University, China
3Department of Diagnostic and Interventional Neuroradiology, France
4CHRU-Nancy, Inserm, Université de Lorraine, France
5CHRU-Nancy, Inserm, Université de Lorraine, France
Submission: April 22, 2019; Published: May 16, 2019
*Corresponding author: Serge Bracard, Department of Diagnostic and Interventional Neuroradiology, University Hospital of Nancy, 54035 Nancy, France
How to cite this article: Yu Xie, Liang Liao, Francis Guillemin, Bailiang Chen, Jacques Felblinger, Gabriela Hossu, Serge Bracard. Predicting Tissue Viability in Ischemic Stroke with Diffusion and Perfusion MRI. Open Access J Neurol Neurosurg. 2019; 10(5): 555799.DOI: 10.19080/OAJNN.2019.10.555799.
Abstract
Background: Identification of salvageable tissue is crucial for acute ischemic stroke evaluation. Magnetic resonance imaging (MRI) could be very useful but its role has not been fully established.
Objectives: We aimed to assess whether parameters of diffusion-weighted imaging and perfusion-weighted imaging could predict tissue viability.
Methods: 36 ischemic stroke patients who underwent baseline MRI and day-7 images were included. Both initial abnormal diffusion areas and perfusion-diffusion mismatch areas were separated into parts which presented as normal tissue on day-7 images and those which evolved into infarction. The roles of diffusion and perfusion parameters in predicting tissue viability were analyzed at region-of-interest level. Receiving operating characteristic curves were performed to select appropriate parameters and determine the optimal thresholds.
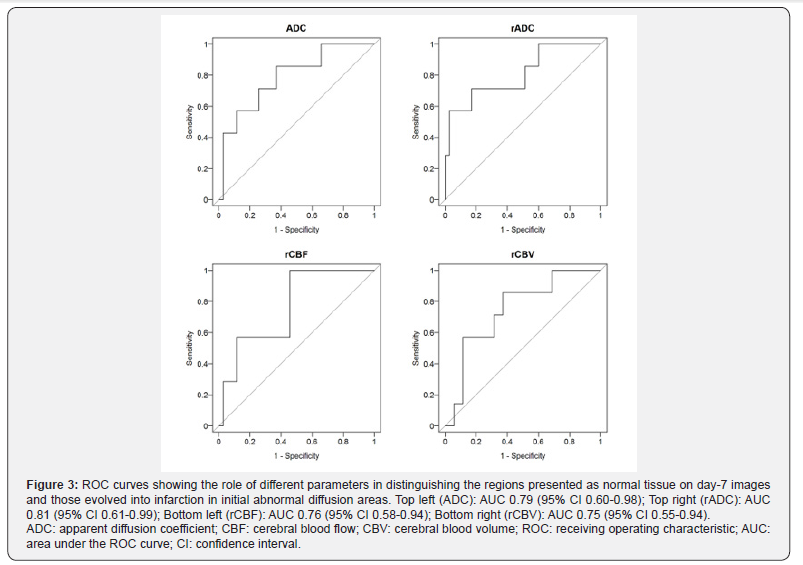
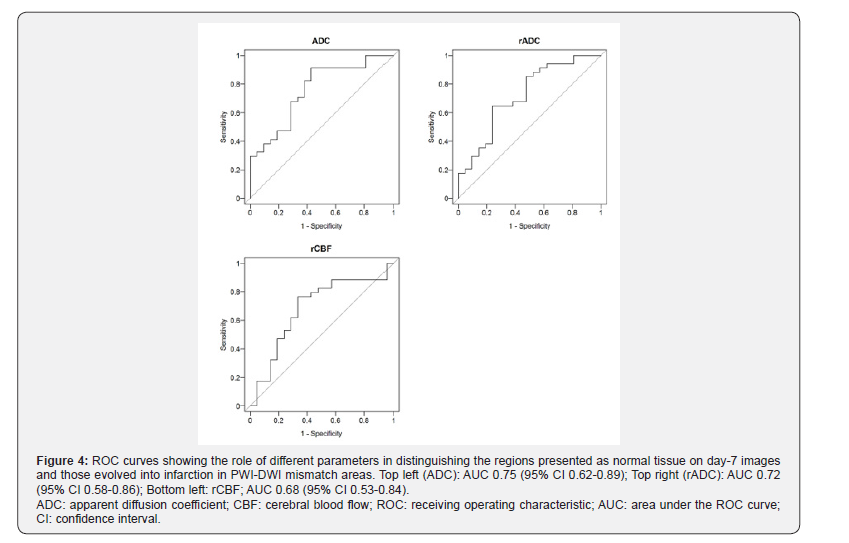
Results: 7/36 patients presented normalized tissue in initial abnormal diffusion areas. 34/36 patients had normalized tissue in perfusion-diffusion mismatch areas. In initial abnormal diffusion areas, the area under the curve of mean apparent diffusion coefficient (ADCmean), relative apparent diffusion coefficient (rADC), relative cerebral blood flow (rCBF) and relative cerebral blood volume (rCBV) were 0.79, 0.81, 0.76 and 0.75; the thresholds of 623×10-6 mm2/s, 0.80, 0.47 and 0.82 were selected to identify salvageable tissue, respectively. In mismatch areas, the area under the curve of ADCmean, rADC and rCBF were 0.75, 0.72 and 0.68, with thresholds of 785×10-6 mm2/s, 0.98 and 0.63 selected, respectively.
Conclusion: Our study suggested that ADC and rCBF were optimal candidates for tissue viability prediction in acute ischemic stroke, in both initial abnormal diffusion areas and perfusion-diffusion mismatch areas.
Keywords: Stroke; Magnetic resonance imaging; Diffusion Magnetic Resonance Imaging; Cerebrovascular Circulation; Tissue survival
Abbrevations: DWI: Diffusion-weighted Imaging; PWI: Perfusion-Weighted Imaging; ADC: Apparent Diffusion Coefficient; CBF: Cerebral Blood Flow; MTT: Mean Transit Time; NIHSS: National Institutes of Health Stroke Scale; CPP: Comitéde Protection des Personnes; CT: Computed Tomography
Introduction
MRI is increasingly used in ischemic stroke assessment. Diffusion-weighted Imaging (DWI) has been established as the most accurate technique for acute ischemic stroke diagnosis [1]. Perfusion-Weighted Imaging (PWI) may complete the stroke evaluation by providing tissue microcirculation information [2]. Ischemic penumbra is a region at the risk of infarction but still has the potential to be salvaged [3]. As the target of acute phase treatment, penumbra evaluation is of great clinical importance. PWI-DWI mismatch has been assumed to represent the penumbra and has been included as an evaluation index for patient selection in several clinical trials [4-7]. However, the substitution of penumbra by PWI-DWI mismatch remains uncertain. On the one hand, the initial DWI hyperintensity area consists not only the irreversibly damaged “core”, but also tissue at risk which could be salvaged if blood flow is restored at an early time point [8]. On the other hand, PWI abnormality often overestimate the penumbra by including oligemia [9]. Therefore, tissue viability should be assessed more precisely other than PWI-DWI mismatch.
Apparent Diffusion Coefficient (ADC) has been proposed to differentiate tissue at risk and the ischemic core. Purushotham et al. [10] suggested a threshold of 620×10-6 mm2/s for delineation of ischemic core. However, this point of view was challenged, previous study has demonstrated that the fate of tissue could not be predicted based on the ADC value alone [11]. Widely varied thresholds of different perfusion parameters were presented to evaluate tissue viability. Cerebral Blood Flow (CBF) ranged from 18 to 37 mL/100g/min and Mean Transit Time (MTT) ranged from 1.8 to 8.3 seconds relative to the contralateral side were reported to identify the tissue at risk [12]. A threshold of Tmax > 2s delay was demonstrated to be a reliable estimate of ischemic penumbra [13]. Currently, there is no consensus on MRI-based tissue viability thresholds in ischemic stroke.
In our study, we sought proper diffusion and perfusion parameters which could predict tissue viability in both initial abnormal diffusion areas and PWI-DWI mismatch areas. We analyzed acute ischemic stroke patients due to proximal intracranial arterial occlusion. These patients generally present more severe clinical symptoms and carry a worse prognosis, thus the treatment decision needs to be made properly and immediately.
Materials and Methods
Patient selection
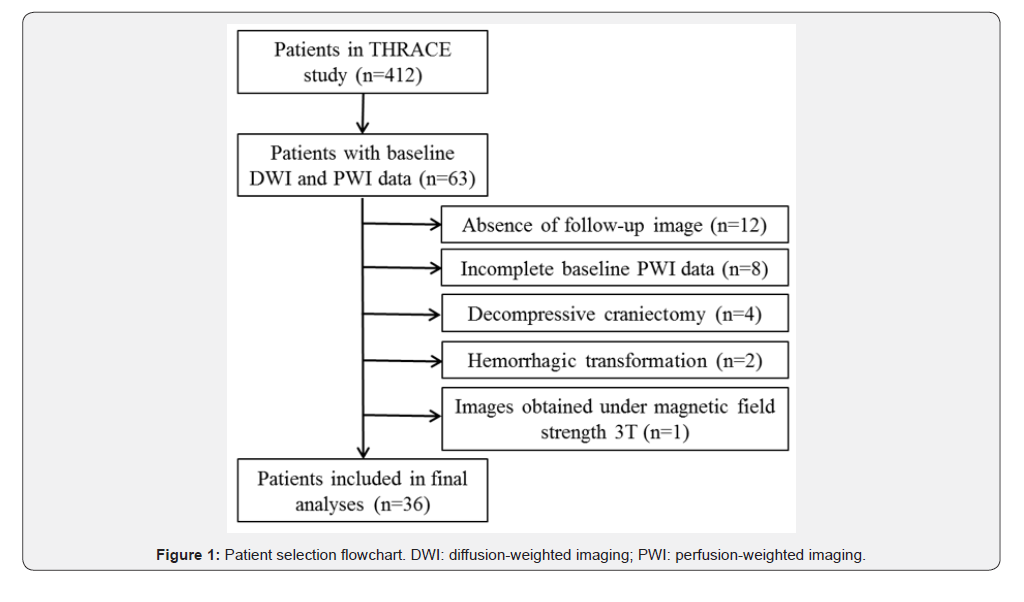
We analyzed patients in the THRACE study (Clinical Trial Registration-URL: http://www.clinicaltrials.gov. Unique identifier NCT01062698), a multicentric study in France underwent from 2009 to 2015, comparing intravenous thrombolysis plus mechanical thrombectomy and intravenous thrombolysis alone in patients with acute ischemic stroke due to proximal arterial occlusion, aged 18 to 80 years, and with a National Institutes of Health Stroke Scale (NIHSS) score of 10 to 25. The study design and patient inclusion criteria have been described in detail previously [14]. The study protocol was approved by the Comité de Protection des Personnes (CPP) III Nord Est Ethics Committee and the research boards of the participating centers. All patients or their legal representatives provided written informed consent. In this study, we included patients who received baseline MRI exam, including DWI, PWI, Fluid Attenuation Inversion Recovery (FLAIR) and time-of-flight MR angiography, followed by MRI or Computed Tomography (CT) on day-7. In 412 patients included in the THRACE study, 36 patients finally met the inclusion criteria of our work (Figure 1). Compare to the final sample, excluded patients were similar in terms of age, sex, baseline NIHSS score and time from stroke onset to imaging. All the included patients received intravenous thrombolysis; 12 patients also received an additional mechanical thrombectomy.
Imaging protocol
Imaging was performed according to the established local routine. MRI was performed on 1.5T MR Scanners (Signa HDxt, General Electric Healthcare, WI, USA; Intera/Achieva, Philips medical systems, Best, the Netherlands). The baseline DWI was performed using a single-shot, pulsed gradient spin echo sequence with echo planar imaging (EPI) read-out (b-value 0 and 1000s/mm2). The baseline PWI data were acquired after a bolus of intravenous gadolinium by using the dynamic susceptibility contrast technique and a single-shot, gradient echo EPI sequence. Day-7 FLAIR sequence was performed in 7 patients to assess the final infarction. The rest 29 patients were evaluated by CT. CT images were non-contrast-enhanced with reconstruction matrix 512×512, resolution 0.4×0.4×1.0mm3 ~ 0.4×0.4×2.5mm3. (LightSpeed VCT, GE medical system, WI, USA; SOMATOM Sensation 16, Siemens AG, Forchheim, Germany; Aquilion ONE, Toshiba, Japan). More details about MRI sequence parameters are listed in Table 1.

MRI: Magnetic Resonance Imaging; DWI: Diffusion-Weighted Imaging; PWI: Perfusion-Weighted Imaging; FLAIR: Fluid Attenuation Inversion Recovery. *: ranges of parameter values are presented.
Imaging data analysis
Baseline MRI and day-7 images from the same patient were co-registered by ORS® (Object Research Systems) Visual® (Montreal, Canada). An experienced neuroradiologist (with experience of reading stroke imaging >5 years, reader 1) checked all the registration results in order to ensure adequate alignment. Post processing of DWI and PWI data was performed in Olea Sphere® (Olea Medical SAS, La Ciotat, France). ADC maps were calculated based on DWI data. MTT, CBF, Cerebral Blood Volume (CBV) and Tmax (time to peak of the deconvolved tissue residue function) maps were calculated from PWI data. The experienced neuroradiologist (reader 1) and a junior neurologist (with experience of reading stroke imaging <5 years) (reader 2), blind to the clinical information, read all the images separately, and manually outlined the 2D abnormal regions on all the pathological slices of the post processed DWI and PWI data as well as registered day-7 images. The window level was set to its maximal visual extent of each volume. The criteria to define the abnormal regions in the images were
I. The abnormal hyperintense areas on baseline DWI which correspond to a decreased ADC value;
II. The hypo perfused tissue on baseline Tmax maps (Tmax > 6s), as proposed by previous study [13];
III. The abnormal hyperintensity on day-7 FLAIR images or hypodense areas on day-7 CT data. Baseline FLAIR images were used as references to solve the confusion brought by the “T2 shine-through” effect when delineating abnormal hyperintense areas on baseline DWI.
The PWI-DWI mismatch profile criteria corresponded to VolumePWI/VolumeDWI > 1.2 and VolumePWI - VolumeDWI ≥ 10mL, according to the criteria used in DEFUSE and EPITHET studies [5,6].
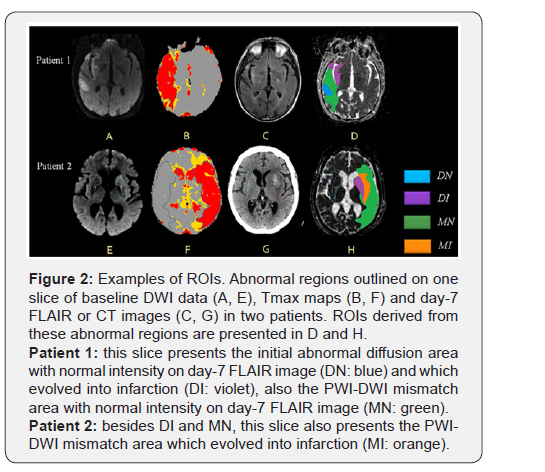
Four types of Regions Of Interest (ROIs) were derived from the above mentioned abnormal regions the initial abnormal diffusion areas which appeared as normal tissue on day-7 image (DN) and which evolved into infarction (DI), the PWI-DWI mismatch areas which appeared as normal tissue on day-7 image (MN) and which evolved into infarction (MI). For each types of ROI, mirror regions were drawn in the contralateral hemisphere. All the voxels with ADC < 200×10-6 mm2/s or > 1200×10-6 mm2/s were considered as artifacts or cerebrospinal fluid and were eliminated. Examples of the ROIs were illustrated in (Figure 2).
Antifungal resistance
Mean value of ADC (ADCmean), MTT (MTTmean), CBV (CBVmean) and CBF (CBFmean) were calculated for each ROI and the symmetric regions. By dividing the values in each ROI and their corresponding symmetric region, the lesion-contralateral ratios (rADC, rMTT, rCBV and rCBF) were obtained. Parameters in ROIs evolving into infarction on day-7 image were compared with those which did not.
Receiving operating characteristic (ROC) curve analysis
ROC curves of parameters which presented significant difference in ROI-based comparison were plotted, in initial abnormal diffusion areas and in mismatch areas separately. Area under the ROC curve (AUC) was calculated for each parameter. The optimal parameter thresholds distinguishing the regions evolved into infarction and which normalized were selected.
Statistical analysis
Categorical variables were presented as proportions; continuous variables were tested for normality and presented as mean ± SD if normally distributed, or as median and interquartile range (IQR) if not. Comparisons of ROI-based parameter values were performed by Wilcoxon test. P-values were two-sided and p=0.05 was chosen as the significance level. ROC curves were plotted by R package pROC [15]. The optimal parameter thresholds were determined by Youden index [16]. To evaluate the reproducibility of two readers, we calculated the intraclass correlation coefficient of ADCmean in each category of ROI. Statistical analyses were performed using statistical software R (R Foundation for Statistical Computing, Vienna, Austria).
Results
The included 36 patients were composed of 14 women and 22 men with median age of 71 (IQR 59-77) years. The baseline characteristics were presented in Table 2. 7/36 (19.4%) patients had DN tissue, with a volume of 5.29 (IQR 3.35-8.39) mL (i.e. 5.6% of the initial diffusion abnormal areas). 34/36 (94.4%) patients presented MN tissue, with a volume of 44.34 (IQR 31.02-61.22) mL (i.e. 72.6% of the mismatch areas).
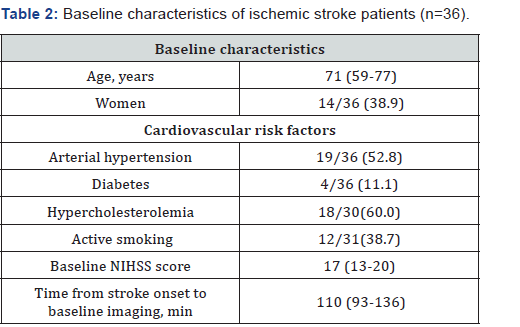
Continuous variables are presented as median (interquartile range); categorical variables are presented as no. (%). NIHSS: National Institutes of Health Stroke Scale.
ROI-based parameter value comparison
Intraclass correlation coefficient of ROI-based ADCmean between two readers was 0.98 with 95% confidence interval (CI) 0.96-0.99. Accordingly, the following results are based on measurements obtained by reader 1. ADCmean, rADC, rCBF and rCBV were significantly different between DI and DN: ADCmean was 617.14±54.74×10⁻⁶ mm2/s in DI and 677.21±65.67×10- 6 mm2/s in DN (p=0.02); rADC was 0.76±0.05 and 0.84±0.08 respectively (p=0.01); rCBF was 0.49±0.15 and 0.63±0.14 respectively (p=0.03); rCBV was 0.80±0.32 and 1.04±0.28 respectively (p=0.04). ADCmean, rADC and rCBF were significantly different in MI and MN: ADCmean was 783.04±37.40×10⁻⁶ mm2/s in MI and 821.99±39.73×10⁻⁶ mm2/s in MN (p=0.001); rADC was 0.95±0.05 and 0.99±0.04 respectively (p=0.01); rCBF was 0.63±0.18 and 0.71±0.16 respectively (p=0.02). The other parameters showed no significant differences. Results are listed in Table 3.

ROI: Region of interest; DI: the initial abnormal diffusion areas which evolved into infarction on day-7 image; DN: the initial abnormal diffusion areas which appeared as normal tissue on day-7 image; MI: the PWI-DWI mismatch areas which evolved into infarction on day-7 image; MN:the PWI-DWI mismatch areas which appeared as normal tissue on day-7 image; CI: confidence interval; Parameter values are presented asmean ± SD;*: p value<0.05.
ROC curve analysis
ROC curves of parameters in initial abnormal diffusion areas and PWI-DWI mismatch areas are presented in Figure 3 & Figure 4. AUC of each parameter and thresholds calculated by Youden index for distinguishing the salvageable tissue are listed in Table 4 & Table 5.

AUC: Area under the ROC curve; CI: confidence interval.

AUC: Area under the ROC curve; CI: confidence interval
Discussion
The role of MRI in tissue viability prediction in acute ischemic stroke is promising. It can help the clinicians to select appropriate patients for treatment. Our work investigated tissue viability in both initial abnormal diffusion areas and PWIDWI mismatch areas and suggested that ADC and rCBF may be optimal candidate for tissue viability prediction.
Tissue viability in initial abnormal diffusion areas
Combined Positron Emission Tomography (PET)-MRI studies have suggested that DWI lesions reflect variable metabolic disruption, thus may not always represent irreversibly damaged tissue [17]. The proportion of patients presenting normalization of abnormal diffusion areas (19.4%) was close to another study (19.7%)8, but lower than 50% demonstrated by Labeyrie et al. [18] and 67% reported by Loh et al. [11]. The proportion of initial diffusion abnormal area presenting normalization (5.6%) was lower than 11% reported by Labeyrie et al. [18] Recent animal study also demonstrated a higher proportion of diffusion lesion reversal (8.3-51.9% for early reversal and 41.7-77.8% for sustained reversal) [19].
Both diffusion and perfusion parameters showed relevance in distinguishing the regions that evolved into infarction with those which did not. The effective role of ADC value was in line with the previous results [8,10,20] ROC analysis showed that rADC and ADCmean are the most promising parameters. The optimal ADCmean threshold was in accordance with Purushotham’s study who proposed 620×10-6 mm2/s, although voxel-based method was used by them [10]. The rADC threshold of 0.80 determined in our study was similar to the result of an animal study, in which rADC of 0.77 was decided as a good estimate for the breakdown of energy metabolism [21].
PWI parameters were investigated in previous studies for their potential value to predict tissue viability in DWI lesions. Carrera et al. proposed that MTT may improve infarction prediction within DWI lesions [22] While another study presented that CBV maps could not reliably substitute for DWI in identifying the infarct core [23]. Nevertheless, these studies only assessed one parameter. Our results indicated that the prediction of initial abnormal diffusion tissue destiny could be improved by applying rCBF or rCBV thresholds. Voxel-based analyses on large sample studies are needed to confirm the role of PWI parameters in ischemic core assessment.
Tissue viability in PWI-DWI mismatch areas
The introduction of PWI-DWI mismatch as a surrogate marker of penumbra has opened a new perspective in stroke imaging. Compared to initial abnormal diffusion areas, higher frequency of normalization in mismatch areas in our cohort could be explained by stroke pathophysiology. DWI lesions occurred in regions of maximal perfusion deficit and thus had less opportunity for recovery [24]. Previous comparative PETMRI studies detected different PWI parameters for estimating penumbral flow thresholds, Tmax (> 5.5 seconds), CBF (< 21.7 mL/100g/min) and time to peak (TTP, > 4.2 seconds) have been proposed. [25,26] Numerous thresholds for distinguishing tissue “at risk” and “not at risk” were presented without consensus, with rCBF value ranged from 0.58 to 0.61,12 which was similar with the value suggested in our study (0.63).
The role of ADC value was usually investigated within DWI lesion. Our results revealed that ADC could also be implicated in the prediction of tissue viability in mismatch area, even better than perfusion derived parameters. Our results was similar with previous study which proposed a ADC threshold of 803 ×10-6 mm2/s as the best discriminator for viable tissue in mismatch area [20]. ADC is a quantitative measurement of water diffusion, which decreases at the acute phase of stroke because of a net shift of water from the extracellular to intracellular space. We could infer that PWI-DWI mismatch area also present various degrees of decreased ADC value, but without evident intensity alteration on DWI.
Our study has the following limitations. Firstly, CT was used in the majority of our patients to evaluate the final infarct. Although tracing the abnormal hypodensity manually on CT was reported to be reproducible in measuring infarct volume, [27] it would be more precise using MRI. Secondly, our sample is rather small, and the imaging parameters are heterogeneous. The primary objective of THRACE study was the evaluation of stroke treatment and imaging was done according to the established local routine. In our sub-study we only focused on patients who had baseline DWI and PWI and follow-up day-7 images. The variation of imaging parameter could be a source of bias; on the other hand, it approaches the real situation of clinical practice. Thirdly, tissue viability was analyzed regardless of other confounding factors, such as collateral circulation and reperfusion status, due to the absence of angiography for patients in intravenous thrombolysis group. Lastly, metabolic status is different between brain compartments, with white matter more resistant to ischemia than grey matter [28,29]. Considering them separately could improve the accuracy of viable tissue identification.
Conclusion
Our study proposed that ADC and rCBF may be optimal candidates in predicting tissue viability in acute ischemic stroke. Tissue with higher ADC value and higher rCBF value tended to normalize in initial abnormal diffusion areas and in PWI-DWI mismatch areas.
Acknowledgement
We thank Mr. Emilien MICARD and Mr. Romain CENDRE for technical support. We thank all the THRACE investigators. Yu Xie is sponsored by the China Scholarship Council.
Author Contribution
YX, GH, SB contributed to the conception and design of the study. Acquisition and analysis of data were performed by YX, LL, FG, BC, JF, GH, SB. YX, LL, FG, BC, JF, GH, SB drafted text and/ or prepared figures.
References
- Edlow JA (2011) Evidence-based guideline: the role of diffusion and perfusion MRI for the diagnosis of acute ischemic stroke: report of the Therapeutics and Technology Subcommittee of the American Academy of Neurology. Neurology 75(2): 2036.
- Campbell BCV, Macrae IM (2015) Translational perspectives on perfusion-diffusion mismatch in ischemic stroke. Int J Stroke 10(2): 153-162.
- Astrup J, Siesjö BK, Symon L (1981) Thresholds in cerebral ischemia - the ischemic penumbra. Stroke. 12(6): 723-725.
- Ma H, Wright P, Allport L, Phan TG, Churilov L, et al. (2015) Salvage of the PWI/DWI mismatch up to 48 h from stroke onset leads to favorable clinical outcome. Int J Stroke. 10(4): 565-570.
- Albers GW, Thijs VN, Wechsler L, Kemp S, Schlaug G, et al. (2006) Magnetic resonance imaging profiles predict clinical response to early reperfusion: the diffusion and perfusion imaging evaluation for understanding stroke evolution (DEFUSE) study. Ann Neurol 60(5): 508-517.
- Davis SM, Donnan GA, Parsons MW, Levi C, Butcher KS, et al. (2008) Effects of alteplase beyond 3 h after stroke in the Echoplanar Imaging Thrombolytic Evaluation Trial (EPITHET): a placebo-controlled randomised trial. Lancet Neurol 7(4): 299-309.
- Albers GW, Marks MP, Kemp S, Christensen S, Tsai JP, et al. (2018) Thrombectomy for Stroke at 6 to 16 Hours with Selection by Perfusion Imaging. N Engl J Med 378(8): 708-718.
- Fiehler J, Knudsen K, Kucinski T, Kidwell CS, Alger JR, et al. (2004) Predictors of apparent diffusion coefficient normalization in stroke patients. Stroke 35(2): 514-519.
- Sobesky J, Zaro Weber O, Lehnhardt F-G, Hesselmann V, Neveling M, et al. (2005) Does the mismatch match the penumbra? Magnetic resonance imaging and positron emission tomography in early ischemic stroke. Stroke 36(5): 980-985.
- Purushotham A, Campbell BCV, Straka M, Mlynash M, Olivot JM, et al. (2015) Apparent diffusion coefficient threshold for delineation of ischemic core. Int J Stroke. 10(3): 348-353.
- Loh PS, Butcher KS, Parsons MW, MacGregor L, Desmond PM, et al. (2005) Apparent diffusion coefficient thresholds do not predict the response to acute stroke thrombolysis. Stroke 36(12): 2626-2631.
- Dani KA, Thomas RGR, Chappell FM, Shuler K, MacLeod MJ, et al. (2011) Computed tomography and magnetic resonance perfusion imaging in ischemic stroke: Definitions and thresholds. Ann Neurol 70(3): 384-401.
- Olivot J-M, Mlynash M, Thijs VN, Kemp S, Lansberg MG, et al. (2009) Optimal Tmax threshold for predicting penumbral tissue in acute stroke. Stroke 40(2): 469-475.
- Bracard S, Ducrocq X, Mas JL, Soudant M, Oppenheim C, Moulin T, et al. (2016) Mechanical thrombectomy after intravenous alteplase versus alteplase alone after stroke (THRACE): a randomised controlled trial. Lancet Neurol 15(11): 1138-1147.
- Robin X, Turck N, Hainard A, Tiberti N, Lisacek F, et al. (2011) pROC: an open-source package for R and S+ to analyze and compare ROC curves. BMC Bioinformatics 12: 77.
- Youden WJ (1950) Index for rating diagnostic tests. Cancer 3(1): 32-35.
- Guadagno JV, Warburton EA, Jones PS, Day DJ, Aigbirhio FI, et al. (2006) How affected is oxygen metabolism in DWI lesions?: A combined acute stroke PET-MR study. Neurology 67(5): 824-829.
- Labeyrie M-A, Turc G, Hess A, Hervo P, Mas JL, et al. (2012) Diffusion lesion reversal after thrombolysis: a MR correlate of early neurological improvement. Stroke 43(11): 2986-2891.
- Yi KS, Choi C-H, Lee S-R, Lee HJ, Lee Y, et al. (2017) Sustained diffusion reversal with in-bore reperfusion in monkey stroke models: Confirmed by prospective magnetic resonance imaging. J Cereb Blood Flow Metab 37(6): 2002-2012.
- Oppenheim C, Grandin C, Samson Y, Smith A, Duprez T, et al. (2001) Is there an apparent diffusion coefficient threshold in predicting tissue viability in hyperacute stroke? Stroke 32(11): 2486-2491.
- Olah L, Wecker S, Hoehn M (2001) Relation of apparent diffusion coefficient changes and metabolic disturbances after 1 hour of focal cerebral ischemia and at different reperfusion phases in rats. J Cereb Blood Flow Metab 21(4): 430-439.
- Carrera E, Jones PS, Alawneh JA, Klærke Mikkelsen I, Cho TH, et al. (2011) Predicting infarction within the diffusion-weighted imaging lesion: does the mean transit time have added value? Stroke 42(6): 1602-1607.
- Deipolyi AR, Wu O, Macklin EA, Schaefer PW, Schwamm LH, et al. (2012) Reliability of cerebral blood volume maps as a substitute for diffusion-weighted imaging in acute ischemic stroke. J Magn Reson Imaging 36(5): 1083-1087.
- Darby DG, Barber PA, Gerraty RP, Desmond PM, Yang Q, et al. (1999) Pathophysiological Topography of Acute Ischemia by Combined Diffusion-Weighted and Perfusion MRI. Stroke 30(10): 2043-2052.
- Zaro-Weber O, Moeller-Hartmann W, Heiss W-D, Sobesky J (2010) MRI Perfusion Maps in Acute Stroke Validated With 15O-Water Positron Emission Tomography. Stroke 41(3): 443-449.
- Zaro-Weber O, Moeller-Hartmann W, Heiss W-D, Sobesky J (2010) Maps of Time to Maximum and Time to Peak for Mismatch Definition in Clinical Stroke Studies Validated with Positron Emission Tomography. Stroke 41(12): 2817-2821.
- van der Worp HB, Claus SP, Bär PR, Ramos LM, Algra A, et al. (2001) Reproducibility of measurements of cerebral infarct volume on CT scans. Stroke 32(2): 424-430.
- Tisserand M, Malherbe C, Turc G, Legrand L, Edjlali M, et al. (2014) Is White Matter More Prone to Diffusion Lesion Reversal After Thrombolysis? Stroke 45(4): 1167-1169.
- Chen C, Bivard A, Lin L, Levi CR, Spratt NJ, et al. (2017) Thresholds for infarction vary between gray matter and white matter in acute ischemic stroke: A CT perfusion study. J Cereb Blood Flow Metab 39(3): 536-546.


