A Novel Mitophagy Assay for Skeletal Myotubes
Michael Webb*, Jyoti Malhotra, Chui-Se Tham, Matthew Goddeeris, Douglas W McMillin and Effie Tozzo
Mitobridge Inc, USA
Submission: April 25, 2017;Published: July 20, 2017
*Corresponding author: Michael Webb, Mitobridge Inc, 1030 Massachusetts Avenue, MA 02138 Cambridge, USA, Email: mwebb@mitobridge.com
How to cite this article: Michael W, Jyoti M, Chui-Se T, Matthew G, Douglas W M, et al. A Novel Mitophagy Assay for Skeletal Myotubes. Open Access J Neurol Neurosurg. 2017; 4(5): 555649. DOI: 10.19080/OAJNN.2017.04.555649
Abstract
We developed a simple ELISA technique as a quantitative in vitro assay for mitophagy in post mitotic skeletal muscle cells. We labeled the mitochondrial DNA of C2C12 myotubes cells by allowing incorporation of the thymidine analogue bromodeoxyuridine (BrdU) and following the decay of the label with time under basal and stimulated conditions. BrdU was incorporated into differentiated C2C12 myotubes at significant levels only after pharmacological treatment was used to increase the rate of mtDNA synthesis. PGCla transduction, stimulation of AMPK, or inhibition of ERK1/2, all previously reported to increase the rate of mtDNA synthesis, induced BrdU incorporation at 4-10 fold over background during a 2 hour incorporation period. Using AMPK stimulation to stimulate initial DNA labeling we confirmed by both microscopy and cytometry methods that BrdU was incorporated into mitochondria and not into nuclei. After removal of the BrdU, the level of label in cells declined to approximately 25% by 24 hours and returned to background levels by 48 hours. The membrane depolariser carbonyl cyanide m-chlorophenyl hydrazone (CCCP; (10um) accelerated this decline, such that at 6 hours BrdU signal was reduced by 70-100%. 24 or 48 hours of pretreatment with bafilomycin, a pharmacological inhibitor of early endosome acidification, partially reversed the CCCP stimulated loss of BrdU, and we confirmed by confocal microscopy that the BrdU in bafilomycin treated cells localized with LC3, a marker of early endosomes. Finally, we showed that treatment with urolithin, previously reported to inhibit mitophagy at high concentrations, showed a dose responsive inhibition of BrdU signal loss with a maximum of about 50% at 50uM. This assay represents a robust and simple method to evaluate agents accelerating mitophagy in postmitotic cells.
Keywords: Mitochondria; Mitophagy; Myotube; Bromodeoxyuridine
Background
In addition to their roles as provider of energy and reducing equivalents, in the form of ATP, NADH and NADPH, mitochondria also supply essential biochemical substrates for a variety of biosynthetic pathways and communicate actively with the host cell. This communication involves calcium ions and reactive oxygen species, which have an essential signaling role at lower concentrations than those typically associated with cell damage [1,2]. Nevertheless, mitochondria accumulate oxidative damage as an inevitable result of the activity of the electron transport chain [3]. An elaborate cycle of fusion and fission events which characterize the active life of mitochondria is thought to prolong the useful lifetime of mitochondrial components by distributing damaged components between older and younger mitochondria[4] , but beyond a certain threshold, mitochondria become dysfunctional, lose their membrane potential, and are removed by an active process called mitophagy. Mitochondria cannot be formed de novo, and the size of the mitochondrial pool is maintained by a process in which newly synthesized components (DNA, proteins and lipids), are added to existing mitochondria, which divide by a process of fission. Together with the distribution of newly synthesized mitochondrial components by fusion and removal of dysfunctional mitochondria by mitophagy, this process maintains the health of the mitochondrial pool.
It has been recognized increasingly in recent years that defects in the dynamic mechanisms of biogenesis, fission / fusion, and mitophagy, underlie many different disease processes [5] . The causative nature of these defects is suggested by various pathologies specifically associated with genetic defects in mitochondrial DNA and reflected in altered dynamics, and in the association of altered mitochondrial dynamics with many pathologies not specifically linked to mtDNA mutations. As the molecular mechanisms underlying biogenesis, fission / fusion and mitophagy become better characterized, they are likely to reveal therapeutic targets applicable to specific disease states.
These considerations indicate the value of reliable and robust assays to assess the different mechanisms contributing to the overall dynamic regulation of mitochondria. Mitochondrial biogenesis is usually measured by comparing the mass of some mitochondrial component (e.g. mtDNA, 16S mt-rRNA, mitochondrially located enzymes such as citrate synthase, or components of the electron transport chain such as cytochrome oxidase) with a marker of cytoplasmic mass, such as cytoplasmic 18S-rRNA, or housekeeping enzymes. These assays are widely used and of some utility, but they rely on steady-state state mass measurements, and are therefore likely to be insensitive to rate changes in biogenesis if these are accompanied by up-regulated mitophagy.
Mitophagy has typically been studied by microscopic methods, either electron microscopy that can directly reveal the containment of mitochondria within phagosomal structures, or fluorescence microscopy. The latter techniques rely on the co-localisation of markers of mitochondria and endosomes, or on the change of fluorescence properties of a mitochondrially targeted fluorophore when it moves to an acidic compartment such as an endosome (pH typically ~5-5.5). The use of the reporter Rosella in yeast cells was one of the first descriptions of this approach [6], and a recent sophisticated adaptation of the principle was described by McWilliams et al. [7], who constructed mutant mice expressing a doubly fluorescent GFP- mCherry construct, the GFP signal being lost on transition to the endosome, while mCherry fluorescence remains intact. Keima is another fluorescent probe that changes its properties upon transition to an acidic compartment, and this has also been used for microscopy-based assessment of mitophagy both in vitro [8] and in vivo [9]. A recent paper described the use of Mitotracker Red in conjunction with lysosomal inhibitors to measure mitophagic flux by flow cytometry [10].
These approaches require either fluorescence microscopy or cytometry and are relatively low throughput. In addition, some require the transfection of the reporter construct or the construction of stable cell lines expressing it. In our studies on the mitochondrial dynamics of skeletal muscle cells, we sought a simple, robust and higher throughput technique that would allow quantitation of mitophagy in these cells without the requirement for microscopy or cytometry. Previous work has used the incorporation of the thymidine analogue bromodeoxyuridine to label newly synthesised mitochondrial DNA [11,12]. In this study, we used an adaptation of this method to develop a quantitative ELISA assay for mitophagy applicableto differentiated skeletal muscle and potentially to other post-mitotic cells.
Materials and Methods
Cell culture
Human myoblasts from Duchenne Muscular Dystrophy patients were obtained from DV Biologics. C2C12 myoblasts were obtained from ATCC. Both cell types were cultured in DMEM (Invitrogen 11965-118) containing 4.5gm/L Glucose, 4mM Glutamine, 1mM Sodium Pyruvate and 10% heat inactivated foetal bovine serum for routine growth. For ELISA based detection of incorporated bromodeoxyuridine, they were plated in 96 well plates 1 day prior to initiating differentiation at a density of 105 / well in 100ul of growth medium; for other plate formats they were plated at 3x10⁵ per well of 48 well plates (250ul) or 6 x 10⁵/ well in 6 well plates (1ml). Cells were changed to differentiation medium (formulation as growth medium, but foetal bovine serum replaced with 2% horse serum) the following day, at which point the confluency was close to 100%. Differentiation was monitored microscopically daily, with medium changes at days 2 and 4. Where appropriate drug or gene transduction experiments were initiated after 3 days of differentiation, and assays were conducted at day 6, by which time the cells had morphologically transformed into multinucleate myotubes and nuclear DNA synthesis was absent. Stable transfectants of Hela expressing parkin were constructed in house.
Viral gene transduction and compound treatments
An adenoviral vector encoding PGCla was obtained from Vector Biolabs. Cells were exposed to virus at varying multiplicities of infection (Mol) for 72 hours prior to assay, at which point cells had been differentiating for 3days. Preliminary titrations were carried out to determine the optimal transfection level.
To stimulate mtDNA synthesis acutely, cells were exposed to either an activator of AMP-kinase or an inhibitor of ERK 1/2 for 2hours prior to BrdU exposure on the day of assay as indicated in the text. Further treatments were applied after removal of the BrdU. Carbonyl cyanide m-chlorophenylhydrazone (CCCP) was used at a concentration of 20uM to stimulate membrane depolarisation and mitophagy. Where used, Bafilomycin, an inhibitor of early endosome acidification [13], was applied for either 48 or 24 hours prior to assay, and was retained in all media changes during DNA labeling and subsequent CCCP treatments.
Compounds and antibodies
Carbonyl cyanide m-chlorophenylhydrazone (CCCP), the ERK inhibitor U2016 and bafilomycin were from Sigma Chemical Company. The AMPK activator described Xiao et al. [14] and referred to as compound 991 was synthesised in house. Tetramethylrhodamine (TMRE) was from Thermo Fisher Scientific, cataloguenumber T669. Anti-COX IV monoclonal antibody clone 3E11 was from Cell Signaling Technology, anti- T0M20 from Santa Cruz (catalogue number sc11415) and fluorescently labelled second antibodies were from Molecular probes.
ELISA protocol
We used a bromodeoxyuridine incorporation assay kit (Roche catalogue 11-647-229-001) with modifications to detect incorporation into mitochondrial DNA. Cells were grown and differentiated in 96 well plates as described above, with appropriate drug treatments as described in the text. On the day of assay (day 6 of differentiation) cells were exposed to BrdU (Roche) at a final concentration of 10uM for 2 hours, following which the labeling medium was removed and the cells washed three times in washing buffer provided in the Roche kit. Cells were then treated with vehicle control or indicated compounds for varying periods as indicated in the text. At required time points, cells were fixed by incubation for 20 minutes at -20 °C in 50mM glycine-HCl (pH 2.0) containing 70% ethanol and washed again in wash buffer after which they were incubated with anti- BrdU antibody (Roche 11296736001,1:100) overnight at 4 °C. Cells were washed 3times with 1x kit wash buffer, following which either the standard kit protocol was followed (addition of Biotin labelled goat IgG for 90 minutes), or a biotinylated goat anti-mouse IgG was added (AbCamcatalaogueab6788, 1:100) for 60 minutes, followed by strepatavidin conjugated horseradish peroxidase (AbCam catalogue ab7403, 1: 10,000) for 60 minutes. After washing the final incubates from either procedure 3 times with wash buffer, bound antibody was detected using 100ul / well of tetramethylbenzidine (TMB) substrate for 10 minutes, the reactions were stopped with 2M sulphuric acid, and quantitated by reading OD450 in a plate reader.
Imaging Format
C2C12 cells were grown at 10,000 cells/ well overnight in growth medium, following which medium was replaced with differentiation medium, and the cells cultured for a further three days. They were then were transduced with adenoviral vectors encoding PGC1a and Lac Z at varying multiplicities of infection (Mol) from 200MoI for 72 hours. In other experiments, AMPK stimulation was carried out for 2 hours on the day of assay. In either paradigm, cells at day 6 were allowed to incorporate BrdU for 2 hours, following which they were washed three times in kit washing buffer. They were fixed as above in glycine-HCl, washed again and exposed overnight to anti-BrdU antibody as above. After washing three times, they were exposed to fluorescein labeled anti mouse Ig secondary antibody for 1 hour and washed three times, following which nuclei were counterstained with DAPI, and after final washing they were viewed under a confocal microscope under antifade solution.
Flow cytometry
Hela cells stably transfected with parkin were cultured in MEM (Corning Cellgro 17-305-CV) medium supplemented with 10% Fetal Bovine serum (FBS), 1X non-essential amino acids (Gibco 11140-050), and 1mM sodium pyruvate (Gibco 11360070). Cells were plated in duplicate plates and treated with or without 20uM CCCP (Tocris 0452) for 0.5, 2, 6, 16 or 22 hours. In one condition, cells were treated for 6 hours with CCCP and then replaced with complete growth medium to 22 hours. Cells were stained with either TMRE or with COX IV antibody. For TMRE staining, cells were pre-incubated in serum free, phenol free medium for 15 minutes followed by addition of 600nM TMRE to a final 300nM solution. Cells were incubated for further 15 minutes, then trypsinised and resuspended in 2% FBS in phosphate buffer (PBS). Samples were analysed using the MACSQuant VYB flow cytometer and data were quantified by Flowjo 7.6.5 software. In duplicate sample plates, cells were trypsinised and fixed in 4% paraformaldehyde in PBS, permeabilized with cold methanol for 10 minutes at -200C. Cells were washed 3times in PBS and subsequently incubated in rabbit anti-COX IV monoclonal antibody (clone 3E11, 1:100; 4850 Cell Signaling Technology) in the presence of 5% FBS, 0.1% Triton X-100 in PBS for 1 hour at room temperature (RT). Secondary antibody goat anti-rabbit IgG (H+L) conjugated to Alexa Fluor 488 (1:800; A11034 Molecular Probes) was added for 30 minutes at RT. Cells were then washed and resuspended in PBS. Detection of COX IV mean fluorescence intensity was analysed by flow cytometry as described above.
Mitochondrial isolation and staining of BrdU and TOM20
Mitochondria from Hela cells were isolated using mitochondrial isolation kit (Abcam ab110170), initial homogenisation being carried out with a 2ml Dounce homogenizer. Isolated mitochondria were incubated with TOM2Ü (1:100; Santa Cruz sc11415) for 1 hour at room temperature followed by Alexa Fluor 647 labeled goat anti-rabbit IgG antibody (1:500; Molecular Probes A21245) for 30 minutes. Samples were then fixed and labeled with BrdU antibody as provided by Roche (11296736001) incubated overnight at 40C, followed by Alexa Fluor 488 labeled goat anti-mouse IgG (Molecular Probes A11029) for 30 minutes at room temperature. Labeled mitochondria were subsequently analysed by flow cytometry as described above.
Statistics
Statistical analysis was carried out using Graph Pad Prism. Details of specific procedures are given in Figure legends.
Results
Labeling mitochondrial DNA by stimulated incorporation of BrdU
In dividing cells, mitochondrial DNA synthesis represents less than 1% of the total DNA synthesis, but in post mitotic cells such as neurons and skeletal myotubes, mitochondrial DNA synthesis continues (as the mitochondrial life cycle does not halt with the cessation of cell division). By allowing biosynthetic incorporation of the thymidine analogue BrdU into newly synthesized mitochondrial DNA, we were able to produce a population of labelled mitochondria whose disappearance via mitophagy could be followed after the labelling period. Immunological controls lacked either antigen (BrdU) or primary (anti-BrdU) antibody, and thus defined the background of the assay.
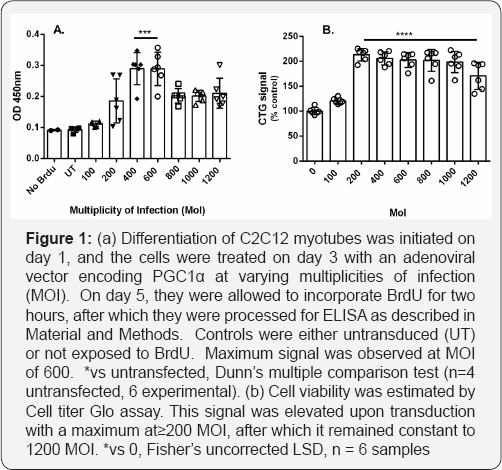
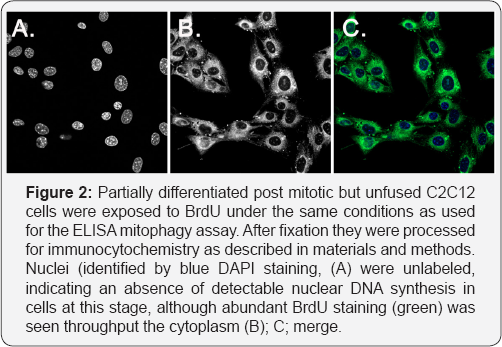
Exposure of differentiated myotubes to BrdU for 2 hours in the absence of any pharmacological treatments did not lead to BrdU incorporation above these background levels. We therefore used several different methods of stimulating mtDNA synthesis, including transduction of the master regulator of mitochondrial biogenesis, PGC1α [15,16]. In initial studies using human myotubes derived from a Duchenne Muscular Dystrophy patient, PGC1α adenoviral vector was transduced into the cells on day 3 after initiating differentiation, and a 2hour pulse of BrdU administered at 5 days. Using a kit based method with ELISA detection and no additional signal amplification, we saw a threefold increase of signal with viral multiplicities of infection (MoI) between 400 and 600 (Figure 1). This was reduced at higher MoI, but this did not appear to be due to loss of viability, as we observed an increased ATP signal rather than a decrease even at a MoI of 1200 (Figure 1B); this may reflect an increased ATP synthesis capacity which would not be an unexpected response to PGC1α activation. This suggests that the stimulation achieved by a MoI of 600 was the maximum of which the system is capable, and this is not limited by toxicity. This multiplicity of infection (600) was used in later experiments as a positive control by which to calibrate the stimulation produced by pharmacological treatments. We then showed that partially differentiated and post-mitotic though not fused skeletal myocytes of the mouse cell line C2C12, incorporated BrdU into cytoplasmic structures, while nuclei were not labeled and were visible as dark shadows (Figure 2a). These data essentially replicate findings originally published by Magnusson et al. [17].
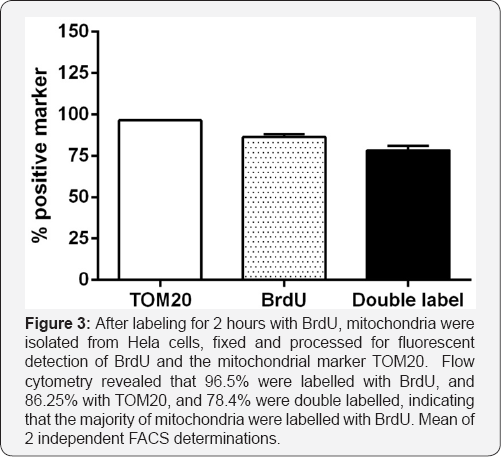
We confirmed that mitochondria were indeed labelled by BrdU by physically isolating mitochondria and staining them with antibodies to BrdU and the outer mitochondrial membrane protein TOM20. Flow cytometric analysis indicated that 96.5% of the purified mitochondria were labeled with TOM20, and 86.5% with BrdU antibodies, while 78.4% were labelled with both markers. This indicates that a majority of the mitochondria isolated had incorporated BrdU during the labelling period. Thus, in this post mitotic system, we are confident of the mitochondrial localisation of the incorporated BrdU.
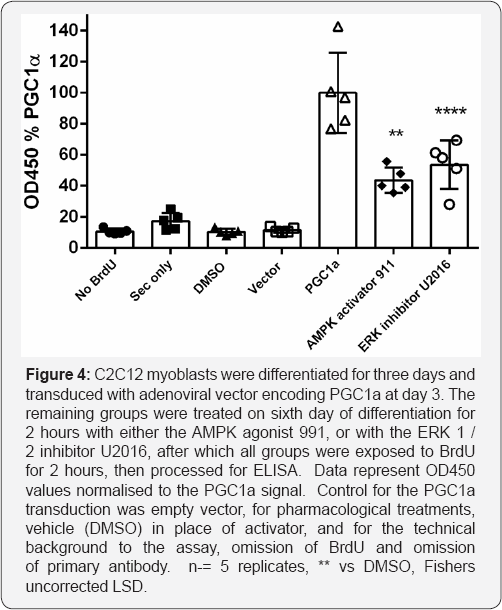
Viral transduction is not the most convenient way to stimulate mitochondrial DNA synthesis. We therefore examined 2 pharmacological treatments previously shown or expected to stimulate synthesis of mitochondrial DNA (Figure 3). These were AMPK activation [18-20] and ERK inhibition [21,22]. Both AMPK stimulation and ERK inhibition induced substantial BrdU incorporation in this system after a 2 hour pretreatment, followed by the 2hour BrdU incorporation period (Figure 3).
When normalised against the level of incorporation given by PGCIa transduction, the AMPK activator 991 at 10uM resulted in 43.7% stimulation while the ERK inhibitor U2016 (also at 10uM) resulted in 53.7 % stimulation. For all remaining mitophagy experiments described in this manuscript, we used the AMPK activator 991 at 10uM for 2 hours to stimulate differentiated C2C12 myotubes cultured for 5 days.
Mitophagy assay using BrdU incorporation
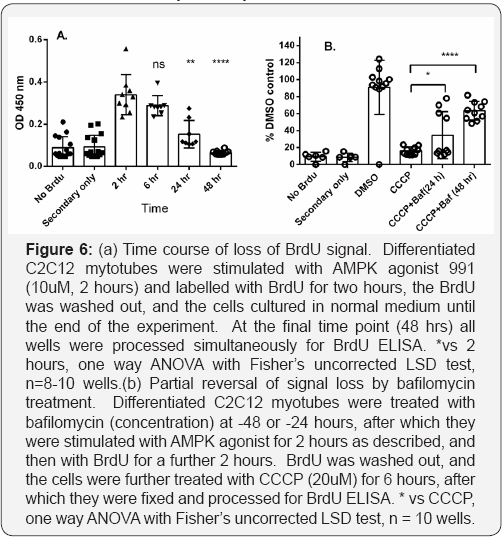
We used the decrease in BrdU labeling with time, as a measure of the disappearance of the mitochondria labelled during the BrdU pulse. After stimulating the cells for 2 hours with the AMPK activator 991 and pulse labeling cells for 2 hours with BrdU, the labeling medium was removed and replaced with normal growth medium, and the loss of the incorporated label was measured over time. Without additional treatment, the BrdU signal declined to approximately 80% of control values by 6 hours, 20% by 24 hours, and had reached background levels by 48 hours (Figure 4A). As AMPK activation may directly activate mitophagy due to phosphorylation and activation of its substrate ULK1, we examined the time course of disappearance of BrdU signal after using ERK inhibition to stimulate the initial labeling, and found no difference in the subsequent rate of loss of label (not shown). We therefore interpret this time course as representing the natural rate of mitophagy which is unaffected by the relatively brief pulse of AMPK stimulation used to provoke mitochondrial DNA synthesis and labeling. Agents increasing the rate of mitophagy would be expected to accelerate the rate of signal loss. To examine this hypothesis, we selected 6 hours post BrdU labeling as a suitable time point, as the level of signal is still high enough to provide an assay window, while the partial loss of signal demonstrates that mitophagy is proceeding, and may be useful to confirm that cells in any given experiment are behaving normally.
CCCP is an uncoupler of electron transport in mitochondria which dissipates the proton gradient and depolarises mitochondria [23]. This depolarisation is followed by mitophagy. Treatment of pulse labelled myotubes for 6 hours with 10uM CCCP resulted in an accelerated decay of the label, reaching baseline by 6 hours. If this accelerated decay represents mitophagy, it should be reversible by bafilomycin treatment, which interferes with the acidification of early endosomes and thus inhibits mitophagy [24]. Treatment of myotubes with bafilomycin for 48 hours indeed resulted in a 63% reversal of the loss of BrdU signal (Figure 4b).
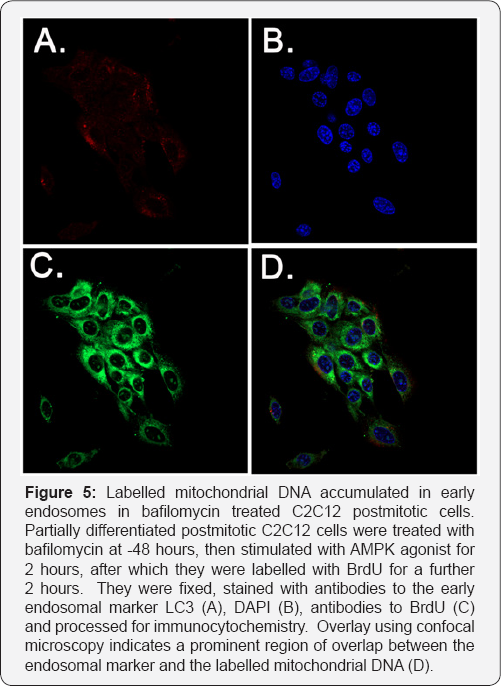
When cells thus treated were stained with a marker for early endosomes (LC3), BrdU label was found to be co-localised with the endosomal compartment (Figure 4c); where bafilomycin treatment was omitted, consistent with the ELISA data, only background staining was observed, indicating an almost complete destruction of the pulse labelled DNA under these conditions (not shown).
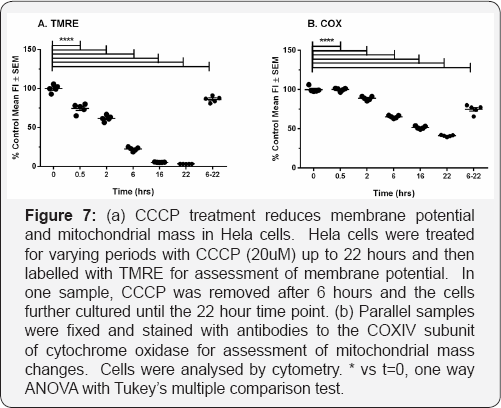
The advantage of the kinetic method we describe is that it allows the detection of rate changes over short time periods, to which measurements of biogenesis based on bulk measurement are largely insensitive. In addition, if biogenesis and mitophagy are both operative in a given situation, the simultaneous destruction and replacement of mitochondrial components can also make dynamic changes difficult to detect by bulk methods. However, to validate further that the BrdU incorporation method truly reflects these processes, we carried out an experiment to quantify the effect of the CCCP treatments on both mitochondrial membrane potential (the loss of which is one signal triggering mitophagy] and mitochondrial mass using flow cytometry. As differentiated myotubes pose difficulties for cytometry experiments, we used Hela cells stably over-expressing parkin for these experiments. Mitochondrial membrane potential was assayed over a 22 hour time course of treatment with CCCP (20uM), and parallel samples were stained for the inner mitochondrial membrane component cytochrome oxidase IV (Figure 5).
COXIV staining declined more slowly than membrane potential, and was about 60% of the initial value after 6 hours, at which point membrane potential as indicated by TMRE staining had already declined to about 20% of initial values. TMRE staining reached background levels by 16 hours, by which time COXIV staining had further declined to about 50% of the initial value, confirming the expectation that mitophagy follows membrane depolarisation. If CCCP was removed at 6 hours, and incubation continued until 22 hours after initiation, membrane potential recovered to approximately 90% of control values, and COXIV staining was slightly (10%) but significantly higher than the 6-hour time point, indicating that mitochondrial mass had begun to recover as a result of biogenesis. Although the detailed kinetics of these processes likely differs between cell types, this experiment does indicate the link between depolarisation induced by CCCP with mitophagy and helps to interpret the effect of CCCP in the myotube system.
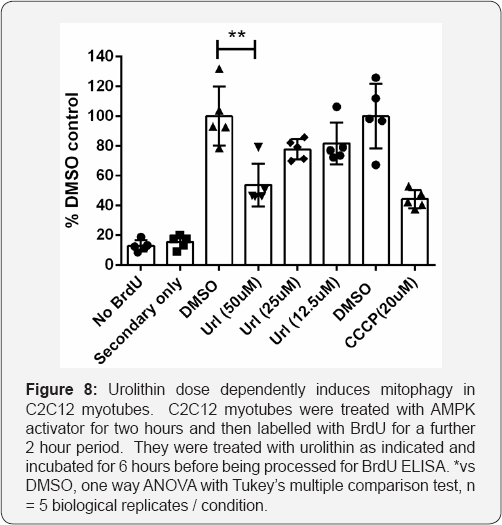
Urolithin is a compound recently described to promote mitophagy via mechanisms involving loss of membrane potential with concomitant activation of AMPK [25]. To evaluate whether the assay we have described is sufficiently sensitive and robust to detect mitophagy induced by pharmacological treatments other than CCCP, we tested urolithin at three different concentrations, and in agreement with published data, found a dose-responsive increase in mitophagy, which was significant at 50uM and less effective at lower concentrations (Figure 6). We conclude that the assay is generally applicable to detection and quantitation of induced mitophagy in differentiated skeletal muscle cells.
Discussion
We describe a simple procedure for examining mitophagy in vitro in differentiated skeletal muscle cells, which in principle should be adaptable to other post-mitotic cells such as neurons. The ELISA readout is simple and robust, requires no microscopy, and is potentially of medium throughput, dependent only on the number of plates of cells that can be conveniently handled together. In addition, no transfection is required.
Mitophagy and biogenesis are linked processes, and induction of one is frequently accompanied by induction of the other [25-30].
In addition to their relatively low sensitivity, mass assays of mitophagy are confounded by the simultaneous removal and synthesis of mitochondrial components, which is not the case with the assay we describe. This method is essentially kinetic, in that a pulse of label is incorporated into a population of mtDNA molecules undergoing replication, and after removal of the label, the longevity of only this population is followed. It is important to note that a short pulse of labeling is consistent with such a kinetic interpretation, but prolonging the labeling period would eventually result in steady state level of labeling reflecting the balance between opposing process of mitophagy and biogenesis, transforming the procedure into a mass assay. We therefore minimised the labeling period as far as was consistent with achieving sufficient levels of BrdU incorporation to provide a good signal window. In this regard, the use of immunological detection, in preference to labeling DNA with click chemistry methods, offered the ability to amplify the signal, which we did by adding an intermediate detection reagent (Figure 7 & 8).
In initial experiments, we found that the unstimulated rate of mtDNA synthesis was too low to result in significant BrdU incorporation, and some pharmacological stimulation was necessary. Several different treatments were effective in increasing the level of BrdU incorporation over the two-hour labeling period. PGC1α promotes authentic mitochondrial biogenesis. 0f the other pharmacological activation methods we examined, AMPK activation is thought to promote biogenesis via phosphorylation and activation of PGC1α, but it is unclear whether the BrdU incorporation we measure using treatment paradigm described here reflects the initiation of genuine biogenesis. The immediate increase in mtDNA synthesis (contrasted with the requirement to allow 3 days of stimulation with PGC1α) is inconsistent with upregulation of gene expression, a prerequisite for biogenesis, and suggests rather the triggering of DNA synthesis via phosphorylation and activation of pre-synthesised components. This may actually be an advantage in the mitophagy assay, where the only requirement is that stimulated mtDNA synthesis results in adequate incorporation of label. Preliminary gene expression data (not shown) indicate that a pattern of gene expression consistent with authentic biogenesis is not seen at any time up to 3 days after a 2-hour AMPK activation, supporting the argument based on the rapid kinetics of mtDNA synthesis induced by AMPK activation.
A possible point of concern with the method we describe is whether we are altering mitophagy by the procedure we are using to induce mitochondrial DNA labeling. The intimate linkage between the two processes of biogenesis discussed above suggests that almost any perturbation of biogenesis may invoke a compensating change in mitophagy. However, as discussed above, we do not believe that the brief pulse of AMPK activation we use to induce labeling, results in real biogenesis. In addition to the general coupling of biogenesis and mitophagy, a mechanism linking activation of AMPK directly to stimulation of mitophagy is its phosphorylation of the mitophagy regulator ULK-1 [31]. However, the time course of unstimulated disappearance of label when we used ERK inhibition to activate DNA synthesis was similar to that observed using AMPK activation. This suggests that an initial 2 hour AMPK activation does not significantly potentiate mitophagy by ULK-1 activation during the succeeding long observation period. In addition, even if this mechanism were operative, any contribution of this to the overall signal decline is controlled in our design by the vehicle treatment group, which will experience the same AMPK-potentiated mitophagy as the experimental treatments, and any effect of the latter must therefore be in addition to this background. The utility of the assay for examining mitophagy induced by pharmacological treatments is indicated by our data with CCCP and urolithins [32-35].
We therefore believe that the method we describe here is a useful addition to the existing assays of mitophagy, and we describe alternative methods of stimulating the initial DNA synthesis and labeling, the appropriate choice being dictated by the pharmacologies of interest to investigators. We have focused on skeletal muscle cells, but we see no reason in principle why the method should not be adaptable to other post mitotic cells.
References
- Friedman JR, Nunnari J (2014) Mitochondrial form and function. Nature 505(7483): 335-343.
- Kotiadis VN, Duchen MR, Osellame LD (2014) Mitochondrial quality control and communications with the nucleus are important in maintaining mitochondrial function and cell health. Biochim Biophys Acta 1840(4): 1254-1265.
- Chistiakov DA, Sobenin IA, Revin VV, Orekhov AN, Bobryshev YV (2014) Mitochondrial aging and age-related dysfunction of mitochondria. Biomed Res Int 2014: 1-7.
- Liesa M, Palacin M, Zorzano A (2009) Mitochondrial dynamics in mammalian health and disease. Physiol Rev 89(3): 799-845.
- Mishra P (2016) Interfaces between mitochondrial dynamics and disease. Cell Calcium 60(3): 190-198.
- Mijaljica D, Prescott M, Devenish RJ (2011) A Fluorescence Microscopy Assay for Monitoring Mitophagy in the Yeast Saccharomyces cerevisiae. J Vis Exp 53: 2779.
- McWilliams TG, Prescott AR, Allen GF, Tamjar J, Munson MJ, et al. (2016) Mito-QC illuminates mitophagy and mitochondrial architecture in vivo. J Cell Biol 214: 333-345.
- Katayama H, Kogure T, Mizushima N, Yoshimori T, Miyawaki A (2011) A sensitive and quantitative technique for detecting autophagic events based on lysosomal delivery. Chem Biol 18(8): 1042-1052.
- Sun N, Yun J, Liu J, Malide D, Liu C, et al. (2015) Measuring In Vivo Mitophagy. Mol Cell 60(4): 685-696.
- Mauro-Lizcano M, Esteban-Martinez L, Seco E, Serrano-Puebla A, Garcia-Ledo L, et al. (2015) New method to assess mitophagy flux by flow cytometry. Autophagy 11: 833-843.?
- Davis AF, Clayton DA (1996) In situ localization of mitochondrial DNA replication in intact mammalian cells. J Cell Biol 135: 883-893.
- Calkins MJ, Reddy PH (2011) Assessment of newly synthesized mitochondrial DNA using BrdU labeling in primary neurons from Alzheimer's disease mice: Implications for impaired mitochondrial biogenesis and synaptic damage. Biochim Biophys Acta 1812: 11821189
- Mauvezin C, Neufeld TP (2015) Bafilomycin A1 disrupts autophagic flux by inhibiting both V-ATPase-dependent acidification and Ca- P60A/SERCA-dependent autophagosome-lysosome fusion. Autophagy 11: 1437-1438.
- Xiao B, Sanders MJ, Carmena D, Bright NJ, Haire LF, et al. (2013) Structural basis of AMPK regulation by small molecule activators. Nat Commun 4: 3017.
- Wu Z, Puigserver P, Andersson U, Zhang C, Adelmant G, et al. (1999) Mechanisms controlling mitochondrial biogenesis and respiration through the thermogenic coactivator PGC-1Cell 98(1): 115-124.
- Ventura-Clapier R, Garnier A, Veksler V (2008) Transcriptional control of mitochondrial biogenesis: the central role of PGC-1alpha. Cardiovasc Res 79(2): 208-217
- Magnusson J, Orth M, Lestienne P, Taanman JW (2003) Replication of mitochondrial DNA occurs throughout the mitochondria of cultured human cells. Exp Cell Res 289: 133-142.
- Zong H, Ren JM, Young LH, Pypaert M, Mu J, et al. (2002) AMP kinase is required for mitochondrial biogenesis in skeletal muscle in response to chronic energy deprivation. Proc Natl Acad Sci USA 99(25): 1598315987.
- Reznick RM, Shulman GI (2006) The role of AMP-activated protein kinase in mitochondrial biogenesis. J Physiol 574: 33-39.
- Jäger S, Handschin C, St-Pierre J, and Spiegelman BM. (2007) AMP- activated protein kinase (AMPK) action in skeletal muscle via direct phosphorylation of PGC-1alpha. Proc Natl Acad Sci USA 104(29): 12017-12022.
- Wang P, Liu J, Li Y, Wu S, Luo J, et al. (2010) Peroxisome proliferator- activated receptor {delta} is an essential transcriptional regulator for mitochondrial protection and biogenesis in adult heart. Circ Res 106(5): 911-919.
- Wang KZ, Zhu J, Dagda RK, Uechi G, Cherra SJ, et al. (2014) ERK- mediated phosphorylation of TFAM downregulates mitochondrial transcription: implications for Parkinson's disease. Mitochondrion 17: 132-140.
- Terada H (1981) The interaction of highly active uncouplers with mitochondria. Biochim Biophys Acta 639(3-4): 225-242.
- Yoshimori T, Yamamoto A, Moriyama Y, Futai M, Tashiro Y (1991) Bafilomycin A1, a specific inhibitor of vacuolar-type H(+)-ATPase, inhibits acidification and protein degradation in lysosomes of cultured cells. J Biol Chem 266: 17707-177012.
- Itami N, Shiratsuki S, Shirasuna K, Kuwayama T, Iwata H (2015) Mitochondrial biogenesis and degradation are induced by CCCP treatment of porcine oocytes. Reproduction 150: 97-104
- Garrido-Maraver J, Paz MV, Cordero MD, Bautista-Lorite J, Oropesa- Àvila M, de la Mata M, et al. (2015) Critical role of AMP-activated protein kinase in the balance between mitophagy and mitochondrial biogenesis in MELAS disease.Biochim Biophys Acta 1852: 2535-2553.
- Ryu D, Mouchiroud L, Andreux PA, Katsyuba E, Moullan N, et al. (2016) Urolithin A induces mitophagy and prolongs lifespan in C. elegans and increases muscle function in rodents. Nat Med 8: 879-888.
- Ploumi C, Daskalaki I, Tavernarakis N (2016) Mitochondrial biogenesis and clearance: a balancing act. FEBS J 284(2): 183-195.
- Sin J, Andres AM, Taylor DJ, Weston T, Hiraumi Y, et al. (2016) Mitophagy is required for mitochondrial biogenesis and myogenic differentiation of C2C12 myoblasts. Autophagy 12(2): 369-380.
- Palikaras K, Lionaki E, Tavernarakis N (2015) Coordination of mitophagy and mitochondrial biogenesis during ageing in C elegans. Nature 521(7553): 525-528.
- Tian W, Li W, Chen Y, Yan Z, Huang X, et al. (2015) Phosphorylation of ULK1 by AMPK regulates translocation of ULK1 to mitochondria and mitophagy. FEBS Lett 589(15): 1847-1854.
- Michel S, Wanet A, De Pauw A, Rommelaere G, Arnould T, et al. (2012) Crosstalk between mitochondrial (dys)function and mitochondrial abundance. J Cell Physiol 227: 2297-2310.
- Egan DF, Shackelford DB, Mihaylova MM, Gelino S, Kohnz RA, et al. (2011) Phosphorylation of ULK1 (hATG1) by AMP-activated protein kinase connects energy sensing to mitophagy. Science 331(6016): 456-461.
- Zhang CS, Lin SC (2016) AMPK Promotes Autophagy by Facilitating Mitochondrial Fission. Cell Metab 23(3): 399-401.
- Zhu J, Wang KZ, Chu CT (2013) After the banquet: mitochondrial biogenesis, mitophagy, and cell survival. Autophagy 9(11): 1663-1676.


