


Abstract
Background: A common standard for recovery after knee injury is achieving >90% limb symmetry index (LSI) in quadriceps peak torque (PT). Emerging evidence suggests knee extension rate of torque development (RTD) may better predict gait symmetry, knee biomechanics, and performance than PT. Yet RTD is measured with varied intervals, and the most clinically relevant metrics and their relations to PT remain unclear.
Purpose: To investigate: (1) the associations between the three most common RTD measurement (100 ms (RTD100), 200 ms (RTD200), between 20% and 80% of peak torque (RTD20-80)) to PT and (2) to compare the limb symmetry index (LSI) rate of recovery of each metric.
Study Design: Prospective, Cohort Pilot Study
Methods: Convenience sample of postoperative (PostOp; >6 months after arthroscopic surgery) and nonoperative (NonOp) patients at a single outpatient clinic. Primary outcomes were QPT, RTD100, RTD200, and RTD20–80 normalized to body weight, with LSI for each. Associations were computed within cohorts.
Results: Twenty-seven PostOp (F:M 8:19; age 34±14; BMI 25.4±4.8) and ten NonOp (F:M 1:9; age 39±15; BMI 22.9±2.2); PT LSI: NonOp 97.0±13.0%, PostOp 76.8±23.3%. NonOp LSI: RTD100 103.5±33.5%, RTD200 92.6±21.6%, RTD20–80 81.5±35.1%. PostOp <1 year: RTD100 74.5±22.0%, RTD200 71.4±20.0%, RTD20–80 49.6±24.6%. PostOp >1 year: RTD100 68.1±27.4%, RTD200 69.3±17.0%, RTD20–80 76.8±35.9%. RTD20–80 had a weaker correlation with PT in all cohorts (r=0.40, 0.45, 0.23) and best distinguished PostOp <1 vs >1 year.
Conclusion: PT-based return-to-sport criteria may overlook knee extension RTD deficits. RTD20–80 appears more discriminative than RTD100 or RTD200. Given its weak association with PT and reported predictive value for knee extensor moments during functional tasks, incorporating both PT and RTD20–80 may better inform clearance for return to activity/sport.
Keywords: return to sport; knee; quadriceps; rate of torque development; athletes; neuromuscular; biomechanics; beyond peak; ligamentous sprains; physical therapy.
Introduction
Restoration of quadriceps muscle function is a critical component of recovery after knee injury, whether managed surgically or non-operatively. Adequate quadriceps strength and symmetry are strongly linked to successful return-to-sport (RTS) outcomes and reduced re-injury risk [1]. Accordingly, RTS criteria often mandate that patients achieve at least ~90% limb symmetry in maximal knee extensor strength (typically quantified as peak torque) and pass functional hop tests [1]. However, accumulating evidence suggests that such conventional criteria may overlook important residual deficits in muscle performance. Even athletes who satisfy quadriceps index (QI) and hop distance symmetry thresholds can display persistent asymmetries in dynamic knee function – for example, significantly slower injured-limb quadriceps torque development – which standard RTS tests do not detect [1-3]. This discrepancy may help explain the high incidence of secondary injuries despite RTS clearance, as limb symmetry indexes can overestimate actual recovery [4]. In short, passing traditional strength and hop benchmarks does not guarantee that explosive neuromuscular performance has fullynormalized.
One key aspect of muscle function that is insufficiently captured by peak torque alone is the rate of torque development (RTD) of the quadriceps. RTD refers to the muscle’s ability to rapidly generate force – essentially a measure of explosive strength – and is typically calculated as the slope of the torque–time curve during the initial phase of contraction. Physiologically, RTD is governed by neuromuscular factors distinct from those influencing maximal strength. In particular, the capacity to activate motor units quickly and at high firing rates in the first ~50–100 ms of contraction is a primary determinant of early RTD [5]. Consequently, RTD is highly sensitive to deficits in neural drive and muscle activation that may persist after injury. For example, patients recovering from knee surgery often show pronounced impairments in voluntary RTD alongside deficits in quadriceps activation, even when muscle size or peak force output is relatively preserve [3]. Cobian et al. (2017) demonstrated that after arthroscopic meniscectomy (a common knee injury treated surgically), rapid knee extensor torque capacity was significantly reduced compared to the uninvolved side at multiple time points post-operatively [3]. These RTD deficits were attributed to an inability to quickly recruit and drive the quadriceps (neural mechanism) rather than muscle atrophy [3-5]. Notably, patients with greater lingering RTD impairments reported worse functional outcomes, whereas peak strength and muscle size were not associated with patient-reported recovery. Such findings underscore that RTD provides unique clinical insight into neuromuscular recovery that peak torque alone may miss. In light of this, experts have posited that rapid torque production warrants greater attention in rehabilitation and RTS decision-making [3-5].
Deficits in quadriceps RTD are not merely laboratory curiosities; they have direct relevance to functional performance and knee joint stability. Many athletic and daily activities – from jump landings to cutting maneuvers or simply descending stairs – occur within fractions of a second, demanding high forces in minimal time. If an individual’s quadriceps can eventually produce normal maximal force but cannot do so quickly, they may struggle with these explosive tasks despite “normal” strength on paper. [6] Emerging evidence indicates that quadriceps RTD is a stronger predictor of dynamic knee function than maximal torque in certain contexts [3-7] Knurr et al., for example, tracked Division I athletes in the two years after ACL reconstruction and found that better recovery of quadriceps RTD symmetry correlated with more symmetric knee biomechanics during running, whereas peak torque symmetry showed no significant association [6]. In that study, a 10% increase in RTD symmetry was associated with substantial improvements in running gait symmetry, highlighting the clinical importance of explosive force production [6]. Similarly, early-phase RTD appears critical for high-impact activities: one prospective study reported that while single-leg hop distance was slightly more influenced by maximal strength, metrics like vertical jump height and landing force were more closely tied to quadriceps RTD [8]. The authors concluded that strength and RTD are complementary but distinct predictors of functional performance [8]. In practical terms, an athlete with residual RTD deficits may achieve a normal hop distance by compensating with altered technique or contributions from other muscle groups, yet still exhibit abnormal landing mechanics or gait patterns [1-2]. Consistent with this, even after meeting standard RTS criteria, athletes have shown persistent quadriceps RTD asymmetry alongside altered hip/knee movement strategies, which could predispose them to re-injury. These observations align with broader critiques that sole reliance on isometric peak torque or hop tests is insufficient for clearing athletes for sport.[4] In response, recent research has begun to explore “beyond peak” measures – whether in the time domain (like RTD) or other domains – to more fully characterize muscle recovery. For instance, a longitudinal analysis by Kocak et al. [9] examined knee extensor strength across the range of motion in post-ACL reconstruction athletes, revealing angle-specific torque deficits that a single peak torque value might obscure [9]. Their findings reinforce the notion that important nuances of muscle performance (temporal or positional) can escape traditional assessments focused only on maximal [9].
While the importance of quadriceps RTD is increasingly recognized, several gaps remain in the literature. First, most existing studies on knee extensor RTD have focused on young, competitive ACL reconstruction patients, yet quadriceps dysfunction following knee injury is not exclusive to ACL tears nor to operative management. Patients with other knee injuries (e.g. meniscal injuries, ligamentous sprains managed nonoperatively, chronic knee pain) can also experience persistent quadriceps inhibition and slowed torque development [3]. It is therefore crucial to broaden the scope of investigation to include both postsurgical and non-surgical knee injury populations. Second, a variety of RTD metrics and calculation methods have been reported in the literature, and it remains unclear which time interval or method is most clinically relevant for tracking recovery. Common metrics include early- phase RTD measured to discrete time points (e.g. RTD_100ms, RTD_200ms) as well as mid-phase RTD measured over a percentage of the contraction (e.g. RTD_20–80%, the slope between 20% and 80% of maximum torque). Each metric may capture a slightly different aspect of muscle performance. For example, very early RTD (within ~100 ms) is thought to reflect pure neural drive capacity, later RTD incorporates some muscle mechanical properties, and the 20–80% metric represents the ability to accelerate to a high proportion of maximal force [5-10]. There is a need for clarity on how these RTD measures interrelate and how each recovers relative to traditional peak torque.
Notably, prior work suggests that RTD recovery often lags behind peak torque recovery after knee injury [11]prospective, longitudinal single-cohort study.Objective To investigate the rate of force development to 30% (RFD30. In one report, even as patients approached symmetrical maximal strength around 6–12 months postinjury, their RTD (especially the 20–80% measure) remained significantly impaired and asymmetric [2-10]. Moreover, that mid-phase RTD (RTD_20–80) has been identified as strongly correlated with dynamic knee moments during running, jumping, and cutting, [2-12] suggesting it might be a particularly sensitive indicator of functional readiness. However, it is still unknown which RTD metric best discriminates between injured and healthy limbs or operative and non-operative cases, and whether improving peak torque necessarily entails proportional improvements across all RTD metrics.
Therefore, the present study was designed to address these gaps by investigating knee extensor peak torque and RTD characteristics in a broader patient cohort recovering from knee injuries, including both operative and non-operative cases. We specifically examined the three most commonly reported RTD metrics – RTD100 (0–100 ms), RTD200 (0–200 ms), and RTD20-80 (from 20% to 80% of maximal torque) – alongside peak torque, with all measures normalized to body weight. We evaluated the relationships between these metrics and compared the recovery of limb symmetry indices (LSIs) for each measure across patient subgroups. By analyzing correlations and symmetry deficits in both post-surgical and conservatively treated individuals, we aimed to determine whether RTD metrics provide information independent of peak torque and to identify which RTD measure is most clinically informative. We hypothesized that RTD measures, particularly the 20–80% RTD, would show persistent between-limb asymmetries even when peak strength begins to normalize, and that RTD would only be moderately correlated with peak torque, reflecting its distinct neuromuscular underpinnings. Confirming these hypotheses would support the inclusion of RTD-based criteria in RTS assessments, helping clinicians detect subtle yet important muscle performance deficits and make more evidence-based decisions about a patient’s readiness to return to vigorous activity or sport. Ultimately, this study’s results will clarify the clinical utility of RTD (RTD100, RTD200, RTD20-80) as complementary metrics to quadriceps peak torque in monitoring muscle performance recovery following knee injury. The findings could inform more comprehensive RTS guidelines that ensure both the magnitude and rate of force production are adequately restored in patients rehabilitating from knee injuries.
Methods
Study Design:
Descriptive, prospective, cross-sectional cohort study.
Setting:
Hospital-based outpatient physical therapy departments in Redwood City, CA.
Participants:
Subjects whose were recruited though a sampling of convenience
and who were receiving care at a single hospital-based
outpatient orthopedic and sports physical therapy clinic between
January 1, 2023, to July 30, 2024. The muscle performance testing
was performed as a standard of care for both post-operative and
non-operative patients. As such there was no formalized IRB or
clinical trial registration. Due to the pilot nature of the investigation
patients who were treated both surgically and non-operatively
for their knee injury were included. Patients were included if
they met the following inclusion criteria [13–16]:
- Older than 14 years of age
- No baseline pain or edema/effusion
- Presented with primary complaint of knee related pain
(whether post-surgical or non-surgical)
- 20 weeks to 2 years post-surgery (applicable to post operative
patients only)
- Non-antalgic gait
- Currently in return to sport/activity rehabilitation phase
- Undergone isokinetic muscle performance testing for
quadriceps
Participants were excluded if they:
- Had a history of low back pain or lower extremity injury
in the last year other than which they were being treated for
and for which that required medical attention [17]
- Pregnant at the time of testing (all medical history was
taken on a subjective basis by treating therapist) [18].
Due to the exploratory nature of the initiative, there was no exclusion of based upon graft type or concomitant surgical procedures.
Testing Procedures Warm-up:
As is standard practice within the respective clinic, subjects performed a 3-5 minute warm up on an upright stationary cycle (Matrix Fitness©, Cottage Grove, WI, USA), at an intensity of ~1 W/kg of body weight, maintaining 70-80 rpm. This warm-up has previously been described when comparing quadriceps strength to hop test performance [19]the question of whether the uninvolved leg may serve as a reference on functional tests has not been adequately answered. In particular, the one-legged rebound vertical jump has not been used to assess functional levels following surgery of the cruciate ligament. The purposes of this study were: 1.
Isokinetic Dynamometer Set Up:
Isolated muscle performance testing was conducted using an isokinetic dynamometer (Biodex System 4 PROTM, Biodex Medical System, Shirley, NY) during a maximum voluntary isometric contraction (MVIC). The testing position set up is shown in Figure 1.

In accordance with the Biodex System 4 PROTM manufacturers manual, the isokinetic dynamometer was calibrated before testing, using the ‘Calibration’ function within the Biodex Software. The subjects were placed in a sitting position and securely strapped into the test chair (two cross straps over their torso, one strap securely strapped across their waist, and one strap over the middle of thigh of the testing limb). Extraneous movement of the upper body was limited per manufacturer’s instructions using straps (across the chest and the proximal one-third of both thighs) [17][20–24]. The trunk-thigh angle was 90° of knee flexion [17- 20][23–25]. The lateral femoral epicondyle of the testing leg was visually aligned with the axis of rotation of the dynamometer, and the lever arm was attached to the shank by a strap [19-26]the question of whether the uninvolved leg may serve as a reference on functional tests has not been adequately answered. In particular, the one-legged rebound vertical jump has not been used to assess functional levels following surgery of the cruciate ligament. The purposes of this study were: 1. Subjects sat in the dynamometer with the trunk fully supported, the hips flexed to approximately 90°, and the knee flexed to 60°. The subject was asked to relax his/her leg so that the passive determination of the effects of gravity on the limb and lever arm could be carried out at 60˚ knee flexion. For the testing, the knee joint was set at 90° [6-12][27]. A rigid leg cuff was mounted on the lower leg ~3 cm above the medial malleolus on the anterior aspect of the distal shank [28].
Knee Extension Rate of Torque Development Testing Procedures:
For all isolated muscle performance tests, the subject was instructed give maximal effort on each repetition and to not hold back any effort for subsequent contractions [21]. The testing investigator provided real-time standardized verbal commands and encouragement, as well as visual feedback, which was available on a monitor positioned in front of the dynamometer seat, as an output guide [17-18][21-25].
Quadriceps rate of torque development isometric knee extension (RTD) was quantified during a quick (5 second) contraction. For familiarization of the test, subjects performed up to two trials of isometric repetitions (the first practice repetition was recommended at 50%, and the second repetition at 75%) [18][29-34] single-masked.\nOBJECTIVES: To determine the effectiveness of using a modified neuromuscular electrical stimulation (NMES. The subjects were instructed to extend their knee ‘‘as fast and as hard as possible’’ [17][25-30], with an emphasis on “fast” [17][30- 35]. Subjects were instructed to avoid any prior counter movement of the limb, and the resting force level was displayed on a sensitive scale to provide biofeedback on whether any countermovement or pre-tension had occurred [23][30-36]. Both counter movements of the limb as well as pre-tensioning were monitored during the practice repetitions to ensure patient understanding and proper execution of the instructions.
Subjects then performed 3 maximal contractions of 5 second duration. Each repetition were followed by 15 sec rest [30-31][36-37]”container-title”:”Journal of Orthopaedic Research: Official Publication of the Orthopaedic Research Society”,” page”:”633-640”,”volume”:”29”,”issue”:”5”,”source”:”Pub- Med”,”abstract”:”Persistent quadriceps muscle weakness is common after anterior cruciate ligament (ACL. Of the 3 maximal contractions, the trial with the greatest peak torque, and without an unstable baseline (i.e. any evidence of muscle pre-tension &/or counter-movements), was selected for RTD analysis.
Data Extraction & Analysis
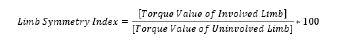
As the patient profiles are created directly on the Bidodex v4.63 System 4 software, the raw data of the RTD. The Biodex isokinetic dynamometer performs a sampling rate of 100 Hz (i.e., captures toque values 100 times/second). The ascending slope of the force-time curves for each of the three repetitions were visually assessed and the repetition with the steepest slope without any premature tension or countermovement artifact was selected. If it was not obvious from the visual analysis which repetition demonstrated the greatest RTD values, then multiple repetitions were analyzed, and the best repetition used as the final result. The initiation of the contraction was determined to be time point zero for calculating RTD100 and RTD200. The initiation of the contraction was determined to be the closest time point (to the nearest hundredth of second) at which the torque rose above 2.5% PT from the baseline resting torque. The data points that were extracted directly from the curve analysis were: toque at 100 ms, torque at 200 ms, peak torque, time point to hundredth of a second at 20% PT and 80% PT. For the time values at 20% and 80% PT, the closest data point to the respective percentage point was identified. The data was inputted from the curve analysis to into a Microsoft® Excel (Microsoft, Redmond, Washington, USA) spreadsheet with prepopulated equations in order to calculate RTD100, RTD200, RTD20-80, and PT for each limb, normalized to body weight as well as the limb symmetry index (LSI) for each quadriceps metric. The RTD was calculated for a certain percentage of peak torque PT. The RTD values were selected at 100ms, 200ms, and between 20-80% PT as these metrics and time intervals have previously been described in the persons seen post knee injury and in determining RTS criteria.[6-12][38-39]allowing for assessments within the surgical and nonsurgical limbs. However, availability of preinjury running biomechanics is rare and has been reported in case studies only.\nPURPOSE/HYPOTHESIS: The purpose of this study was to determine if running biomechanics return to preinjury levels within the first year after ACLR among collegiate athletes. We hypothesized that (1 The highest RTD across the three trials, for each of metrics of interested were used for final results. Similarly, the final PT value that was recorded was the highest PT achieved across the repetitions was used for final analysis. Each of the RTD and PT values were normalized to bodyweight with the units of foot-pounds per pound body weight per second and footpounds per pound body weight, respectively. The LSI for RTD100, RTD200, RTD20-80, and PT was calculated by dividing each respective injured (i.e., ‘involved’) limb values by that of the ‘healthy’ (i.e., ‘uninvolved’) limb and multiplying by 100 to provide percentage between limbs (see Equation 1).
Equation 1:

The RTD20-80 was calculated by first identifying the time to the closest in milliseconds at 20% and 80% PT. The torque value differences between 20% and 80% was taken and then divided by the difference in the time interval. See Equation 2 below.
Equation 2:
To ensure consistency in the testing procedures all muscle performance measures taken were administered by the same member of the research team.
Statistical Analysis:
The D’Agostino’s (modified Shapiro-Wilk) normality test was used to determine normality of distribution of the data. Data was found to be normally distributed, allowing the use of parametric tests. Data was reported as a group mean ± standard deviation (SD). An ANOVA was used to compare the LSI of RTD100, RTD200, RTD20-80, and PT for each of the different cohorts. Additionally, a Bonferroni Post-hoc-Tests was used to determine statistical differences between each of the independent variables compared in each of the ANOVAs. An alpha level of 0.05 was deemed statistically significant to determine statistical differences within the Post-hoc-Test.
The relationships between RTD100, RTD200, RTD20-80, and PT for the post operative cohorts (both pre and post 1 year) and for the non-operative cohort were calculated using the Pearson correlation coefficient, and interpreted as follows: 0.00 to 0.19, very weak correlation; 0.20 to 0.39, weak correlation; 0.40 to 0.69, moderate correlation; 0.70 to 0.89, strong correlation; and 0.90 to 1.0, very strong correlation [40]. All analyses were conducted using Microsoft Excel 2016 Inferential Statistic Template. An alpha level of 0.05 was determined to be statistically significant.
Results
Participants:
Over the course of 18-month data collection, 37 patients (28 males, 9 females; 27 post operative and 10 treated non-operative) were tested. Participant demographic characteristics are shown in Table 2a and 2b.

Note. in, inches; kg, kilograms; lb, pounds; m, meters; mo, months; N/A, not applicable.

Note. ACLR, Anterior cruciate ligament reconstruction; PCLR, posterior cruciate ligament reconstruction; PLCR, posterior lateral corner reconstruction.
PLCR, posterior lateral corner reconstruction. Regarding surgical procedures, the majority of the post operative patients were seen post ACL-R (n = 17, 63%) and of these, approximately half the patients had a subsequent procedure performed on the meniscus (n=9, 53%). The primary graft types used were autograft and were either quadriceps tendon or bone-patellar tendon-bone. The diagnoses of the non-operative demographic included spectrum of orthopedic injuries including patellofemoral pain, patella tendinopathy, conservative meniscus injuries, and mild knee osteoarthritis.
Knee Extension Peak Torque Index:
All raw data PT data with calculations of LSI are available in Supplementary Materials. The LSI of the PT values are summarized in Figure 1. The PT can be interpreted as ‘high’ (>90%), ‘moderate’ (85-90%), ‘low’ (<85%). The data label for each column are provided within Figure 1 for ease of interpretation. Interestingly, the mean PT for the subjects less than one year (77±21%) and post one year (77±27%). The mean PT were ‘high’ at 97±13% for the non-operative cohort. Despite the mean PT LSI being clinically significantly different in the non-operative group as compared to post-operative cohort the difference did not reach statistical significance according to the ANOVA analysis (F = 1.74, p = .164).
Knee Extension Rate of Torque Development:
The RTD data is summarized in Figure 2. The LSI for RTD100, RTD200, and RTD20-80, like the PT LSI scores, can be interpreted as ‘high’ (>90%), ‘moderate’ (70-90%), ‘low’ (<70%). The mean LSI values for RTD100, RTD200, and RTD20-80 for the non-operative cohort were 103±34%, 93±22%, and 81±35%, respectively. Similar to the PT LSI, the LSI for the Non-operative cohort were clinically significantly higher in than the post operative cohorts (see Figure 2). However, according to the ANOVA results for RTD100, RTD200, and RTD20-80, on the RTD20-80 demonstrated statistical differences across cohorts. Specifically, the RTD20-80 for the post-op <1 year cohort demonstrated significant difference between the post-op >1 year (p = 0.042). Though it did not reach statistically significant difference there was a clinical meaningful difference (i.e., >10% LSI) between the post-op <1 year and the non-op cohort RTD20-80 values. Tables and results of the ANOVA and Bonferroni Post-hoc-Tests are provided in the Supplementary Materials.

Previous evidence has highlighted the limitations of solely focusing on limb symmetry as a post-op recovery of muscle performance and that LSI[4] can overestimate knee function post-surgery or knee injury. To aid better interpretation of the results each of the muscle performance variables was also normalized to body weight. The pool results of the normalized muscle performance metrics are summarized in Table 3.

Note. BW, body weight (lb); PT, peak torque; RTD100, rate of torque development 100 ms; RTD200 rate of torque development 200 ms; RTD20-80, rate of torque development 20-80 MVIC.
Knee Extensor Muscle Performance Correlations
Pearson’s correlation coefficients (r) were analyzed to examine the relationships among various parameters of knee extensor muscle performance-namely, peak torque (PT), rate of torque development at 100 ms (RTD100), 200 ms (RTD200), and between 20-80% of MVIC (RTD20-80)-in three distinct cohorts: non-operative, post-operative less than 1 year, and post-operative greater than 1 year. The conventional interpretation of r values is as follows: negligible (0.00–0.10), weak (0.10–0.39), moderate (0.40–0.69), strong (0.70–0.89), and very strong (0.90–1.00) correlations (see Table 3). Color coding was used to quickly denote correlation strength: red for weak (<0.5), yellow for moderate (0.5–0.79), and green for strong (>0.8). The results of the Pearson’s r correlations for each of the non-op, post-op <1yr, and postop >1yr are shown in Tables 4, 5, and 6, respectively.

Note. Table adapted from Shrober et al 2018 [41]

Note. PT, peak torque; RTD100, rate of torque development 100 ms; RTD200 rate of torque development 200 ms; RTD 20-80, rate of torque development 20-80 MVIC; red color, indicates weak correlation (<0.5); yellow color, indicates moderate correlation (0.5-.79); green color, indicates strong correlation (>0.8).

Note. PT, peak torque; RTD100, rate of torque development 100 ms; RTD200 rate of torque development 200 ms; RTD20-80, rate of torque development 20-80 MVIC; red color, indicates weak correlation (<0.5); yellow color, indicates moderate correlation (0.5-.79); green color, indicates strong correlation (>0.8).

Note. PT, peak torque; RTD100, rate of torque development 100 ms; RTD200 rate of torque development 200 ms; RTD20-80, rate of torque development 20-80 MVIC; red color, indicates weak correlation (<0.5); yellow color, indicates moderate correlation (0.5-.79); green color, indicates strong correlation (>0.8).
Non-Operative Cohort
Table 5 displays the correlation matrix for the non-operative cohort, demonstrating generally moderate to strong associations among the performance metrics. Notably, PT exhibited moderate correlations with RTD100/RTD200 but weaker association with RTD20-80, whereas RTD metrics displayed particularly strong inter- correlations, especially between RTD200 and RTD20-80.
Post-Operative Cohort
In the post-operative cohort <1 year after surgery table 6, the correlations were generally stronger across most pairings. Important to note that in this early post-operative phase, PT had exceptional correlations with RTD100 and especially RTD200. The relationships between RTD metrics themselves remained moderate to strong, but association with RTD20-80 was less robust. Similarly, in patients tested >1-year post-operation Table 7, the strength of associations between metrics remained moderate to strong, with PT demonstrating a strong correlation with RTD100 and RTD200. Yet, once again there was only a moderate correlation with RTD20-80 with all three other variables, with the weakest correlation between with PT.
Discussion
Our findings underscore a critical dissociation between maximal quadriceps strength and RTD production in the post-injury knee extensors. In both post-operative cohorts and those with non-operative knee injury, the results demonstrate that isometric knee extension RTD – particularly the mid-phase RTD between 20-80% of peak torque (RTD20-80) - remained substantially impaired despite near restoration of PT limb symmetry. Mean quadriceps PT LSI approached the commonly cited 90% “return- to-sport” threshold (~87–89%), yet RTD LSI values lagged far behind (often 50-75%) [2]. In fact, RTD20-80 demonstrated only a weak correlation with PT in both cohorts (r = 0.23–0.38), indicating that athletes who recovered maximal strength did not necessarily recover the speed of torque generation. This weaker association suggests RTD20-80 captures distinct neuromuscular qualities – such as rapid motor unit recruitment and tendon stiffness - that are not reflected by peak torque alone. Thus, consistent with our hypothesis, knee extensor RTD (especially RTD20-80) emerges as an independent facet of muscle performance requiring separate evaluation alongside traditional strength measures.
These results align with and extend the growing body of literature highlighting persistent quadriceps RTD deficits after knee injury. Previous studies have noted that quadriceps RTD recovers more slowly than maximum strength following ACL reconstruction [42]. For example, Kline et al.[43] reported that athletes six months post-ACL surgery showed marked impairments in explosive torque despite moderate strength recovery [43]. Knurr et al. [6] similarly observed that even as late as two years post-ACLR, patients continued to exhibit abnormal knee biomechanics during running if quadriceps RTD symmetry was deficient, whereas peak strength symmetry alone did not predict these abnormalities [6]. In their 2023 study, quadriceps RTD LSI had a significantly stronger influence on restoring normal running kinematics and kinetics than did PT LSI [6]. This finding reinforces that the ability to rapidly generate knee extensor torque – more than the absolute force capacity – is critical for functional movements. It also helps explain our observation that RTD20-80 was only modestly related to PT: an athlete can achieve high PT symmetry through slow, high effort contractions, yet still lack the quick activation needed for dynamic joint stabilization during running or cutting. Indeed, early-phase torque production (within the first ~100–200 ms) is largely governed by neural drive and fast-twitch fiber recruitment, factors which may not scale directly with muscle size or peak force [42]. Our data suggest RTD20-80, which is normalized to each individual’s own peak torque, is sensitive to these neural and contractile speed elements. Its poor correlation with PT implies that maximal strength alone is an insufficient proxy for explosive torque capabilities.
Notably, our finding that RTD deficits persist even in a “non-operative” knee injury cohort (albeit to a lesser extent than post-surgery) suggests that pain, disuse, or neuromuscular inhibition can impair explosive quadriceps function even without surgical trauma. This mirrors results by Cobian et al. [3] in patients after arthroscopic partial meniscectomy: they documented significant side-to-side RTD deficits as early as 2–5 weeks post-surgery, deficits which were driven by neural activation failures rather than muscle atrophy.[3] Intriguingly, they found that patient-reported outcomes were associated with quadriceps RTD, but not with quadriceps peak strength or muscle size [3]. In other words, patients who struggled with daily function or reported continued knee symptoms were those with poor rapid torque development, even if their peak muscle strength had recovered. This underscores the clinical relevance of RTD: it appears closely tied to functional performance and subjective knee stability. Our results are consonant with this idea – athletes with nearly symmetric peak torque still may experience subtle instability or performance deficits if they cannot generate torque quickly. Consistent with Cobian et al.’s conclusion that “rapid torque development warrants greater attention in rehabilitation”, [3] our study reinforces the notion that explosive strength is a distinct dimension of recovery that clinicians must not overlook.
From a physiological standpoint, the mid-range RTD20-80 metric may be especially informative. By measuring the slope of the torque-time curve between 20% and 80% of the individual’s PT, this metric effectively normalizes for maximal strength and focuses on the efficiency of reaching a high level of torque. A weak correlation between RTD20-80 and PT implies that some individuals with high PT still take longer to reach 80% of that torque – likely due to residual neuromuscular inhibition, fiber-type shifts, or altered motor unit firing rates post-injury. Such deficits in the speed of force development can have real functional consequences. Hsieh et al. demonstrated that early after ACLR, the speed, not just the magnitude, of knee extensor torque production was associated with better self-reported knee function [42]. Similarly, patients with faster quadriceps RTD show more symmetrical knee loading in dynamic tasks and even less bone mineral loss in the injured limb [6-7]. Knurr and colleagues recently reported that ACLR athletes with lower quadriceps RTD at ~9 months post-op experienced greater declines in distal femur bone mineral density over the subsequent year [7]. They posited that an inability to rapidly produce knee extensor force could limit joint loading during activity and contribute to bone loss [7]. Collectively, these findings (in conjunction with our results) paint a consistent picture: after knee injuries, recovering peak muscle torque is necessary but not sufficient for full recovery – the rate at which that torque can be produced is equally important for both joint function and musculoskeletal health.
Clinical Implications
The present results carry important implications for rehabilitation and RTS decision-making. Traditional RTS criteria heavily emphasize quadriceps strength, often using a 90% Quadriceps Index (QI) or PT LSI as a cornerstone for clearance. Our data, however, indicate that exclusive reliance on QI or PT-based criteria is likely inadequate. An athlete could pass standard isometric strength tests and even functional hop tests (in our sample, average hop LSI was ~86%, approaching symmetry) yet still harbor significant explosive strength deficits [2]. Consistent with this, a recent analysis by Jeanfavre et al. found that at ~9 months post- ACLR, patients who met typical discharge criteria (QI and hop LSI ~90%) nonetheless showed large asymmetries in RTD (only ~49–76% LSI) [2]. The authors concluded that current functional test batteries “are insufficient at capturing significant deficits in knee extension RTD” [2]. Our findings strongly support this conclusion. In practical terms, this means clinicians and sports medicine practitioners should exercise caution when clearing athletes based solely on isometric strength and hop performance. Persisting RTD deficits – essentially a hidden “explosive strength gap” - may leave the athlete vulnerable to poor knee mechanics and even re-injury upon return to high-demand sports [2]. Indeed, it has been suggested that overlooking RTD deficits might partly explain the persistently high re-injury rates after ACLR, despite improvements in strength-focused rehab protocols [2]. We advocate that RTD measures be incorporated into RTS criteria: for example, assessing if the injured limb can produce force quickly (not just maximally) at a level comparable to the uninjured side. Practically, this could involve isometric dynamometry to record the torque-time curve or integrating devices that measure instantaneous force in functional tasks. Clinicians should be aware that an athlete with a “normalized” peak torque but a 30–50% slower RTD is not fully restored in terms of neuromuscular function.
An important clinical insight from our study is that RTD20-80 appears to be a particularly sensitive marker of impairment. In both surgical and non-surgical groups, RTD20-80 was the metric most dissociated from PT, and presumably from clinical strength assessments. Why might RTD20-80 be a better discriminator of lingering deficits than early-time-interval RTD (e.g., 0–100 ms)? One possibility is that very-early RTD (0–100 ms) can be more variable and noisier, influenced by initial reaction time and electromechanical delay, whereas RTD20-80 (which occurs slightly later in the contraction) captures a more reliable period of rapid force rise that still reflects explosive capacity. RTD20-80 may also reflect the ability to continue accelerating the contraction beyond the initial burst, which could relate to muscle power and coordination. In any case, our data suggest that clinicians aiming to identify subtle quadriceps deficits should consider evaluating an RTD measure like 20–80% PT. This could be done in a lab setting or potentially with emerging field-testing devices, and it provides information beyond the endpoint value of peak torque. For example, two athletes might both achieve 250 Nm isometric knee extension torque, but one reaches 200 Nm in the first 0.3 seconds while the other takes 0.8 seconds. Standard strength tests would consider them equal, whereas an RTD20-80 assessment would flag the latter athlete’s slower torque rise. Such information could prompt targeted interventions (e.g. plyometric or explosive resistance training) before the athlete is exposed to the demands of sport.
Future Directions
Our findings prompt several directions for future research. First, longitudinal studies are needed to track the timeline of RTD recovery after ACL injury and surgery. It remains unclear whether explosive torque capacity eventually “catches up” to strength beyond the 6–12month mark, or if some deficits persist indefinitely without specific training. Longitudinal tracking could also determine how early RTD deficits relate to later functional outcomes. Recent work suggests that early rehabilitation metrics can have predictive value-for instance, McGuire et al. reported that quadriceps RTD measured at 4 months post-ACLR correlated strongly with isokinetic strength at 6 months [44]. Those authors encouraged incorporating interventions focused on developing force quickly early in rehab to potentially expedite both RTD and strength recovery [44]. Building on this idea, future studies should examine whether early introduction of high-velocity resistance training, neuromuscular electrical stimulation, or reflex-based exercises can accelerate RTD improvements. Randomized trials comparing standard rehab vs. RTD-targeted rehab (e.g. emphasizing rapid contraction training in addition to hypertrophy work) would be highly valuable. If such interventions can narrow the RTD gap without compromising graft healing or safety, they could translate into better functional stability and possibly lower re-injury risk at RTS.
Another research avenue is the inclusion of RTD in returnto- sport test batteries and algorithms. Prospective studies could determine threshold values of RTD (absolute or symmetry) associated with safe RTS. At present, we lack consensus on what constitutes “sufficient” RTD recovery - is it 90% LSI like strength, or an absolute cutoff relative to body weight? Answering this will likely require large cohorts and perhaps sport-specific analysis. It would also be informative to investigate how RTD deficits relate to biomechanical markers of injury risk (e.g. knee valgus moments, hop landing forces) or to performance metrics (agility, sprint speed) in a return-to-sport context. Given that RTD has been linked to knee joint loading patterns [6,7,9], an integrative approach could explore whether athletes with better RTD symmetry demonstrate safer movement mechanics on jump-landing tasks or pivoting maneuvers. If so, objective RTD measures might join the ranks of jump tests and strength tests as part of a more holistic RTS assessment. We also encourage research into the neuromechanical underpinnings of RTD impairments – for example, quantifying persistent atherogenic muscle inhibition, altered motor unit firing rates, or changes in muscle-tendon unit stiffness in injured limbs. Understanding why RTD remains low (even when strength returns) will inform targeted therapies (e.g., biofeedback for muscle activation if neural inhibition is the culprit, or eccentric training if tendon compliance is a factor).
Critique of Current RTS Criteria
The prevailing RTS criteria following ACL injury have been justly criticized for their inability to ensure truly “safe” return, as evidenced by re-injury rates approaching 20-30% in young athletes. Our study adds to this critique by demonstrating that key aspects of muscle function are not captured by the status quo criteria. Strength LSI and hop tests primarily assess end-range force and power outputs under less time-constrained conditions. They fail to challenge the neuromuscular system’s capacity for instantaneous torque generation. This gap may allow athletes with residual deficits to pass RTS tests – a false sense of readiness. Integrative RTS approaches should therefore combine traditional metrics with neuromuscular assessments like RTD or reactive strength index, and even psychological readiness, to form a more comprehensive picture of an athlete’s true recovery status. For instance, a revised RTS algorithm might require not only 90% strength and hop LSI but also a demonstrated RTD LSI above some minimum (perhaps 80%, based on emerging data) and no significant asymmetry in movement quality on reactive exercises. Such multifaceted criteria could better account for the complexities of athletic knee function. We acknowledge that implementing RTD testing in widespread practice will require education and possibly new tools (e.g. affordable portable dynamometers or inertial sensors). However, as technology advances and the evidence mounts, it is conceivable that explosive strength testing will become a routine part of RTS decision-making, just as single-leg hop tests are today.
Limitations
Several limitations of this study should be considered when interpreting our findings. First, our sample size was modest (pilot in nature), which limits statistical power and the generalizability of correlation estimates. Though an effort was made to include a variety of subjects, both operative and non-operative, and across a spectrum of ages, genders, and specific medical conditions about the knee joint further studies, the included cohorts represent a relatively small subset of patients who may be seen in a hospital- based outpatient rehabilitation setting. The number of patients included and the extent of the number of patients with specific homogenous demographics (i.e., age, gender, surgical procedure, activity level, etc.) was relatively low. This limits the confirmation of the results, yet substantiates the primary hypothesis and sets the stage for larger cohort studies that can further demonstrate more confirmatory results across different demographics and practice settings. A larger cohort may more specifically delineate the relationships between RTD metrics and functional outcomes and allow subgroup analysis (e.g. sex differences or graft-type differences in the post operative group).
Second, our study design was cross-sectional beyond the 6-month post-injury mark; we did not track individuals from early rehab to full recovery. Therefore, we cannot infer causation or the directionality of influence between PT and RTD – longitudinal studies are needed to confirm whether enhancing RTD leads to improved function or vice versa. Third, while we included a non-operative “knee pain” cohort as a comparison to surgical recovery, this group was heterogeneous (varied diagnoses and chronicity) and not perfectly matched to the post-op group. Their inclusion nonetheless provided a real-world benchmark, showing that even individuals without surgery can exhibit meaningful RTD asymmetries, but future work should consider more uniform comparison groups or healthy controls. Another limitation is our focus on isometric RTD measures; although isometric testing is standard for assessing RTD and strength in a controlled manner, it may not fully replicate dynamic muscle actions during sports. We assumed that isometric RTD reflects explosive muscle capacity relevant to dynamic tasks (supported by prior research[6]), but studying RTD during isokinetic or plyometric contractions could add ecological validity.
Furthermore, our RTD measurements relied on high sampling fidelity and consistent effort during testing – any variability in pa tient effort or slight timing artifacts could affect RTD calculations. We mitigated this by careful protocol (multiple trials and selecting the best effort, with visual verification of true maximal attempt), but there is inherent measurement noise in calculating derivatives of torque. Finally, while we have highlighted the implications of RTD deficits for RTS, our study did not track actual sport outcomes such as re-injury rates or on-field performance. This was beyond our scope, but it remains an important question whether athletes with greater RTD recovery truly have better long-term joint health and lower re-injury risk. Despite these limitations, our study provides novel insight by comparing multiple RTD metrics head-to-head and demonstrating the unique value of the 20- 80% PT RTD measure in the context of knee injury recovery.
The current study design was performed as part of the standard of care within the clinical setting. Though executing such testing emphasizes the feasibility and ecological validity of testing such parameters in an outpatient setting, the testing was also performed as part of formal isokinetic testing of knee flexion and extension at 60°/sec (5 reps) and 180°/sec (10 reps) on the same day. In the author’s clinical experience and current evidence [45-46] suggests that, performing isokinetic knee flexion and extension enhances patients’ performance with the RTD tests, presumably through the mechanisms of post-activation potentiation (PAP). However, given the reduced endurance and work capacity of the quadriceps muscles that can follow post knee surgery [47] it is unknown whether such pre-isometric activities had on the fatiguability in the post operative cohort. Future studies should randomized seek to optimizing the pre-test warm up and randomize the testing order of the healthy and involved limbs.
Other notable limitations the current study design was a cross-sectional study which was sufficient to determine RTD’s potential usefulness as an adjunct parameter of functional recovery for a safe return to activity in a recreational athlete demographic, it is insufficient to establish a causal relationship. The intent is that the current study would serve as an initial observational, pilot study to substantiate the hypothesis that RTD20-80 is not strongly correlated with PT in the demographics studied and that future more rigorous methods and study designs should follow this initial investigation. Additionally, though the testing procedures for RTD were followed according to the industry standards and best recommendations, [20] the PT used for analysis were taken from the same sets as the RTD values. It has been suggested that verbal cueing (i.e., instructing the patient to push “FAST and hard” or “HARD and fast”) may influence the testing results for either RTD or PT, respectively, and ensure optimal performance of both metrics that two distinct sets or repetitions should be used and also randomized in their order from one subject to the next.
Conclusion
In conclusion, this investigation emphasizes that knee extensor rate of torque development is a distinct and clinically important metric of muscular recovery after knee injury. RTD20- 80 in particular showed weak association with peak torque and was more sensitive to residual deficits, reinforcing that maximal strength alone does not guarantee restoration of explosive force capacity. These results, in conjunction with emerging evidence from other cohorts, call for a paradigm shift in rehabilitation and return-to-play assessments. Rehabilitation professionals should broaden their focus to include not just how much force an athlete can produce, but how fast they can produce it. By integrating RTD measures into both training and criteria for return to sport, we can more fully address the neuromuscular deficits that persist after ACL reconstruction and other knee injuries. Ultimately, a more comprehensive, RTD-inclusive approach to rehabilitation may improve functional outcomes and reduce the risk of re-injury, ensuring athletes truly regain the preinjury level of performance and safety when they step back onto the field [2].
Acknowledgments
The authors would like to acknowledge the guidance and support of Daniel Cobian PhD, PT, DPT, Keith Knurr DPT, PhD, SCS and their research group for their research at the University of Wisconsin for inspiring our research initiative and this publication
References
- Derner V (2021) Quadriceps Muscle and Squatting Deficits after Passing Return-to-Sport Testing Following Anterior Cruciate Ligament Reconstruction. UNO Student Research and Creative Activity Fair.
- Jeanfavre M, Klein M, Lynch D, Esquerra L, Dickey J, et al. (2021) Knee Extension Rate of Torque Development Deficit Is Not Captured by Standard Functional Performance Measures Post- Anterior Cruciate Ligament Reconstruction. Faculty Publications - College of Physical Therapy.
- Cobian DG, Koch CM, Amendola A, Williams GN (2017) Knee Extensor Rate of Torque Development Before and After Arthroscopic Partial Meniscectomy, With Analysis of Neuromuscular Mechanisms. J Orthop Sports Phys Ther 47(12): 945-956.
- Wellsandt E, Failla MJ, Snyder-Mackler L (2017) Limb Symmetry Indexes Can Overestimate Knee Function After Anterior Cruciate Ligament Injury. J Orthop Sports Phys Ther 47(5): 334-338.
- Maffiuletti NA, Aagaard P, Blazevich AJ, Folland J, et al. (2016) Rate of Force Development: Physiological and Methodological Considerations. Eur J Appl Physiol 116(6): 1091-1116.
- Knurr KA, Cobian DG, Kliethermes SA, Stiffler-Joachim MR, Heiderscheit BC (2023) The Influence of Quadriceps Strength and Rate of Torque Development on the Recovery of Knee Biomechanics During Running After Anterior Cruciate Ligament Reconstruction. Am J Sports Med 51(12): 3171-3178.
- Knurr KA, Lyon JP, Haack CR, Kliethermes SA, Cobian DG, et al. (2023) Quadriceps Performance and Running Biomechanics Influence Femur BMD Changes after ACL Reconstruction in Collegiate Athletes. Med Sci Sports Exerc 55(9): 1540-1547.
- Pua YH, Mentiplay BF, Clark RA, Ho JY (2017) Associations Among Quadriceps Strength and Rate of Torque Development 6 Weeks Post Anterior Cruciate Ligament Reconstruction and Future Hop and Vertical Jump Performance: A Prospective Cohort Study. J Orthop Sports Phys Ther 47(11): 845-852.
- Kocak UZ, Knurr KA, Cobian DG, Heiderscheit BC (2023) Beyond Peak Torque: Longıtudınal Analysıs of Angle-Specıfıc Isokınetıc Knee Torques in Collegıate Athletes Post-ACLR. Phys Ther Sport 61: 11-19.
- Andersen LL, Andersen JL, Zebis MK, Aagaard P (2010) Early and Late Rate of Force Development: Differential Adaptive Responses to Resistance Training? Scand J Med Sci Sports 20: e162-169.
- Angelozzi M, Madama M, Corsica C, Calvisi V, Properzi G, et al. (2012) Rate of Force Development as an Adjunctive Outcome Measure for Return-to-Sport Decisions After Anterior Cruciate Ligament Reconstruction. Journal of Orthopaedic & Sports Physical Therapy 42(9): 772-780.
- Knurr KA, Kliethermes SA, Stiffler-Joachim MR, Cobian DG, Baer GS, et al. (2021) Running Biomechanics Before Injury and 1 Year After Anterior Cruciate Ligament Reconstruction in Division I Collegiate Athletes. Am J Sports Med 49(10): 2607-2614.
- Rambaud AJM, Semay B, Samozino P, Morin JB, Testa R, et al. (2017) Criteria for Return to Sport after Anterior Cruciate Ligament Reconstruction with Lower Reinjury Risk (CR’STAL Study): Protocol for a Prospective Observational Study in France. BMJ Open 7(6): e015087.
- Sachs RA, Daniel DM, Stone ML, Garfein RF (1989) Patellofemoral Problems after Anterior Cruciate Ligament Reconstruction. Am J Sports Med 17(6): 760-765.
- Manal T, Grieder A, Krist B (2016) Current Concepts Of Orthopaedic Physical Therapy; 4th ed.; APTA, 2016;
- Adams D, Logerstedt D, Hunter-Giordano A, Axe MJ, Snyder-Mackler L (2012) Current Concepts for Anterior Cruciate Ligament Reconstruction: A Criterion-Based Rehabilitation Progression. J Orthop Sports Phys Ther 42(7): 601-614.
- Schmitt LC, Paterno MV, Hewett TE (2012) The Impact of Quadriceps Femoris Strength Asymmetry on Functional Performance at Return to Sport Following Anterior Cruciate Ligament Reconstruction. J Orthop Sports Phys Ther 42(9): 750-759.
- Palmieri-Smith RM, Lepley LK (2015) Quadriceps Strength Asymmetry After Anterior Cruciate Ligament Reconstruction Alters Knee Joint Biomechanics and Functional Performance at Time of Return to Activity. Am J Sports Med 43(7): 1662-1669.
- Petschnig R, Baron R, Albrecht M (1998) The Relationship between Isokinetic Quadriceps Strength Test and Hop Tests for Distance and One-Legged Vertical Jump Test Following Anterior Cruciate Ligament Reconstruction. J Orthop Sports Phys Ther 28(1): 23-31.
- Maffiuletti NA, Aagaard P, Blazevich AJ, Folland J, Tillin N, et al. (2016) Rate of Force Development: Physiological and Methodological Considerations. Eur J Appl Physiol 116(6): 1091-1116.
- Macgregor LJ, Hunter AM (2018) High-Threshold Motor Unit Firing Reflects Force Recovery Following a Bout of Damaging Eccentric Exercise. PLoS ONE 13: e0195051.
- Quinlan JI, Maganaris CN, Franchi MV, Smith K, Atherton PJ, et al. (2018) Muscle and Tendon Contributions to Reduced Rate of Torque Development in Healthy Older Males. The Journals of Gerontology: Series A 73(4): 539-545.
- Folland JP, Buckthorpe MW, Hannah R (2014) Human Capacity for Explosive Force Production: Neural and Contractile Determinants: Determinants of Explosive Force Production. Scand J Med Sci Sports 24: 894-906.
- Tillin NA, Jimenez-Reyes P, Pain MTG, Folland JP (2010) Neuromuscular Performance of Explosive Power Athletes versus Untrained Individuals: Medicine & Science in Sports & Exercise 42(4): 781-90.
- Morais de Oliveira AL, Greco CC, Molina R, Denadai BS (2012) The Rate of Force Development Obtained at Early Contraction Phase Is Not Influenced by Active Static Stretching: Journal of Strength and Conditioning Research 26(8): 2174-2179.
- Van Driessche S, Van Roie E, Vanwanseele B, Delecluse C (2018) Test-Retest Reliability of Knee Extensor Rate of Velocity and Power Development in Older Adults Using the Isotonic Mode on a Biodex System 3 Dynamometer. PLoS ONE 13: e0196838.
- Oranchuk DJ, Storey AG, Nelson AR, Neville JG, Cronin JB (2022) Variability of Multiangle Isometric Force-Time Characteristics in Trained Men. The Journal of Strength & Conditioning Research 36(1): 284.
- Sahaly R, Vandewalle H, Driss T, Monod H (2001) Maximal Voluntary Force and Rate of Force Development in Humans--Importance of Instruction. Eur. J. Appl. Physiol 85: 345-350.
- Fitzgerald GK, Piva SR, Irrgang JJ (2003) A Modified Neuromuscular Electrical Stimulation Protocol for Quadriceps Strength Training Following Anterior Cruciate Ligament Reconstruction. J Orthop Sports Phys Ther 33(9): 492-501.
- Krishnan C, Williams GN (2011) Factors Explaining Chronic Knee Extensor Strength Deficits after ACL Reconstruction. J. Orthop. Res 29(5): 633-640.
- Lewek M, Rudolph K, Axe M, Snyder-Mackler L (2002) The Effect of Insufficient Quadriceps Strength on Gait after Anterior Cruciate Ligament Reconstruction. Clin Biomech (Bristol, Avon) 17(1): 56-63.
- Rudolph KS, Axe MJ, Snyder-Mackler L (2000) Dynamic Stability after ACL Injury: Who Can Hop? Knee Surg Sports Traumatol Arthrosc 8: 262-269.
- Snyder-Mackler L, Delitto A, Stralka SW, Bailey SL (1994) Use of Electrical Stimulation to Enhance Recovery of Quadriceps Femoris Muscle Force Production in Patients Following Anterior Cruciate Ligament Reconstruction. Phys Ther 74(10): 901-907.
- Bemben MG, Clasey JL, Massey BH (1990) The Effect of the Rate of Muscle Contraction on the Force-Time Curve Parameters of Male and Female Subjects. Res Q Exerc Sport 61(1): 96-99.
- Haffajee D, Moritz U, Svantesson G (1972) Isometric Knee Extension Strength as a Function of Joint Angle, Muscle Length and Motor Unit Activity. Acta Orthop Scand 43(2): 138-147.
- Balshaw TG, Hunter AM (2012) Evaluation of Electromyography Normalisation Methods for the Back Squat. Journal of Electromyography and Kinesiology 22(2): 308-319.
- Hunter AM, Galloway SD, Smith IJ, Tallent J, Ditroilo M, et al. (2012) Assessment of Eccentric Exercise-Induced Muscle Damage of the Elbow Flexors by Tensiomyography. Journal of Electromyography and Kinesiology 22(3): 334-341.
- Kobayashi Y, Hirayama K, Matsubayashi T, Akagi R (2013) Effect of Explosive-Type Strength Training and Short-Term Detraining on Rate of Torque Development During Isometric Knee Extension. Br J Sports Med 47: e4–e4.
- Peñailillo L, Blazevich A, Numazawa H, Nosaka K (2015) Rate of Force Development as a Measure of Muscle Damage. Scandinavian Journal of Medicine & Science in Sports 25(3): 417-427.
- Fowler J, Jarvis P, Chevannes M (2002) Practical Statistics for Nursing and Health Care; Wiley: Chichester ISBN 978-0-471-49716-5.
- Schober P, Boer C, Schwarte LA (2018) Correlation Coefficients: Appropriate Use and Interpretation. Anesthesia & Analgesia 126(5): 1763.
- Suzuki M, Ishida T, Samukawa M, Matsumoto H, Ito Y, et al. (2022) Rate of Torque Development in the Quadriceps after Anterior Cruciate Ligament Reconstruction with Hamstring Tendon Autografts in Young Female Athletes. IJERPH 19(18): 11761.
- Kline PW, Morgan KD, Johnson DL, Ireland ML, Noehren B (2015) Impaired Quadriceps Rate of Torque Development and Knee Mechanics After Anterior Cruciate Ligament Reconstruction With Patellar Tendon Autograft. Am J Sports Med 43(10): 2553-2558.
- McGuire R, Swann W, Jurjans J, Parker C, Pawley M, et al. (2025) Early Measures of Torque Development Are Related to Peak Torque at Six Months Following ACL Reconstruction. Int J Sports Phys Ther 20(4): 503-513.
- Baudry S, Duchateau J (2007) Postactivation Potentiation in a Human Muscle: Effect on the Rate of Torque Development of Tetanic and Voluntary Isometric Contractions. J Appl Physiol (1985) 102(4): 1394-1401.
- Miyamoto N, Kanehisa H, Fukunaga T, Kawakami Y (2011) Effect of Postactivation Potentiation on the Maximal Voluntary Isokinetic Concentric Torque in Humans. J Strength Cond Res 25(1): 186-192.
- Solie B, Carlson M, Doney C, Kiely M, LaPrade R (2024) Oh, My Quad: A Clinical Commentary And Evidence-Based Framework for the Rehabilitation of Quadriceps Size and Strength after Anterior Cruciate Ligament Reconstruction. IJSPT 19(12): 1600-1628.


