FT-IR or Raman Spectroscopy Identification of the Molecular Structure of Ficus Ovata Plant Parts Using Different Extraction Solvents
Fokunang Charles*2, Hoare Gary1, Tembe-Fokunang Estella2, Ngameni Bathelemy2, Salwa Barkwan1, Ngadjui Bonaventure2 and Paul Tomkins1
1Centre for Biopolymer and Bio-molecular Research, Athlone Institute of Technology, Ireland
2Department of Pharmaceutical Sciences and Traditional Pharmacopoeia, Faculty of Medicine and Biomedical Sciences, University of Yaounde, Cameroon
Submission: December 20, 2017; Published: January 11, 2018
*Corresponding author: Fokunang Charles, Department of Pharmaceutical Sciences and Traditional Pharmacopoeia, Faculty of Medicine and Biomedical Sciences, University of Yaounde, Cameroon, Tel: 237 94218670/237 22042070; Email: charlesfokunang@yahoo.co.uk
How to cite this article: Fokunang C, Hoare G, Tembe-F E, Ngameni B, Salwa B et.all. FT-IR or Raman Spectroscopy Identification of the Molecular Structure of Ficus Ovata Plant Parts Using Different Extraction Solvents. J of Pharmacol & Clin Res. 2018; 5(1): 555651.DOI:10.19080/JPCR.2018.05.555651
Abstract
The use of plants in herbal medicine has become very popular and well documented for many hundreds of plant species, and their extracts, are used in developing countries to treat numerous diseases despite the fact that only a small number are approved for therapeutic use by the FDA. Some species such as the Ficus genus have been used in the treatment of infectious diseases, abdominal pain and as anti-inflammatory agents. However, the cytotoxic effects of these plants have not been studied in detail, nor have their molecular structures been identified.
Aims: The aim of this study was to identify the molecular structure of a range of plant parts from a number of different species of the Ficus genus, in addition to other plant species, using both: Fourier Transform Infrared Spectroscopy (FT-IR) and Raman spectroscopy.
Method: Infrared spectra of stem, leaf, bark and trunk extracts (dissolved in a range of solvents) taken from each plant species were recorded, and the wave number of the dominant peak was obtained from the absorption spectra. Based on the components present in the sample, probable assignments of the bands were then made.
Results: FT-IR spectra of the extracts analysed revealed the wave number of the dominant peaks obtained from the absorption spectra of the various fractions isolated from each species.
Conclusion: FT-IR data obtained in this study also showed that many of the extracts analysed from the various species shared similar structures.
Introduction
Plants have a vital role to play in maintaining the environment, and sustaining life on the earth. The primary role of green plants is to take in the carbon dioxide produced on earth, and use this to produce food to feed themselves, and produce oxygen to discharge so that it can be used by all other non-green organisms [1,2]. Indeed, if this photosynthetic process was interrupted on a large-scale basis, then life on earth would not survive, so plants play a role in the existence and survival of other organisms. In addition, by taking in carbon dioxide, plants also help to reduce levels of carbon dioxide in the atmosphere, hence reducing pollution levels. An additional role of plants is to act as a main component of food webs, as they provide food for herbivores, and ultimately carnivores, while also having a role to play in the economy, as plants can be used in food, medicine, transportation, construction and fuel [3-5].
For thousands of years, plants have been recognised to play a therapeutic role in curing diseases and infections, and currently, there is a wide range of herbal remedies available in health food shops and other outlets, which many people are using to treat numerous problems, despite the fact that most herbal and plant remedies have not been approved for use by the FDA [6]. It is now realised that the therapeutic effects of plant products are mainly due to the phytochemicals found in these plants, as many are known to have a pharmacokinetic or pharmacodynamic interaction with certain drugs [7-9]. Because of these potential benefits of using plants in medicine, many species are now being analysed to identify the phytochemicals found in them.
Despite this, however, the safety of using plants in medicine is continuously being reviewed, and much work is being done to determine not only the efficacious effects of plants, but also their potential harmful effects [10]. Although it has been purported by some herbal remediests that the use of plants as herbal medicine is safe due to the fact that it is a "natural" substance, there have been a number of publications that indicate otherwise [11,12]. Some herbal medicines are known to have resulted in severe side- effects after ingestion, which may be due to the toxic properties of the herbs or plants used, while the interactions of the plants or herbal medicine with other drugs being used by the patient can also lead to adverse effects [3,12-15]. For example, a number of severe effects, including heart attack, stroke and even death have been reported following the use of products containing Ma huang (ephedrine) and kola nut due to the interaction of the caffeine in the kola nut and the ephedrine [16]. Numerous members of the Ficus species have been documented to be used for both food and medicine, and their use has been most widely documented in the Middle East, where many members of this species are known to grow.
Raman Spectroscopy
A useful technique in chemical analysis involves the use of Raman spectroscopy to obtain a fingerprint spectrum of the materials present in a substance [17]. This method of analysis can be used to obtain a chemical and morphological profile of a biological sample, and has previously been used in a number of different applications, such as the visualisation of the molecular changes in the tissue composition of the poplar plant cell wall, to characterise heterotrophic biofilm, and to identify differences in the pollen carotenoid content between species [18-21]. Raman spectroscopy can also be used to analyse the chemical composition of plant cell walls, in order to identify the molecules that contribute to their composition [8,22].
Raman spectroscopy involves gathering information on the vibrational motions of atoms in molecules, and analysis of this data can provide information on the distribution of electrons in chemical bonds in the sample analysed, the molecular environment of the sample and its molecular conformation [2,23]. The principle behind this method is that a laser beam interacts with the molecule to be analysed, and thereby interacts with the bonds of the molecule, and its electron cloud [24]. The molecule is then excited to a virtual energy state from its normal ground state by a photon, and as the molecule relaxes it returns to a different rotational state, and in doing so emits a photon [1,25]. Because there is a difference in energy between the molecule's new state and the original state, there will be a shift away from the excitation wavelength of the frequency in the emitted photon [9,26]. Because energy is transferred between molecules and photons as they interact during this process, this type of analysis is an example of inelastic scattering (or more commonly referred to in this technique as Raman scattering) [3,17]. The energy in this system must remain balanced, and as a result the emitted photon is shifted to a lower frequency if the final rotational state of the molecule is more energetic than that of its original state (referred to as the Stokes shift), while on the other hand if the final rotational state is less energetic than the initial state of the molecule, the emitted photon is shifted to a higher frequency (referred to as an anti-Stokes shift) [12,27].
Methods & Experimental Design
Plant Material: A number of species from the Ficus genus, along with species from the Dorstenia and Triumfetta genus were tested during this study. All plant species were collected from the jungle in Cameroon. The plant parts were isolated and the fractions tested.
FT-IR Spectroscopy: The FT-IR spectra of the various plant fractions were recorded using a Perkin-Elmer Spectrum One Universal ATR Sampling Accessory spectrometer in the region 4000-650 cm-1. [28].
Raman Spectroscopy: Raman measurements were obtained using a Reinshaw in Via Raman microscope. This system is based upon an upright microscope frame with a spectrometer attached. The laser provided power to the sample, through a 40 x objective. Each sample was read at a wavelength of 785nm. The fractions analysed by Raman spectroscopy, and the settings used for each, are outlined in Table 1.
Statistical Analysis: Absorbance levels for control samples were compared to the absorbance levels obtained for each concentration of extract used to determine if there were any significant differences between absorbance levels. In addition, results obtained for the concentrations of the extracts used were compared to each other to determine if there were any significant differences between the different concentrations.
Results
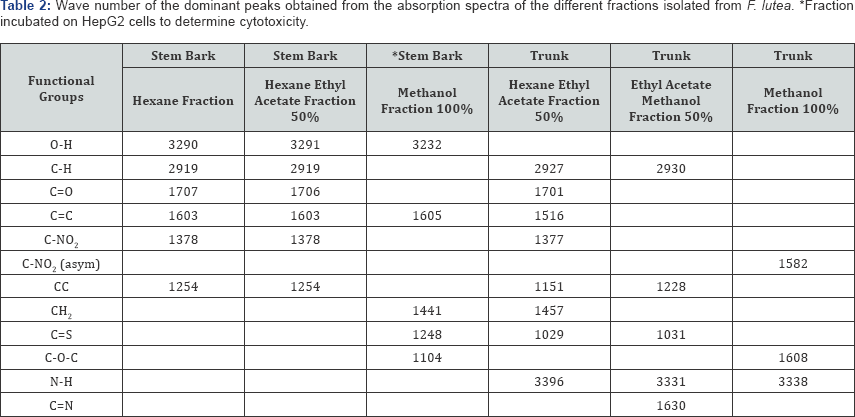
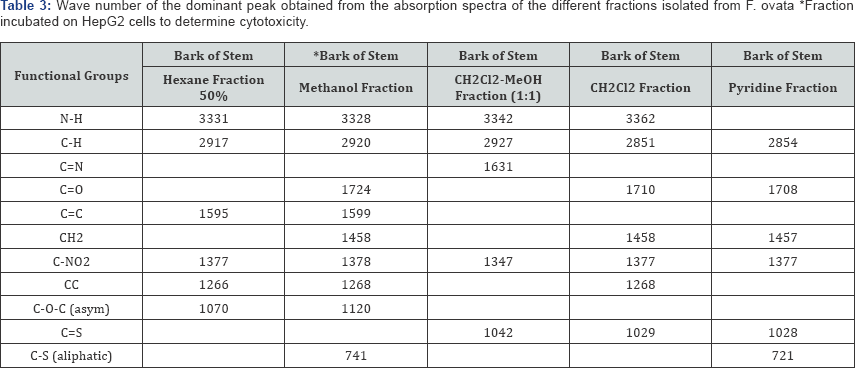
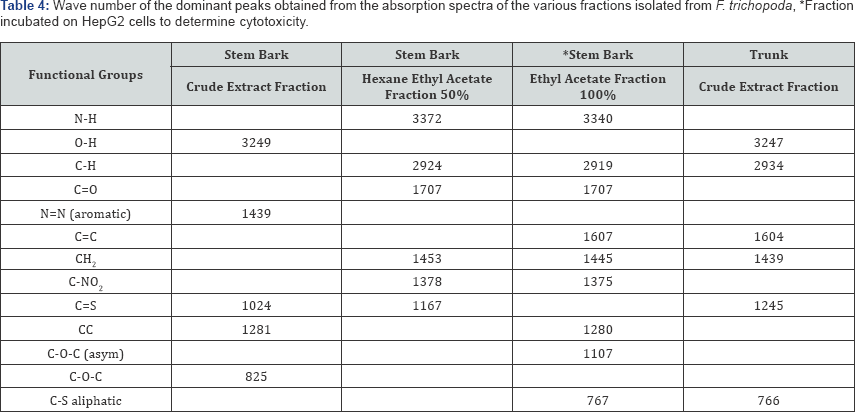
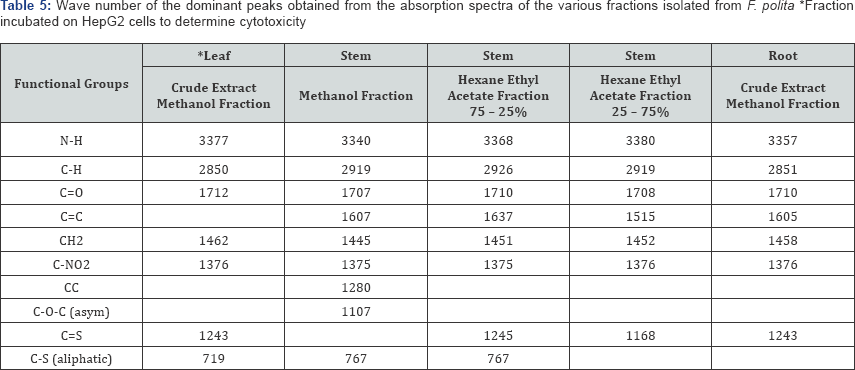
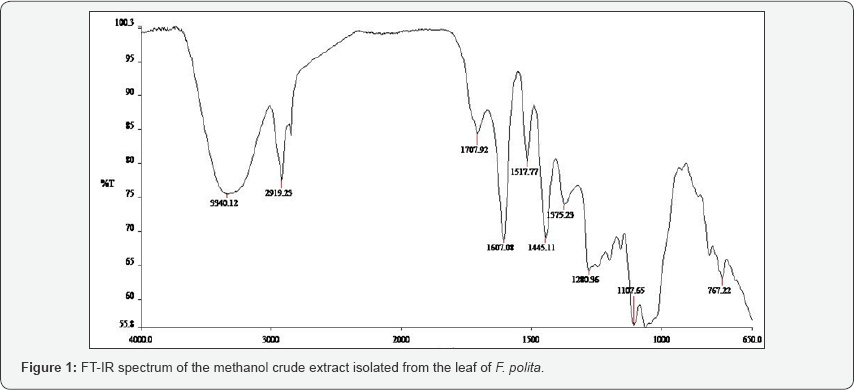
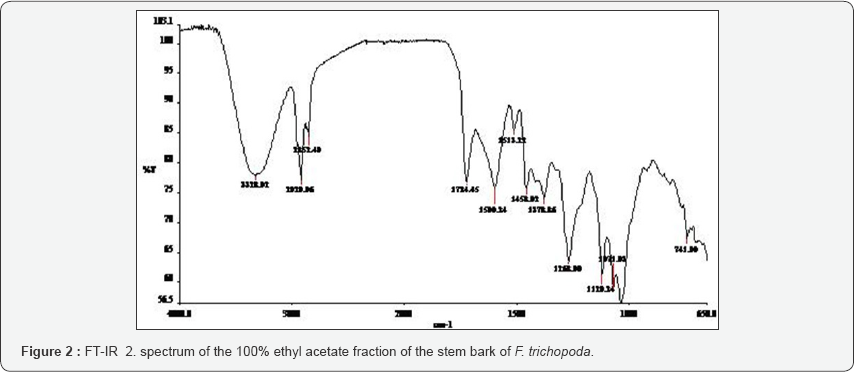
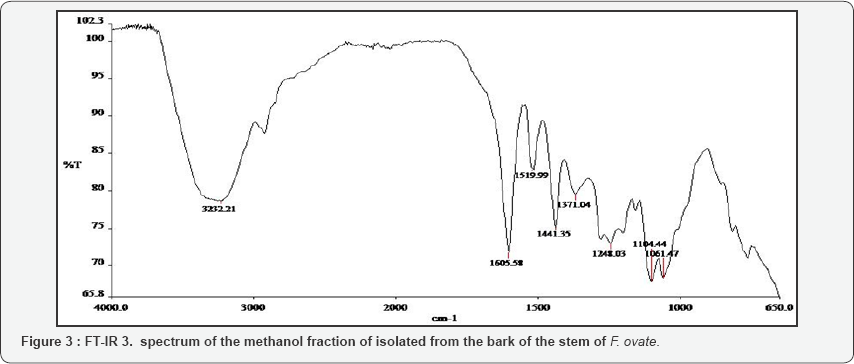
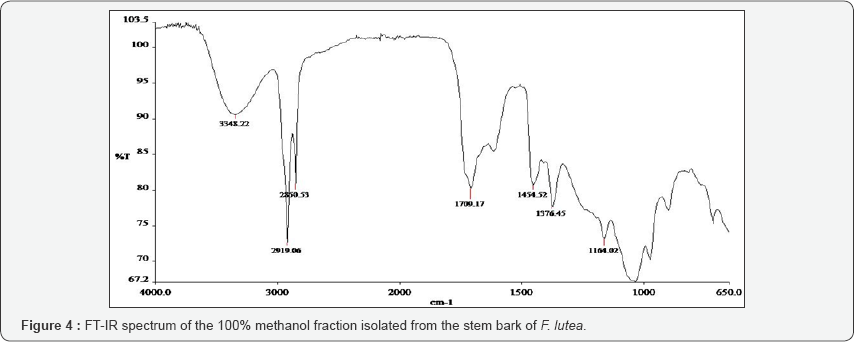
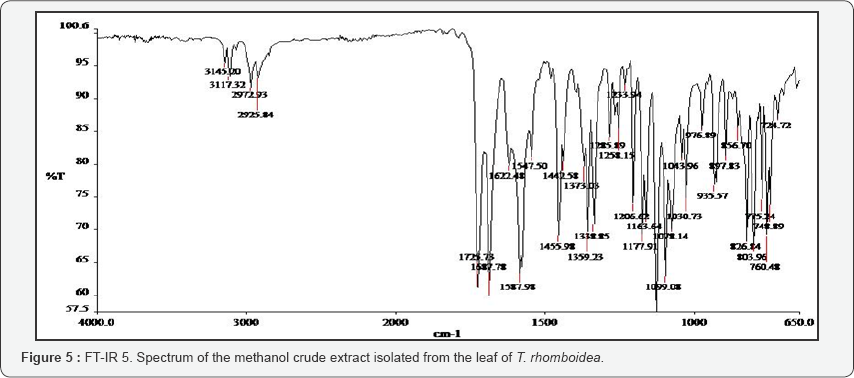
The FT-IR spectra of the plant parts like the leaf, stem, bark and root of the plant species F. lutea, F. polita, F. trichopoda, F. ovata, T. rhomboidea and D. elleptica are shown in Figures 1-5. A number of fractions from the bark of the stem of F. ovata were analyzed by FT-IR and it was found that both the hexane and methanol fractions analyzed were similar in structure. The wave number of the dominant peaks obtained from the absorption spectra of each of the fractions analysed from each species are presented in Tables 1-7.

Analysis of Wave Number of Dominant Peak from Various Plant Fractions
For F lutea, a number of fractions of both the stem bark and trunk were analysed by FT-IR and the wave number of the dominant peak obtained from the various fractions were outlined in Table 2. For each fraction of the stem bark analysed, a strong absorption band around 3232-3291 was observed, and may be due to the presence of an O-H group. In addition, each fraction of the stem bark analysed for F. lutea also showed a C=C group present. For both the hexane fraction, and hexane ethyl acetate fraction of the stem bark of F. lutea, very similar functional groups were observed, with results indicating that a C-H, C=O, and a C-NO2 group are present in both fractions. The 100% methanol fraction of the stem bark of F. lutea was shown to contain a CH2, C=S and C-O-C group. A number of fractions of the trunk of F. lutea were also analysed by FT-IR. Absorption spectra obtained from various fractions analysed are outlined in Table 7. The functional groups common to both the hexane ethyl acetate fraction and ethyl acetate methanol fraction include a C-H group and N-H group. Results also indicate that for the hexane ethyl acetate fraction of the trunk of a C=C, C=O, C-NO2, CH2, and C=S group was also present, while FT-IR results for the ethyl acetate methanol fraction of the trunk showed a C=N and C=S group present. A methanol fraction of the trunk of F. lutea was also analysed, and results indicate that the functional groups present include a C-O-C, N-H and C-NO2.
The bark of the stem of F. ovata was isolated and analysed by FT-IR. A number of fractions were analysed and the wave numbers of the dominant peaks are outlined in Table 3. The functional groups common to each fraction include the C-H and C-NO2 group. The functional groups present in the hexane fraction of the bark of the stem of the F. ovata include the N-H, C=C, C-NO2 and C-O-C asym group, while in the methanol fraction of the bark of the stem of F. ovata FT-IR results indicate that N-H, C=O, C=C, CH2, C-NO2 and C-O-C asym groups are present. A CH2Cl2-MeOH fraction of the bark of the stem of F. ovata was also analysed, and the functional groups detected include the N-H, C=N, C-NO2 and C=S groups, while in the CH2Cl2 fraction of the bark of the stem analysed showed N-H, C=O, CH2, C-NO2 and C=S present. In addition, a pyridine fraction of the bark of the stem of F. ovata was also analysed and results indicate that C=O, CH2, C-NO2 and C=S are present.
The wave numbers of the dominant peaks obtained from the various fractions obtained for F. trichopoda are outlined in Table 4. For both the hexane ethyl acetate fraction and ethyl acetate fraction of the stem bark of F. trichopoda, similar functional groups including the N-H, C-H, C=O, CH2, and C-NO2 being detected in both. The crude extract fraction of F.trichopoda that was analysed showed that the O-H, N=N (aromatic), C=S and C-O-C groups were present. In addition, the crude extract of the trunk of F. trichopoda was also analysed and the functional groups detected include the O-H, C-H, C=C, CH2 and C=S groups.
Fractions of the leaf, stem and root of F. polita was analysed by FT-IR and the wave numbers of the dominant peaks obtained are outlined in Table 5. A number of functional groups were found to be common in each of the fractions analysed, including the N-H, C-H, C=O, CH2, and C-NO2 groups. In addition to each of these groups, C=S and C-S aliphatic groups were also detected in the crude extract of the leaf of F. polita which was analysed, and a C=S group was also detected in the crude extract of the root of F. polita. In addition to each of the common functional groups detected, a C=S group was detected in each of the hexane ethyl acetate fractions (75 - 25% and 25 - 75%) of the stem of F polita, with a C-S aliphatic group being detected in the methanol and hexane ethyl acetate (75 - 25%) fractions of the stem of F. polita.
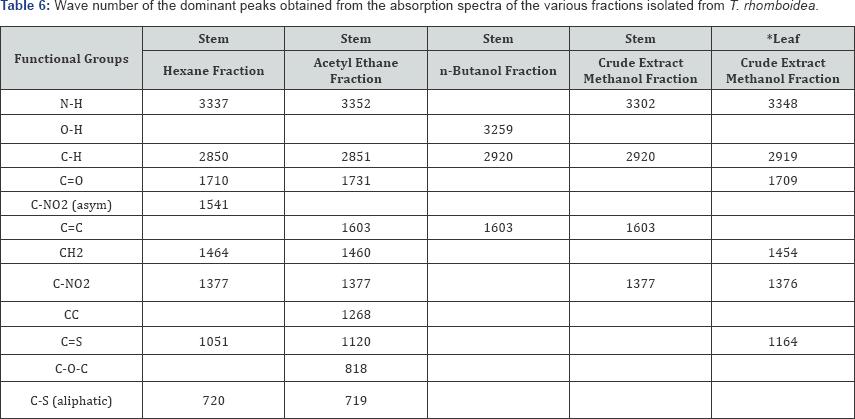
A number of extracts of T. rhomboidea were analysed by FT- IR and the wave number of the dominant peaks obtained are outlined in Table 6. A number of functional groups were found to be common between both the hexane and acetyl ethane fractions of the stem of T. rhomboidea that were analysed, including N-H, C-H, C=O, CH2, C-NO2 and C-S aliphatic groups. A number of functional groups were also found to be common between the n-butanol and crude extract methanol fraction of the stem including the C-H and C=C groups. An O-H group was also detected in the n-butanol fraction of the stem and a C-NO2 detected in the crude extract methanol fraction of the stem of T. rhomboidea. A crude extract methanol fraction of the leaf of T. rhomboidea was also analysed and it was found that N-H, C-H, C=O, CH2, C-NO2 and C=S were present.
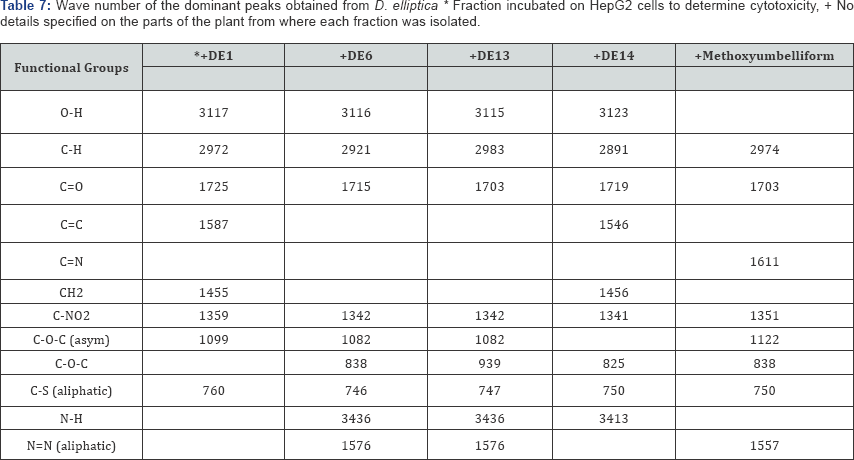
The wave numbers of the dominant peaks of the various fractions of D. elliptica that were analysed are outlined in Table 7. The functional groups that were found to be common between each fraction analysed include the C-H, C=O, C-NO2, C-O-C and C-S aliphatic groups. In addition, an O-H group was detected in all fractions tested apart from the methoxyumbelli form fraction. A C-O-C asym group was also detected in all fractions apart from the DE14 fraction, and a C-O-C group detected in all fractions apart from the DE1 fraction. An N-H group was detected in the DE6, DE13 and DE14 fractions, while an N=N aliphatic functional group was detected in the DE6, DE13 and methoxyumbelli form fractions.
Discussion
The FT-IR spectrum of each plant fraction was obtained, and the functional groups present in each fraction were then compared. The trunk and the stem bark were isolated from F. lutea, and various fractions of each were analysed by FT-IR. It was found that for both the hexane and hexane ethyl acetate fraction for the stem bark of F. lutea, very similar functional groups were present, indicating that these fractions are very similar in structure. Both of these fractions contain O-H, C=O, C=C and C-NO2 but the methanol fraction of the stem bark of F. lutea appears different in structure as it contains the functional groups CH2, C=S and C-O-C. Three fractions of the trunk of F. lutea were also analysed, but little similarity was observed between each of these fractions, with the hexane ethyl acetate fraction containing C-H, C=O, C=C, C-NO2, CH2 and C=S groups, the ethyl acetate methanol fraction containing C-H, C=S and C=N groups and the methanol fraction containing C-O-C and N-H groups.
Raman spectroscopy has been used to characterize pollen carotenoids with in situ and high-performance thin-layer chromatography supported resonant [28]. A number of fractions from the bark of the stem of F. ovata were analysed by FT-IR and it was found that both the hexane and methanol fractions analysed were similar in structure, as both were found to contain N-H, C-H, C=C, C-NO2 and C-O-C asym groups. The CH2Cl2 and pyridine fractions were also found to be similar, both containing C-H, C=O, CH2, C-NO2 and C=S groups. The CH2Cl2-MeOH fraction of the bark of the stem of F. ovata was found to contain the functional groups C-H, C=N, C-NO2 and C=S groups so its structure appears different to the other fractions of this species. Extracts of the leaf, stem and root of F. polita were analysed by FT-IR. Each of the fractions analysed for the stem showed similar structures, containing the functional groups N-H, C-H, C=O, C=C, CH2, and C-NO2 groups. The crude extract methanol fraction of the leaf that was analysed was found to contain the functional groups N-H, C-H, C=O, CH2, C-NO2 and C=S while the crude extract methanol fraction of the root contains the groups N-H, C-H, C=O, C=C, CH2, and C=S groups.
For F trichopoda the FT-IR spectrum of different fractions of the trunk and bark of the stem were examined. The crude extract fraction of the trunk was analysed, and the O-H, C-H, C=C, CH2 and C=S functional groups were found to be present. A number of functional groups were found to be shared between the hexane ethyl acetate and ethyl acetate fractions of the stem bark, including the N-H, C-H, C=O, CH2, and C-NO2 groups, indicating both these fractions have similar structures. The FT-IR spectrum of the crude extract fraction of the stem bark which was obtained showed that the functional groups O-H, N=N (aromatic), C=S and C-O-C are present, indicating that this fraction is somewhat different in structure to the other fractions of the stem bark. Determination of glucose and ethanol after enzymatic hydrolysis and fermentation of biomass has been elucidated using Raman spectroscopy [29,30].
T. rhomboidea was also analysed by FT-IR, and the FT- IR spectrum obtained for both the hexane and acetyl ethane fractions of the stem indicates that each of these fractions are very similar in structure as both share the functional groups N-H, C-H, C=O, CH2 and C=S groups. Analysis of the n-butanol fraction of the stem was shown to contain the groups O-H, C-H and C=C, while the crude extract methanol fraction contains the N-H, C-H, C=C and C-NO2 groups. The crude extract methanol fraction of the leaf of T. rhomboidea was shown to contain the groups N-H, C-H, C=O, CH2 and C=S. A number of extracts of D. elliptica were also analysed by FT-IR. Analysis of the spectra of the DE6, DE13 and DE14 fractions showed that each of these fractions share very similar structures due to the functional groups that were common between each fraction. The DE1 fraction was also analysed and showed that O-H, C-H, C=O, C=C, CH2 and C-NO2 groups are present, while in the methoxyumbelli form fraction it was found that C-H, C=O, C=N, C-NO2 and C-O-C groups were present. One sample from each plant species was also analysed by Raman spectroscopy, and a Raman spectra was obtained for each of the fractions analysed.
Conclusion
FT-IR data obtained in this study showed that many of the extracts analysed from the various species shared similar structures. It was found that for both the hexane and hexane ethyl acetate fraction for the stem bark of F. lutea, very similar functional groups were present, indicating that these fractions were very similar in structure. This study also showed that Raman spectroscopy is a difficult method to establish, and it requires much time to optimize the correct procedures for its use in the analysis of the molecular structures of plant fractions. However, FT-IR is a suitable method for the analysis of the functional groups present in different fractions of plant species, and it allows comparisons of the molecular structures of different plant fractions to be made.
Acknowledgement
We gladly thank the Centre for Biopolymer and Bimolecular research of the Athlone Institute of Technology, Ireland for the technical and financial support of this project. The Ministry of Higher Education for the research allowance support.
References
- Xie C, Chen D, Li YQ (2005) Raman sorting and identification of single living micro-organisms with optical tweezers. Opt Lett 30(14): 18001802.
- Ao, Li, Elozaawely, Xuan, Tawata (2008) Evaluation of antioxidant and antibacterial activities of Ficus microcarpa L.fil. Extract. Food Control 19: 940-948.
- Blanch, Hecht, Barron (2003) Vibrational Raman optical activity of proteins, nucleic acids, and viruses. Methods 29(2): 196-120.
- Bush, Rayburn, Holloway, Sanchez-Yamamoto, Allen, et al. (2007) Adverse interactions between herbal and dietary substances and prescription medications: a clinical survey. Altern Ther Health Med 13(2): 30-35.
- Wagner, Ivleva, Haisch, Niessner, Horn (2009) Combined use of confocal laser scanning microscopy (CLSM) and Raman microscopy (RM): investigations on EPS-Matrix. Water Res 43: 63-76.
- Cao, Shen, Lu, Huang (2006) A Raman-scattering study on the net orientation of bio-macromolecules in the outer epidermal walls of mature wheat stems (Triticum aestivum). Ann Bot 97: 1091-1094.
- Chan, Esposito, Talley, Hollars, Lane, Huser (2004) Reagent-less identification of single bacterial spores in aqueous solution by confocal laser tweezers Raman spectroscopy. Anal Chem 76: 599-603.
- Devmurari, Ghodasara, Jivani (2010) Antibacterial Activity and Phytochemical Study of Ethanolic Extract of Triumfetta Rhomboidea Jacq. International Journal of PharmTech Research 2: 1182-1186.
- Dokken, Erickson, Castro (2002) Fourier-Transform Infrared Spectroscopy as a Tool to Monitor Changes in Plant Structure in Response to Soil Contaminants. Waste Research Technology.
- Edwards, Jorge Villar, de Oliveria, Le Hyaric (2005) Analytical Raman Spectroscopic Study of Cacao Seeds and their Chemical Extracts. Analytica Chimica Acta 538: 175-180.
- Gessner, Winter, Rosch, Schmitt, Petry, et al. (2004) Identification of biotic and abiotic particles by using a combination of optical tweezers and in situ Raman spectroscopy. Chemphyschem 5: 1159-1170.
- Gierlinger, Schwanninger (2006) Chemical imaging of poplar wood cell walls by confocal Raman microscopy. Plant Physiol 140: 1246-1254.
- Hamden, Bryan, Ford, Xie, Li, Akula (2005) Spectroscopic analysis of Kaposi's sarcoma-associated herpes virus infected cells by Raman tweezers. J Virol Methods 129(2): 145-151.
- Huh, Chung, Erickson (2009) Surface enhanced Raman spectroscopy and its application to molecular and cellular analysis. Microfluid Nanofluid 6: 285-297.
- Kacurakova, Sasinkova, Wellner, Ebringerova (2000) FT-IR study of plant cell wall model compounds: pectic polysaccharides and hemicelluloses. Carbohydrate Polymers 43: 195-203.
- Uttara, Mohini (2008) Evaluation of antioxidant activity of aqueous extract bark of Ficus glomerata. Research Journal of Pharmacy and Technology 1: 537-538.
- Kubmarawa, Ajoku, Enwerem, Okorie (20078) Preliminary Phytochemical and Antimicrobial Screening of 50 Medicinal Plants from Nigeria. Journal of Biotechnology 6: 1690-1696.
- Lam (2004) A New Era in Affordable Raman Spectroscopy. Raman Technology for Today's Spectroscopists 59(3): 30-37.
- Mannie, McConnell, Xie, Li (2005) Activation-dependent phases of T cells distinguished by use of optical tweezers and near infrared Raman spectroscopy. J Immunol Methods 297: 53-60.
- Sirisha, Sreenivasulu, Sangeeta, Chetty (2010) Antioxidant Properties of Ficus Species - A Review. International Journal of PharmTech Research 2: 2174-2182.
- Sivakumar, Kumar, Sivakumar, Nethaji, Vijayabaskaran, et al. (2008) Antitumor and Antioxidant Activities of Triumfetta Rhomboidea against Dalton's Ascites Lymphoma Bearing Swiss Albino Mice. Research Journal of Medicinal Sciences 2: 203-208.
- Kuete, Kamga, Sandjo, Ngameni, Poumale, Ambassa, Ngadjui (2010) Antimicrobial activities of the methanol extract, fractions and compounds from Ficus polita Vahl. (Moraceae). BMC Complement Altern Med 11: 6.
- Mevy, Bessiere, Rabier, Dherbomez, Ruzzier, Millogo, Viano (2006) Composition and Antimicrobial Activities of the Essential Oils of Triumfetta Rhomboidea Jacq. Flavour and Fragrance Journal 21: 80-83.
- Nan, Cheng, Xie (2003) Vibrational imaging of lipid droplets in live fibroblast cells with coherent anti-Stokes Raman scattering microscopy. J Lipid Res 44: 2202-2208.
- Ramser, Bjerneld, Fant, Kall (2003) Importance of substrate and photo-induced effects in Raman spectroscopy of single functional erythrocytes. J Biomed Opt 8: 173-178.
- Rodriguez-Fragoso, Reyes-Esparza, Burchiel, Herrera-Ruiz, Torres (2008) Risks and benefits of commonly used herbal medicines in Mexico. Toxicol Appl Pharmacol 227: 125-135.
- Salzer, Steiner, Mantsch, Mansfield, Lewis (2000) Infrared and Raman imaging of biological and biomimetic samples. Fresenius J Anal Chem 366: 712-716.
- Sanderson, Ward (2004) Analysis of liposomal membrane composition using Raman tweezers. Chem Commun (Camb) pp. 1120-1121.
- Schulte, Mader, Kroh, Panne, Kneipp (2009) Characterization of pollen carotenoids with in situ and high-performance thin-layer chromatography supported resonant Raman spectroscopy. Anal Chem 81(20): 8426-8433.
- Shih, Smith (2009) Determination of glucose and ethanol after enzymatic hydrolysis and fermentation of biomass using Raman spectroscopy. Anal Chim Acta 653(2): 200-206.


