Abstract
Taxonomic evaluation is one of the challenges that are being faced by taxonomists. They use different criteria to evaluate taxonomic validity of a given lineage. In the present study, we evaluate different populations of s in Iran by using morpho-ecological approach. Our morphological results confirmed separation of T. a. khuzestanensis, southeastern Iran and Qom groups, from other central and northeastern groups. Ecological niche of T. a. khuzestanensis as well as southeastern, Qom and northeastern Iranian populations can be distinguished from other groups. Differences are due to local adaptations and the geological history of the taxa. The Central Iranian Plateau aridification, after Zagros Mountain uplifting, created constant environmental conditions, which may have affected the central Iranian groups. Other smaller groups distributed in southeastern Iran, T. a. khuzestanensis, T. sanguinolentus and Qom groups are isolated from central populations and adapted locally.
Keywords: Morphology; Adaptation; Steppe agama; Iranian Plateau; Ecological niche modeling.
Introduction
During recent years, using the molecular method among taxonomists has been increased and surely in taxonomic decisions has been talked on their molecular phylogeny [1-4]. In some cases, morphology and molecular method cover each other completely and confirm their result [5], however, results by these two methods are sometimes conflicting [6]. There are different concepts for species recognition: molecules, morphology, ecology, phylogeny, etc. [7]. In addition to molecules and morphology, there is ecological species concept which also conflict in some cases with molecular or morphological criteria. The steppe agamas of the genus Trapelus Cuvier, 1816, have wide distribution range in Western Asia [8].
Trapelus agilis species complex is one of the members of the genus distributed on the Iranian Plateau and Central Asia. Comprehensive morphological analyses have been done on the species from all over the range, but no distinct morphological differences have been distinguished among them [9]. The species divided into four subspecies as T. a. sanguinolentus distributed in Central Asia and bordered to Kopet-Dagh valleys, T. a. s distributed in Central Plateau and eastern part of Iranian Plateau in Afghanistan and Pakistan, T. a. pakistanensis distributed south eastern part of Pakistan at the border with India and T. a. khuzestanensis in south western Iran and coastal regions of Persian Gulf. Based on the latest phylogenetic study, T. sanguinolentus reach to the species level and excluded from the T. agilis species complex [10]. Authors have been done a molecular phylogenetic study on the species complex in the distribution range and found that T. sanguinolentus make a distinct lineage in relation to T. agilis, but other populations of T. agilis complex make at least six genetic lineages [11]. In the present paper, we aim to investigate morphological and ecological features of these defined lineages and examine them whether there are differences among them in molecular approach.
Materials and Methods
Morphological analyses
All examined specimens were collected during fieldwork in the Iranian Plateau from 2010 to 2017. Finally, we selected 43 male specimens belong to 7 taxonomic operational units (OTUs) or genetic lineages and 15 morphological characters (three metric and 12 meristic) were measured for them. Metric characters were measured using digital caliper with 0.1 accuracy and the meristic characters were counted using Olympus loop. All examined specimens defined into 7 OTUs as: sanguinolentus; Khuzestan; southeast Iran; eastern central plateau; eastern Iran; central plateau; and Qom. All analyses were done under SPSS 16.0 (Inc SPSS) and first all characters were evaluated for normal distribution. Based on both Kolmogroph-Spirnov and Shapiro-Wilks tests, meristic characters were normally distributed. Nonparametric K-independent sample test (Kruskal-Walli’s test) was done for meristic characters. Then, Principal Component Analyses (PCA) and Canonical Variate Analyses (CVA) were done for significant characters between the OTUs. A descriptive table was provided to compare the mean, minimum and maximum of characters among the OTUs.
4.2. Species distribution modeling (SDM)
For the habitat suitability analyses, 299 presence records were collected from literature and obtained fieldwork. The records were grouped based on the OTUs and divided into seven groups as mentioned above. Nineteen bioclimatice variables were downloaded from worldclim website [12]; www.worldclim.org) in 30 arc-sec resolution. The layers were clipped using ArcGIS 10.3 (ESRI) for the study area. Correlation coefficients were calculated between variables by ENMTools 1.3 [13] and the high correlated variables more than 0.7 were eliminated from analyses [14]. The Maximum Entropy (MaxEnt) algorithm was employed to achieve the SDMs [15]. All analyses were done with default setting of MaxEnt, but under 10 replicate for each group. The model accuracy can be followed by Area Under the Curve (AUC) value that is ranged between 0.5 (the model not better than random) and 1 (the model is excellent) [16]. Then, niche overlap was calculated among all groups using ENMTools 1.3 [17] that mean the level of realized niche for each pair of groups. Based on niche overlap, two indices were obtained as Schoener’s D and Hellinger’s-based I [18]. Schoener’s D calculates the suitable range for a given species based on probability distributions for inhabiting particular regions, but Hellinger’s-based I only based on probability distribution and without Schoener’s D result.
Results
Morphological analyses
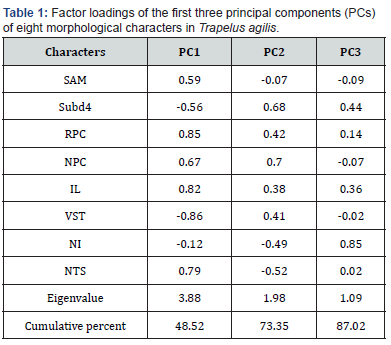
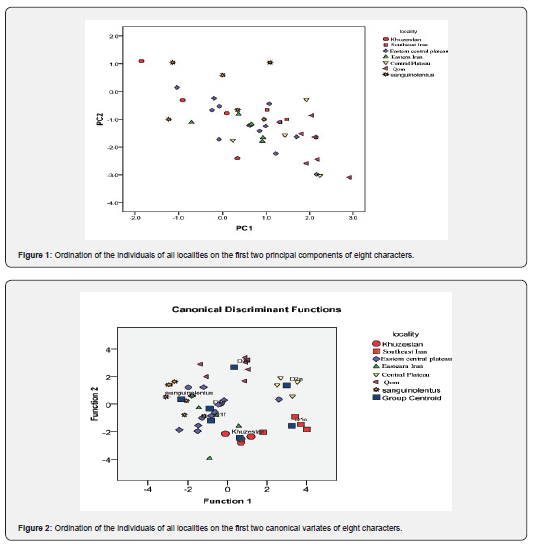
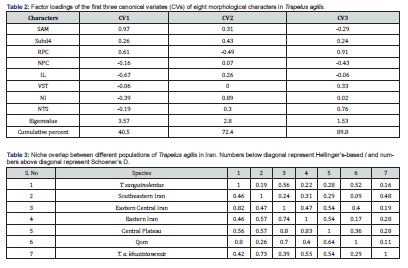
Based on the normality test, all meristic characters had normal distribution under Shapiro-Wilks test, and then we performed non-parametric Kruskal-Walli’s test to achieve the significant variables between groups. Eight meristic characters showed significant level among all groups as: Scales Around Midbody (SAM); Sub digital lamellae under the fourth toe (subd4); Row of preanal callose scales (RPC); Number of preanal callose scales (NPC); Infralabials (IL); Ventrals transversal (VST); Number of internasal (NI); Tympanum spinose scales (NTS). The PCA was done using significant characters among all groups and the first three components explained 87% of all variance (Table 1) and VST was the most important variable among others in first PC. The PCA graph didn’t show differences between groups clearly and examined specimens distributed mixed together (Figure 1). The CVA also shows the significant difference among groups under first three CVs with more than 89% explanation of variance. Based on the CVA graph, groups in eastern Iran, northeastern Iran and eastern-central plateau mixed together (Figure 2).

Ecological Niche Modelling (ENM)
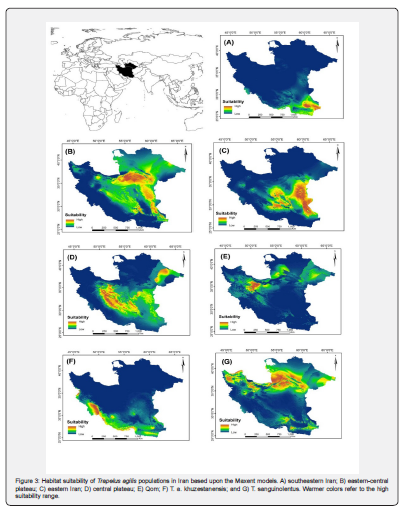
According to Ecological niche modeling the habitat suitability of each group covered the current distribution range like T. a. khuzestanensis, southeast Iran and Qom (Figure 3A, 3E, 3F), but other maps show wider range as suitable area for groups distribution such as T. sanguinolentus, eastern Iran, central plateau and eastern-central plateau (Figure 3B, 3C, 3D, 3G). Suitable ranges also covered other groups partially, but the niche overlap was calculated to obtain degree of overlap between them (Table 2). Niche overlap among these groups indicated that most of the groups show differentiated niche overlap with each other (Qom and southeast Iran show 9% overlap). Group belong to the type locality range was more similar to the eastern-central plateau and eastern Iran groups (more than 50% overlap) than others (Table 3). Finally, based on the ecological analyses, Trapelus agilis can be divided into four distinct clades in Iran as southeastern Iran, Central Plateau, T. a. khuzestanensis and Qom clades. Trapelus sanguinolentus clearly separated from all groups and just central plateau, eastern Iran and eastern central plateau groups cannot be separated from each other.

Discussion
Geographic variation of Trapelus agilis was one of the interesting case studies for herpetologists and Rastegar-Pouyani examined all populations of the species all over the distribution range morphologically. Morphology couldn’t show high differentiation between all populations of the species, and then we decided to examine all populations with molecular markers. Our results indicated that morphology and ecology cannot confirm each other, differing in grouping and similarity of groups. Local adaptation is one of the evolutionary procedures [19] that has taken place when a population isolated from other populations ecologically. This isolation maybe created by climate change or geographic barriers [20], however, isolation of three groups (southeastern Iran, T. a. khuzestanensis and Qom) is clearly compatible with ecological results. On the other hand, after ecological niche differentiation, it needs more time to select more beneficial features as morphological characters by natural selection procedure [21]. It can be assumed that the time is not sufficient to show the morphological differentiation among all distinguished groups.


Trapelus sanguinolentus was previously upgraded into species level and here we confirm its status. Trapelus agilis khuzestanensis has the potential to get the specific level morphologically and ecologically. Other groups like Qom, central and eastern Iran show different clustering patterns, because generally their distribution range has similar ecological condition and probably these conflicts among molecular, morphological and ecological results might be raised from different pressures and speed of local adaptations. Based on the molecular results, the central plateau populations having the longest divergence time than the other populations (Shahamat et al., submitted). So, it can be assumed that constant climatic conditions from the Zagros uplifting in central plateau (12 MYA;) [22] didn’t have enough evolutionary pressure to force the population. However, surrounded populations (such as T.a. khuzestanensis, Qom and southeastern Iran) are clearly distinctive from other central groups and two concepts can be confirmed by them [23,24]. At the end, different taxonomic methods like karyotype analyses, microsatellite analyses and geometric morphometric can be proposed for future studies to resolve the taxonomic status of Trapelus agilis species complex on the Iranian Plateau.
References
- Glenn AE, Bacon CW, Price R, Hanlin RT (1996) Molecular phylogeny of Acremonium and its taxonomic implications. Mycologia 369-383.
- Levesque CA, De Cock AW (2004) Molecular phylogeny and taxonomy of the genus Pythium. Mycological research, 108(12), 1363-1383.
- Dayrat B (2005) Towards integrative taxonomy. Biological journal of the Linnean society 85(3): 407-417.
- Hedges SB, Duellman WE, Heinicke MP (2008) New World direct-developing frogs (Anura: Terrarana): molecular phylogeny, classification, biogeography, and conservation. Zootaxa 1737(1): 1-182.
- Eernisse DJ, Kluge AG (1993) Taxonomic congruence versus total evidence, and amniote phylogeny inferred from fossils, molecules, and morphology. Molecular Biology and Evolution 10(6): 1170-1195.
- Schulte JA, Valladares JP, Larson A (2003) Phylogenetic relationships within Iguanidae inferred using molecular and morphological data and a phylogenetic taxonomy of iguanian lizards. Herpetologica 59(3): 399-419.
- Mayr E (1996) What is a species, and what is not?. Philosophy of science 63(2): 262-277.
- Šmíd J, Moravec J, Kodym P, Kratochvíl L, Hosseinian Yousefkhani SS, Frynta D (2014) Annotated checklist and distribution of the lizards of Iran. Zootaxa 3855(1):1-97.
- Rastegar-Pouyani N (2005) A multivariate analysis of geographic variation in the Trapelus agilis complex (Sauria: Agamidae). Amphibia-Reptilia 26(2): 159-173.
- Pyron RA, Burbrink FT, Wiens JJ (2013) A phylogeny and revised classification of Squamata, including 4161 species of lizards and snakes. BMC evolutionary biology 13(1): 93.
- Shahamat AA, Rastegar-Pouyani N, Rastegar-Pouyani E, Hosseinian Yousefkhani SS, et al. (2018) Molecular phylogeny and intraspecific differentiation of the Trapelus agilis species complex (Sauria: Agamidae) inferred from mitochondrial DNA sequences. Peer J 17: 8: e8295
- Hijmans RJ, Cameron SE, Parra JL, Jones PG, Jarvis A (2005) Very high-resolution interpolated climate surfaces for global land areas. International journal of climatology, 25(15): 1965-1978.
- Warren DL, Glor RE, Turelli M (2010) ENMTools: a toolbox for comparative studies of environmental niche models. Ecography, 33(3): 607-611.
- Rounaghi I, Yousefkhani SSH (2018) Effects of climate change on niche shifts of Pseudotrapelus dhofarensis and Pseudotrapelus jensvindumi (Reptilia: Agamidae) in Western Asia. PloS one, 13(5): e0197884.
- Phillips SJ, Anderson RP, Schapire RE (2006) Maximum entropy modeling of species geographic distributions. Ecological modelling, 190(3-4): 231-259.
- Bradley AP (1997). The use of the area under the ROC curve in the evaluation of machine learning algorithms. Pattern recognition 30(7): 1145-1159.
- Warren DL, Glor RE, Turelli M (2008) Environmental niche equivalency versus conservatism: quantitative approaches to niche evolution. Evolution 62(11): 2868-2883.
- Schoener TW (1968) The Anolis lizards of Bimini: resource partitioning in a complex fauna. Ecology 49(4): 704-726.
- Beyer HG, Schwefel HP (2002) Evolution strategies–A comprehensive introduction. Natural computing 1(1): 3-52.
- Endler JA (1977) Geographic variation, speciation, and clines. Princeton University Press 262.
- Nosil P, Vines TH, Funk DJ (2005) Reproductive isolation caused by natural selection against immigrants from divergent habitats. Evolution 59(4): 705-719.
- Ahmadzadeh F, Carretero MA, Harris DJ, Perera A, Böhme W (2012) A molecular phylogeny of the eastern group of ocellated lizard genus Timon (Sauria: Lacertidae) based on mitochondrial and nuclear DNA sequences. Amphibia-Reptilia 33(1): 1-10.
- Hillis DM (1987) Molecular versus morphological approaches to systematics. Annual review of Ecology and Systematics 18(1): 23-42.
- Webb CO, Ackerly DD, McPeek MA, Donoghue MJ (2002) Phylogenies and community ecology. Annual review of ecology and systematics 33(1): 475-505.


