


Trends and Variability of Climate and Summer Season Vegetation Index in the Qinling Mountains’ Giant Panda Habitat, China
Runnström M1*, Liu X2*, Wu P2,3, Ólafsdóttir R4 and Li Z2
1Department of Physical Geography and Ecosystem Science, Lund University, Sweden
2State Key Joint Laboratory of Environment Simulation and Pollution Control, School of Environment, Tsinghua University Beijing, 100084 China
3College of Biological Science, Chinese Agricultural University, 100193 Beijing, China
4Department of Geography and Tourism , Faculty of Life and Environmental Sciences, University of Iceland, Iceland
Submission: July 29, 2022; Published: August 17, 2022
*Corresponding author: Micael Runnström, Department of Physical Geography and Ecosystem Science, Lund University, Sweden
Xuehua Liu, School of Environment, Tsinghua University, Beijing 100084, China
How to cite this article: Runnström M, Liu X, Wu P, Ólafsdóttir R, Li Z. Trends and Variability of Climate and Summer Season Vegetation Index in the Qinling Mountains’ Giant Panda Habitat, China. JOJ Wildl Biodivers. 2022: 4(4): 555643 DOI: 10.19080/JOJWB.2022.04.555643
Abstract
The third national survey in China on giant panda population undertaken in 2004 counted about 1600 individuals in the wild. Great conservation effort has been made to construct panda reserve networks in the Qinling Mountain Nature Reserves to enlarge and protect the habitat, home to about 20% of the total wild population in China. This paper monitors change in vegetation activity between 1982 and 2006 which has been influenced by both human activities and climate. Pixel by pixel, at 8 km spatial resolution the intrinsic trend through the 25 annually created summer season images (mid-May to mid-August) of Normalized Difference Vegetation Index (NDVI) was calculated providing a spatial map of change. The results indicate that the Nature Reserve areas in general are experiencing decreasing trends of NDVI which could mean that the photosynthetic activity of the forests is declining and thus the biological production. Comparisons of climatic variables from the area show a corresponding decline in annual precipitation amounts and a profound high increase in annual mean temperature. Climate is therefore, apart from the rather recent conversion to Nature Reserves in 1998-1999 when commercial utilization of the forest was prohibited the most likely cause for the negative NDVI trends. These results emphasize the importance of further close monitoring of climate and its impact on Giant Panda habitats in the Qinling Mountain Nature Reserves.
Keywords: NDVI; Climate Change; Giant Panda; Qinling Mountains; China; National Oceanographic and Atmospheric Administration; Endangered species; Natural Forest Protection Programme; Wildlife; Global Environment Monitoring Index
Introduction
The Giant Panda (Ailuropoda melanoleuca) is one of the world’s most endangered species with a population of 1000-2000 individuals left in the wild (2004 decennial census), mainly living in central China [1-3]. Approximately 25% (200-300 individuals) of the total wild population of Giant Pandas in China is found in the Shaanxi Province, more precisely within a network of twenty-two Nature Reserves located in the Qinling Mountain range [3]. These nature reserves shelter a somewhat safe haven for the Giant Panda and other endangered species, including the Golden Snub-nosed Monkey (Rhinopithecus roxellana) [4], Golden Takin (Budorcas taxicolor) [5], and Asian Crested Ibis (Nipponia nippon) [6]. The Nature Reserves in the Qinling Mountains are identified as a Global 200 ecoregion by the World Wild Fund [3] and in partnership with the Chinese government, green bamboo corridors have been created to link the different panda communities and stimulate their migration and mating [7].
It has been shown that the Giant Panda is sensitive to environmental change, both as regard climate as well as the biological environment [8], and in summer the pandas migrate for example to higher and cooler elevation. Rising temperatures as a result of global warming is likely to cause environmental changes within this Global 200 ecoregion and such changes may have severe impact on habitats and seriously affect the Giant Panda population. This is also emphasized by [9] revealing a substantial reduction of three bamboo species within the Qinling Mountains as a result of climate change which could reveal a potential shortage of food for the panda population.
Guarding endangered species that are protected within Global 200 eco-regions should therefore require regular monitoring of climatic parameters and vegetation in order to comprehend natural variations and intrinsic trends. We may then increase our understanding of how climate change is affecting these environments and to better manage vulnerable populations such as the wild Giant Panda population in the Qinling Mountain Nature Reserve.
The general aim of this study is to monitor long-term trends of climate and vegetation activity in the Qinling Mountain Nature Reserves in China. Vegetation activity is inferred through a vegetation index from satellite sensed data for a 25-year period registered by the National Oceanographic and Atmospheric Administration (NOAA) series between 1982 and 2006. Climate data measurements from the area are further analyzed to assess temporal climatic variability and trends for temperature and precipitation between 1952 and 2012.
Study area
The Qinling Mountain Nature Reserves are located within the Shaanxi Province in the central part of China (Figure 1). The Qinling Mountain range stretches about 1600 km from east to west and 300 km from North to South, and elevates up to 3000 m. The mountain range divides the climate in China as the high mountains obstruct cold northern winds in the winter to reach the southern parts of China and also the moist summer monsoon from the south-east on its path to the northern territories [10]. The Qinling Giant Panda Conservation Network consists of 22 Nature Reserves, a total area of approximately 4700 km2 area, and reaches up to 3000 m altitude. These reserves are the most northern refuge for the Giant Pandas and therefore considered to be China’s most important ecological area as regard the Giant Panda [11]. Historically, areas in the Qinling Mountains were used for commercial logging, such as Taibai Forest Production Bureau (FPB), Changqing FPB, Longcaoping FPB [12]. Their logging continued until the conversion to Panda protected Nature Reserves taking place in 1998 by the law on Natural Forest Protection [13] and consequently tree logging was stopped. This long-term logging has nonetheless altered the forest quality of the Qinling Mountains.
This study reveals satellite derived summer vegetation activity for the whole Qinling Mountain Nature Reserve network and describes the environmental settings for three central Nature Reserves; namely Foping Nature Reserve (FNR), Guanyinshan Nature Reserve (GNR) and Changqing Nature Reserve (CNR) (Figure 1).

Foping Nature Reserve (FNR)
The FNR was established in 1978 to conserve the endangered Giant Panda and its habitat. It is located in the middle part of the southern slope of the Qinling Mountains (Figure 1). The FNR covers about 292 km2 and occupies the northern part of Foping County and its elevation ranges from about 980 to 2900 meters above sea level. Below 1500 m steep slopes and narrow valleys are common, between 1500 and 2000 m have more gentle slopes, wide valleys and flat mountain ridges, and above 2000 m slopes are again steep with wide mountain tops [14]. According to Ren et al. [14] the main natural vegetation types are deciduous broadleaf forests (below 2000 m), birch forests (2000-2500 m), conifer forests (above 2500 m), as well as shrub and meadow. There are two main bamboo species for pandas to feed on, i.e. Bashania fargesii, generally below 1900 m, and Fargesia qinlingensis in higher altitudes [14-18]. The FNR had 76 panda individuals according to the 3rd national survey in China [19].
Guanyinshan Nature Reserve (GNR)
The GNR is located east of the FNR (Figure 1) and belongs to Foping County. It was founded in 2002 and has an area of about 117 km2 and an elevation ranging from 1150 to 2274 m above sea level. The area is covered with three major forest types, which are conifer forest, mixed conifer-broadleaf forest, and deciduous broadleaf forest and mainly two kinds of bamboo species which are F. qinlingensis and F. dracocephala [13]. The GNR was previously an ideal site for giant pandas to inhabit, but according to locals the area lost its habitat mainly due to intensive human activities such as commercial logging and extensive farming. In the Second National Survey on Giant Pandas undertaken in the period of 1985-1988 [19], no pandas were registered here. In 1999 a Natural Forest Protection Programme started with the purpose of prohibiting exploitation of the forests in this area and three years later, in 2002, the GNR was founded with the aim to protect the forest and the Panda habitat [7]. This resulted in regeneration and restoration of the forests and subsequently, and the Third National Survey on Giant Pandas undertaken 1999-2003 showed numerous traces of activities from Pandas in the junction areas of the GNR and FNR. Within the GNR only eight panda individuals were registered in the 3rd national survey [19].
Changqing Nature Reserve (CNR)
The CNR is located in Yang County of the mid southern slopes of the Qinling Mountains and west of the FNR (Figure 1) and was founded as a Nature Reserve in 1995 covering an area of about 299 km2, and with elevations ranging from about 800 up to 3070 m. The CNR has an obvious vertical vegetation distribution with low-mountain deciduous broadleaf forest between 800 and 2000 m, middle-mountain mixed conifer and broadleaf forest from 2000 up to 2600 m, and high-mountain conifer forest above 2600 m [20]. This rich vegetation resource provides good habitats for wildlife and is one of the best and last remaining places for the Crested Ibis in the wild [20]. It has the same two bamboo species as the FNR and according to the 3rd national survey 52 panda individuals were registered [19].
Climatic conditions
The three nature reserves described above, i.e. FNR, GNR, and CNR, all share similar climatic conditions. Climatic data from the Foping County climate station show that the highest monthly average precipitation occurs in July (183 mm) and the lowest one in January (6 mm) (Figure 2). The maximum monthly average temperature occurs in July (about 22.2 °C) and the lowest one in January (about 0.7 °C). The average annual temperature and annual precipitation are 11.9 °C and 881 mm respectively.

Data and Methods
Satellite sensed data products provide means of objective monitoring of the Earth’s resources such as an ecosystem, and its biological production and phenology. Multi-spectral sensors onboard the satellites register reflected radiation (radiance) from the ecosystem in different wavelength regions (bands) of the electromagnetic spectrum and at different spatial ground resolutions. Data acquired by a sensor at high spatial resolution (1-20 m per pixel) contain information from smaller objects in the landscape compared to more coarse resolution data (500 m per pixel) that instead provide larger area coverage and often a higher frequency of acquisition. Satellite images acquired at different temporal dates thus provide a mean to study change through time. Essential pre-processing and calibration of the input snap-shot imageries are however required in order to make the images equally comparable, so a recorded change is tangible and not simply a difference in temporal phenology, atmospheric or viewing properties [21-22].
Runnström [21] points out that as regards studies of vegetation change the timing in the phenology is furthermore essential in order to measure actual change in vegetation properties. Estimating net primary production (NPP) from satellite data have become increasingly important as input in Climate models in order to strengthen the knowledge of terrestrial ecosystems as sinks of carbon dioxide in relation to global warming [22-24]. Satellite data sets have thus developed to meet requirements of long, high-frequency, consistent, and calibrated time series of satellite sensed products from which vegetation properties such as photosynthetic activity, net primary production etc. can be derived for different parts of the world and globally [25-28].
In this study a Normalized Difference Vegetation Index (NDVI) data product from the Global Inventory Modeling and Mapping Studies (GIMMS) is used, which is one of the longest existing data set of Earth monitoring sensed from satellite. The GIMMS NDVI data set is available as bi-monthly (15-day repetition) composites at 8-km spatial resolution with a global coverage from July 1981 to December 2006 [29-30]. The GIMMS NDVI composites originate from 1-km measurements by the Advanced Very High Resolution Radiometer (AVHRR) instrument onboard the National Oceanographic and Atmospheric Administration’s (NOAA) satellite series (number 7, 9, 11, 14, 16 and 17) and is re-sampled to 8-km pixel to obtain a long and consistent cloudfree data set. The NDVI is computed from the visible (red: 0.6-0.7 μm) and near infrared (nir: 0.8-1.3 μm) spectral bands and is the basis used for most vegetation indices [31] aiming to capture the fraction of Absorbed Photosynthetic Active Radiation (APAR).
A variety of vegetation indices have been constructed to monitor the production of the terrestrial biosphere [32]. Slopebased indices, e.g. the Normalized Difference Vegetation Index (NDVI), all have the major weakness of being sensitive to effects of the soil background [33]. Distance-based indices, e.g. the Soil Adjusted Vegetation Index (SAVI), are intended to minimize the effect of soil brightness when the vegetation is sparse and pixels contain a mixture of green vegetation and soil background, by including the slope and intercept of the soil line [34]. Pinty and Verstraete [35] designed the Global Environment Monitoring Index (GEMI), a non-linear vegetation index to specifically reduce atmospheric disturbance. However, no single index is optimal under all conditions as the reflectance is a mixture of vegetation, soil and shadows, and is further affected by the atmospheric path [36]. It has also been shown that the NDVI is the vegetation index that is the least affected by variation in topography [37]. The NDVI is calculated according to Equation (1):
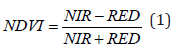
where NDVI is a unit less index in the range of -1 to +1 and is related to photosynthetic light uptake (near-linearity) and leaf area index (non-linearity) of green vegetation [38].
The GIMMS NDVI data set has been corrected for variations arising from calibration between satellite series, view geometry, volcanic aerosols, and other factors not related to actual vegetation change [30], and has been validated against calibrated MODIS (Moderate Resolution Imaging Spectro-radiometer) data that has been corrected for atmospheric perturbations [39].
In this study an annual NDVI mark of summer vegetation activity was calculated for each 8-km pixel by averaging the eight GIMMS NDVI images acquired during the summer season (i.e. bi-monthly from mid-May to mid-September). Through the 25 annual NDVI marks of summer season the intrinsic linear trend was calculated and mapped to visualize the development of vegetation activity inferred from NDVI in each pixel. Additionally inter-annual variability was studied. The NDVI trend line direction (β) was derived through equations (2-4):
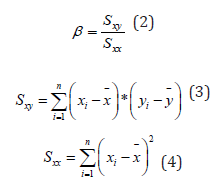
where x is time, year 1-25 (1982 – 2006) and y is each pixel’s summer averaged NDVI value for the corresponding x -year. To facilitate a closer monitoring of NDVI trends and variability within the three studied nature reserves, pixels were extracted through the time-series, averaged for each nature reserve to further study inter-annual variability and trends in separate graphs. It was furthermore considered valuable to analyze not only the longterm trend but also split the time series at the time when study area was assigned nature reserve in 1999 to compare the trend before and after as logging in the area was prohibited.
In order to evaluate the NDVI trends against climatic change, data was obtained from the Foping County climate station representing climatic conditions for the three nature reserves studied. The data include a 56-year time period of accumulated annual precipitation and average temperature from 1957-2012 that were analyzed to evaluate a long-term climatic behavior over the study area, as well as monthly values between 1982-2005 for studying the annual phenology pattern. The climatic data was further split to study trends for both the total 56-year time series and additionally for the corresponding satellite data time period, 1982-2006.
Results
The results show that large parts of the Qinling nature reserves have experienced slightly negative trends for summer season NDVI between 1982 and 2006 (Figure 3). The relationship between NDVI and APAR, and fractional vegetation cover indicate deteriorating conditions for forest stands in the nature reserves towards the end of the study period. The negative trends for most pixels are however slight and the negative trends are not statistically significant. They do however indicate a general decreasing trend.

NDVI values, averaged for each nature reserve all show negative trends as presented in (Figure 4) and according to the linear trends NDVI decline about 0.05 NDVI units on average for the 25-year period. Standard deviation is about 0.042 for the averaged series for all three Nature Reserves, and for single 8-km pixels the standard deviation range between 0.036 and 0.066. Breaking-up the time series before and after 1999, when the Nature Forest Protection Programme was initiated in the area does not reveal any change towards a positive trend direction of NDVI.
The long term climate record (1957-2012) reveals that annual precipitation is erratic with an average of 920 mm and a standard deviation of 186.6 mm (n=56) (Figure 5). The slope value for the linear trend is -0.80 mm which indicates that precipitation amounts would reduce by 45 mm over the period. The linear trend is much stronger however when the corresponding time period of the NOAA NDVI data series, i.e. 1982-2006, is analyzed separately. For these 25 years the average precipitation is 877 mm and the standard deviation is 175.2 mm (n=25). The slope value during this period is much higher (-8.43) thus indicating a reduction of annual precipitation with about 210 mm of the 25-year period, or about -25%. Noteworthy is also that 18 years of the 25-year period experienced below average precipitation and moreover, the three driest years of the full time climate series have occurred during this period, i.e. 1986, 1995, and 1997.


Annual average temperature for the long term climate record (1957-2012) is +11.9 °C with a standard deviation of 0.73 (n=56) (Figure 5). The trend shows increase in annual temperature since 1957 indicating about 1.5 °C warming over the past six decades. Consequently breaking out the 1982-2006 time-period the average and standard deviation is about the same (+12.0 and 0.81 respectively, n=25). However the slope of the trend line is considerably higher during this period (+0.1) indicating a major increase in annual temperature by about 2.5 °C having occurred during this 25-year period.
Discussion and conclusion
Vegetation activity inferred from remotely sensed data for the Qinling Mountain Nature Reserves
Climate change is likely to affect balances in many eco-systems worldwide and such changes have potential to severely affect humans as well as animal and plant species. The results from this study indicate that the photosynthetic activity inferred by NDVI in the Qinling Mountain Nature Reserves have decreased between 1982 and 2006. The negative trend is also supported by Liu and Jin [40] and Sun et al. [41-42] obtaining similar trends from analyzing different types of satellite data. Hence, Liu and Jin [40] demonstrate decreasing NDVI patterns through the interpretation of Landsat Thematic Mapper (TM) satellite images at 30 meter spatial resolution between1988 and 1997. Sun et al. [42] demonstrated that the area of decreasing NDVI accounted for 42% of the southern slopes of the Qinling Mountains based on SPOT-vegetation data at 20 meter spatial resolution between 1998 and 2007.
Long term relationship between vegetation and climate in the last Giant Panda haven
Decreasing NDVI-trends in the Nature Reserves on the southern slopes of the Qinling Mountains despite the present strong conservation efforts of the Giant Panda habitats is worrying. A first explanation is the commercial logging activities that occurred in the CNR during the 1971-1995 period and in the 1971-1998 period in the GNR. Commercial logging is often targeted at big and mature trees and recovery to reach equivalent photosynthetic activity and biological production could take decades. A second reason may be mushroom production which occurred widely in the Qinling Mountains until 1999 when the region was assigned Nature Reserve status. Mushroom production requires clearing of selected forest sites and preparing stems on the ground in which mushroom spores are planted (Figure 6) [43]. This human activity likely affected parts of the Qinling forests regarding density of trees and understory components but have probably affected the general forest activity much less than the commercial logging activities.

The third explanation and likely the most critical one to the declining NDVI values is the climatic change that seems to be occurring in this region. Declining precipitation amounts and increase in temperatures are both remarkable, and the combination of these two critical variables could severely stress an ecosystem and affect the biological production cause negative trends as seen in NDVI in this study. The results are also in accordance with other studies. Wang et al. [44] examined the response of NDVI to precipitation and temperature in Kansas, North America and could conclude that NDVI and precipitation are positively correlated while there is a negative correlation between NDVI and temperature. Keith et al. [45] also stress that temperate moist forests occur and produce the highest biomass where temperatures are cool and precipitation is moderately high. In another word, the clear change in these two key variables that have occurred is likely to be the main contribution to the discovered negative trends in NDVI in the Qinling Mountain Nature Reserves.
Although the decrease in NDVI is still not alarmingly great (about 10% decrease in 25 years), continuance of the precipitation and temperature trends might accelerate the impact on these temperate forests. As the Qinling Mountain Nature Reserves are hosting many endangered species, and especially the Giant Panda one gets anxious that the environmental conditions in this region is deteriorating and thus affecting the populations protected by the Nature Reserve legislation. Mixed conifer and broadleaf forests are preferable habitat for the Giant Pandas [3] and the understory of bamboo meets their rigorous demand of food. Climate change is likely to cause changes in the composition and structure of the forest [46] and panda populations could encounter lack of preferred foods. If the trend of increasing temperatures should continue the distribution of bamboo would extend northwards [47], and additionally higher temperatures would force pandas to migrate to even higher elevations in summer as the summer heat was assumed to be one of the reasons for the seasonal migration of the pandas [18]. The modeling results on impact of climate change on three dominant bamboo species in the Qinling Mountains showed a substantial reduction of bamboo growth in their distributional ranges [9]. Songer et al. [48] also modeled the climate change based on 9 climatic variables for the whole panda range to predict future panda habitat change until the year 2080 and showed that climate change can cause a shift in panda habitats towards higher elevation and higher latitudes reducing panda habitats by nearly 60~70%.
Decreasing NDVI trends as encountered in the Qinling Mountain Nature Reserves over the past two decades provide valuable insights that the short period of conservation efforts since 1998-1999 may not yet have resulted in increasing growth of the forest and may not be sufficient. Climatic change of increasing temperatures in combination with lower amounts of precipitation could have much more extensive negative impact on the vegetation within the Nature Reserves than the human conservation activities can compensate for. It is therefore critical to continue monitoring both climate and vegetation growth in these regions. Additionally longer time series of satellite sensed data products need to be constructed as well as methods to improve calibration between satellite sensors and to compensate for differences in atmospheric perturbations. Important ecosystems, even vast regions may then be monitored to perceive how endangered species such as the Giant Panda, are managing climate change.
Acknowledgements
This study was initiated through an Erasmus Mundus Action program of staff mobility. It was also partially supported by NSFC project (41271194) and also project of State Key Joint Laboratory of Environment Simulation and Pollution Control, China (No. EZ4485079CN). Additionally we would like to acknowledge the NASA GIMMS team and the Global Land Cover Facility (GLCF) for making the satellite data time series easily available.


