


Study of the Atomic Packing Fraction, Specific Surface Area and Morphology Index of Pure Titanium Dioxide Compound and Doped with Lead TiO2: Pb in Different Ratios
Ahmad Khoudro, Shaza Sater* and Duored Suliman*
Department of Physics, Tishreen University, Syria
Submitted: January 17, 2024; Published: March 12, 2024
*Corresponding author: Shaza Sater and Duored Suliman, Department of Physics, Tishreen University, Syria
How to cite this article: Ahmad Khoudro, Shaza Sater* and Duored Suliman*. Study of the Atomic Packing Fraction, Specific Surface Area and Morphology Index of Pure Titanium Dioxide Compound and Doped with Lead TiO2: Pb in Different Ratios. JOJ Material Sci. 2024; 8(3): 555740. DOI:10.19080/JOJMS.2024.08.555740
Abstract
In this research, additional physical parameters were calculated for previous parameters that were set for samples of pure titanium oxide compound doped with lead in different proportions according to (x = 0.2 - 0.5 - 0.7 - 0.9 g) in its three phases (anatase, brookite and rutile) by making use of X-ray diffraction diagrams. XRD, where the computational results of the atomic packing fraction PF, the morphology index MI, and the specific surface area S showed the structural changes that occur to the pure powder as a result of doping it with different proportions of lead, so we have shown from the range to which the morphology index values belong that the compound belongs to pure titanium dioxide, and The values of the morphology index varied according to the different phases and the different doping ratios, and rutile had the largest value of MI at 0.2g Pd doping, and when calculating the specific surface area, the anatase phase appeared with the largest surface area compared to the other two phases at 0.7g Pd doping, then we explained the changes of the morphology index varies by parametric both the crystal size D on the one hand and the specific surface area S on the other hand. We also explained and explained the changes that appeared on the values of the atomic packing fraction of the compound after doping It with lead ratios.
Keywords: Powder; Morphology index; Titanium dioxide TiO2; Doping; Lead Pb; Structural properties; Specific surface area; Physical properties; Atomic packing fraction
Introduction
The importance of our research comes from the importance of both the powders and the compound used, as the powders have a greater photocatalytic activity than the thin films of titanium dioxide, as well as the use of TiO2 compound in many and wide applications, as titanium dioxide is a semiconductor used in photocatalysis [1] and in photovoltaic systems and dye-sensitive photocells [2,3], it has a large band gap Eb = 3.2 eV that makes this catalyst effective only in the ultraviolet region. These doping processes are: TiO2:SiO2 [4], TiO2: N [5], TiO2: MgO [6], TiO2: PbO [7,8], TiO2: Pb [2,3,5,9-11]. TiO2 also has a refractive index. It is high, which increases with increasing annealing temperature [12]. This compound also enjoys thermal and chemical stability, non-toxicity [13], its wide applications in optics and electronics [1-6,10,11,14-22], its biological and chemical inertness, and its mechanical strength [23]. The titanium dioxide compound is characterized by three crystalline phases: anatase and rutile (tetragonal crystal system) and brookite (orthorhombic crystal system) as shown in Figure 1.
In this research, we calculated the atomic packing fraction P F, the morphology index MI, and the specific surface area S (m2/g) of titanium dioxide compound doped with lead in different proportions, which we studied many of its physical properties previously using the X-ray diffraction device (XRD), where the diffraction charts enabled us For pure and lead-doped samples by calculating several physical values, including the values of crystal size D, cell size V, theoretical density ρ(X-ray) and full width at half maximum intensity (FWHM), which we will use in this research to identify new values. New physical properties in order to enrich the investment of this compound in wider areas [24].

Experimental Method
The process of preparing samples was carried out in the Faculty of Science at Tishreen University in the laboratories of the Departments of Physics and Chemistry. Pure and lead-doped TiO2 powders in the proportions (x = 0.2 – 0.5 – 0.7 – 0.9 g) Ti(1-x) Pbx O2 that we deal with in this research were previously weighed by a sensitive balance type (SARTORIUS) with an accuracy of gr (10- 4). Which were manufactured by a solid-state interaction method [21] and [22] and were mixed and grinded well for two hours to become powders using an agate mortar and pestle, very fine, then sifted using a sieve. It has a hole size of 90 micron. Then, all samples were heated up to 200 °C by means of an incinerator.
Results and Calculation
Based on the values of crystal size D, cell size V, theoretical density ρ(X-ray) and full width at half maximum intensity (FWHM) obtained from the reference study of the XRD plots [24] we were able to calculate the changes that occur To compact the atoms in the compound cell after we doped it with different dopant ratios, we calculated the packing fraction, or the so-called filling fraction, using the relationship (10) [25], which is equal to the ratio of the size of the atoms in the cell to The size of that cell:
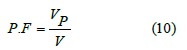
P.F: atomic packing fraction
VP: the size of the atoms present, which is equal to the number of oxygen atoms with the size of one atom n1V1 + the number of titanium atoms with the size of one atom n2V2.
V: the cell size taken as (nm)3.
Considering the volume of an atom equals the volume of a sphere:
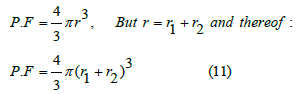
Where Z: the number of atoms per unit cell, which is equal to 2 in the rutile phase, 8 in the brookite phase, and 4 in the anatase phase.
r1 and r2: the radius of the titanium atoms, Ti and O, respectively (Table 1).
Thus, the empty part of the titanium dioxide lattice appears according to Table 2.
We notice that in contrast to the increase in the cell size, the compaction coefficient decreased with the increase in the percentage of doping. It is clear that from the equation (10) that there is an inverse proportion between the cell size and the atomic packing fraction, while the latter is directly proportional to the size of the atoms in the compound, which differed according to the phase due to the difference in the number of atoms in the compound. Z unit cell between the three resulting phases. The highest value of the compaction coefficient was for the rutile phase PF = 0.0596, whose value was constant for all doped samples, due to the stability of the cell size of the doped samples in the rutile phase, where the crystal lattice constants of the rutile phase maintained their values by changing the doping ratios. As for the sample taken in phases together, the largest value of the packing fraction was for the sample with the highest doping ratio 0.9g, but the cell size was the highest value and also the theoretical density had the lowest value at that value, which amounted to 4.069 g / cm3 among the samples and The reason for this is only the significant decrease in density for the two phases of anatase and brookite, which was greater for the stage of brookite in particular, and this corresponds to the increase in cell size for each of the previous two phases, knowing that the phase of brookite is the most present in the recombinant compound in this research (Figure 2).


We note that the curves are closer by 99% to the curves that we obtained when drawing the theoretical density changes according to the dopant ratio, and this indicates the existence of a link between the density and the packing fraction, as it increases with the increase in density, and the increase in this fraction may indicate that the crystalline lattice of the samples has a preference In the presence of repetition of the same crystal lattice (symmetry) with glide planes and screw axes that affect the cavities adjacent to it by installing bumps in the single molecular surface [15], where the lowest value of the packing fraction was 0.9 g, and the phase was the anatase phase, while the highest The value of the packing fraction was for the rutile phase, in which all doping ratios are equal. The packing fraction is evaluated, and the increase in the packing fraction results in an increase in shear stress and an increase in optical conductivity. From the figure, the PF maintains a constant value for all pure samples. And the similarity to decrease when the doping ratio is 0.9 g, due to the increase in cell size and the decrease in the theoretical density. We can say that PF values fall within the range [0.0540-0.0550] for the anatase phase, within the range [0.0595-0.0596] for the rutile phase, within the range for the brookite phase [0.0558-0.0564] and within the range for the whole compound [0.0565-0.0570]. The sample with an impurity ratio of 0.9g was the most different from the pure sample in terms of the values of the PF.
Then we calculated the specific surface area S of pure and doped titanium dioxide powders for spherical granules using equation (11), as both equations (10) and (11) give us the same values for the specific surface area [15] and [16], respectively:
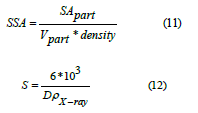
S: the specific surface area is m2/g.
Vpart: particle size in nm3.
SApart: surface area in nm2.
D: crystal size unit nm.
ρ(X-ray): The theoretical density of the X-ray diffraction spectrum for powders is g/cm3 (Table 3).

All samples are similar in the appearance of the graph in terms of increasing and decreasing the specific surface area at different dopant ratios, except for the anatase sample between the pure compound and the dopant with a ratio of 0.2 g. The graph shifts between them from decrease to increase (Figure 3). We note that the surface-to-volume ratio decreases with the increase in grain size [14], meaning that the specific surface area decreases with increasing doping ratios, except for the percentage of lead doping that is equal to 0.7 g, at which the specific surface area increased due to the decrease in the grain size at this ratio only after its increase in the rest. Lead doping ratios, as the study of the specific surface area allows us to identify the possibility of adsorption and nonhomogeneous stimulation and the ability of the molecule to move and navigate on the surface and understand the interactions that occur on the surface or at the interface as the adsorption increases with the increase of the specific surface area and thus increases In homogeneous stimulation, among the surfaces of titanium dioxide compounds, it was found that the doping ratio is 0.7 g. The surface of the compound is active in the adsorption process due to its privilege of not saturating its atoms electronically despite the bonds formed by the atoms of this surface with neighboring atoms [18]. The values obtained are consistent with the researcher [19]. The specific surface area for both phases also fell within the range [47842.78 - 18191.06 m2/g], The anatase phase also had the highest value of the specific surface area compared to the other two phases, which amounted to S = 71061.38 m2/g because the size of its grains was the smallest for the inclusion ratio of g 0.7. S = 12948.71 m2/g, but the predominant phase of the compound, which is the brookite phase, has decreased the values of the specific surface area, giving us as a result a decrease in the values of the latter for the compound for all phases.


Since the morphology index MI is related to both the particle size D and the specific surface area S, we calculated the MI for pure and lead-doped titanium dioxide powders using the equation (12) [20]:
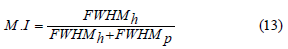
M.I: morphology index.
FWHMh: The highest value of the full width at half the intensity (FWHM) measured in radians (rad).
FWHMp: Full width values at half maximum intensity (FWHM) measured in radians (rad) (Table 4).
The range of MI for pure TiO2 powder ranges within the range [0.500-0.800]. As for TiO2 powder doped with lead, it belongs to the range [0.400-0.931], we notice that the range expands between the lowest and largest index values compared to the pure sample, and the rutile phase has the highest value of the morphology index. MI = 0.931 at 0.2 g lead impurity, followed by the value that we obtained in the sample impregnated with lead by 0.9 g to reach MI = 0.910. With an increase in lead impurity, there was a clear decrease in the width of the peaks, which was followed by an increase in the morphology index.
We note from Figures 4 & 5 that the average morphology index
is directly proportional to the average crystal size of the phases
together  which falls within the range [57.379-85.370 nm] and
inversely proportional to the specific surface area S which falls
within the range [47842.78 - 18191.06 m2/g] In this order, this
agrees with the researcher [20]. The increase in the morphology
index is due to the increase in the grain size due to the effect of
lead impregnation, which caused the increase in the denominator
of the relationship (13), which expresses the morphology index.
which falls within the range [57.379-85.370 nm] and
inversely proportional to the specific surface area S which falls
within the range [47842.78 - 18191.06 m2/g] In this order, this
agrees with the researcher [20]. The increase in the morphology
index is due to the increase in the grain size due to the effect of
lead impregnation, which caused the increase in the denominator
of the relationship (13), which expresses the morphology index.
Conclusion
In this research, we completed the study of some physical properties of titanium dioxide compound doped with lead in different proportions, after studying the X-ray diffraction (XRD) patterns of anatase and rutile with a quadruple crystal system and brookite with a rhombic crystal system based in the compound in order to know the changes that occur in this compound and to increase Investing it in new and wide fields and applications, we have studied the atomic compaction coefficient, morphology index and specific surface area for each phase of the pure titanium dioxide compound doped with lead in different proportions, and we also took measurements for the phases together. The morphology index, which falls within the range [0.500-0.800], confirmed that the compound belongs to pure titanium dioxide, and the morphology index for the doped samples fell within the range [0.400-0.931], and its highest value belonged to the rutile phase at the ratio of 0.2g, as it occurred. The specific surface area of the compound is within the range [47842.78 - 18191.06 m2/g], and the anatase phase had the highest value of the specific surface area compared to the other two phases, which amounted to S = 71061.38 m2/g. As for the atomic compaction ratio taken for the phases together, it fell within the range [0.0565- 0.0570]. The results were identical with many researchers.
References
- Yu J, Yu JC, Cheng B, Zhao X (2002) Photocatalytic Activity and Characterization of the Sol-Gel Derived Pb-Doped TiO2 Thin Films. Journal of Sol-Gel Science and Technology 24: 39-48.
- Asahi R, Morikawa T, Ohwaki T, Aoki K, Taga Y (2001) Visible-Light Photocatalysis in Nitrogen-Doped Titanium Oxides. Science 293(5528): 269-271.
- Yu J, Zhao X, Zhao Q (2001) Photocatalytic activity of nanometer TiO2 thin films prepared by the sol–gel method. J Mater Chem Phys 69(1-3): 25-29.
- Hu C, Tang YC, Yu JC, Wong PK (2003) Photocatalytic degradation of cationic blue X-GRL adsorbed on TiO2/SiO2 J Photocatal Appl Catal B Environ 40(2): 131-140.
- Hara K, Hariguchi T, Kinoshita T, Sayama K, Arakawa H (2001) Influence of electrolytes on the photovoltaic performance of organic dye-sensitized nanocrystalline TiO2 solar cells J Sol Energy Mater 70(2): 151-161.
- Bandara J, Hadapangoda CC, Jayasekera WG (2004) Jayasekera WG TiO2/MgO composite photocatalyst: the role of MgO in photoinduced charge carrier separation. J Appl Catal B Environ 50(2): 83-88.
- Daniele S, Papiernik R, Hubert PLG, Jagner S, Hikansson M (1995) Single-Source Precursors of Lead Titanate: Synthesis, Molecular Structure and Reactivity of Pb2Ti2(.mu.4-O)(.mu.3-O-i-Pr)2(.mu.-O-i-Pr)4(O-i-Pr)4. Inorg Chem 34: 628-632.
- Hubert PLG, Daniele S, Papiernik R, Massiani MC, Septe B (1997) Solution routes to lead titanate: synthesis, molecular structure and reactivity of the Pb–Ti and Pb–Zr species formed between various lead oxide precursors and titanium or zirconium alkoxides. Molecular structure of Pb2Ti2(µ4 -O) (OAc)2(OPri)8 and of PbZr3(µ4-O) (OAc)2(OPri)10. J Mater Chem 7(5): 753-762.
- Cheng SD, Kam CH, Zhou Y, Que WX, Lam YL, et al. (2000) Sol–gel derived nanocrystalline thin films of PbTiO3 on glass substrate. Thin Solid Films 375(1-2): 109-113.
- Fujishima A, Rao TN, Tryk DA (2000) Titanium dioxide photocatalysis. Journal of Photochemistry and Photobiology C: Photochemistry Reviews 1(1): 1-21.
- Zeng X, Liu Y, Wang X, Yin W, Wang L, et al. (2002) Preparation of nanocrystalline PbTiO3 by accelerated sol–gel process Materials Chemistry and Physics 77(1): 209-214.
- Krishna KM, Rahman MM, Miki T, Soga T, Igarashi K, et al. (1997) Optical properties of Pb doped TiO2 nanocrystalline thin films: A photoluminescence spectroscopic study. Applied Surface Science 113-114: 149-154.
- Eliana P, Vittorio L, Torres MF, Sham E (2015) Nitrogen doped TiO2 photoactive in visible light. Revista 11624: 561-570.
- Chen J, Yaling Li, Wang Y, Yun J, Cao D (2004) Preparation and characterization of zinc sulfide nanoparticles under high-gravity environment. Mat Res Bull 39(2): 185-194.
- Rutherford JS (2005) Vander Waals Bonding and Inert Gases. Encyclopedia of Condensed Matter Physics.
- Jiji A, Joseph N, Donald RB, Daniel M, Amit S, et al. (2006) Size-Dependent Specific Surface Area of Nanoporous Film Assembled by Core-Shell Iron Nanoclusters. J Nanomater 54961: 1-4.
- Yong PJ, Yun JL, Ki WJ, Jin OB, Dae JY (2006) Chemical Synthesis and Characterization of Highly Oil Dispersed MgO Nanoparticles. J Ind Eng Chem 12(6): 882-887.
- Zhang J, Xiao X, Nan J (2010) Hydrothermal–hydrolysis synthesis and photocatalytic properties of nano TiO2 with an adjustable crystalline size. J Hazardous Mat 176(1-3): 617-622.
- Damien D, Belharouak I, Amine K (2010) Tailored Preparation Methods of TiO2 Anatase, Rutile, Brookite: Mechanism of Formation and Electrochemical Properties. American Chemical Society 22(3): 1173-1179.
- Theivasanthi T, Alagar M (2011) An Insight Analysis of Nano sized powder of Jackfruit Seed. Nano Biomed Eng 3(3): 163-168.
- Thirugnanasambandan T (2012) Titanium dioxide (TiO2) Nanoparticles - XRD Analyses - An Insight.
- Primo A, García H (2013) Solar Photocatalysis for Environment Remediation. In: Suib SL, New and Future Developments in Catalysis, chapter 6, Amsterdam, Elsevier, USA.
- Mehdizadeh P, Tavangar Z, Shabani N, Hamadanian M (2020) Visible Light Activity of Nitrogen-Doped TiO2 by Sol-Gel Method Using Various Nitrogen Sources. J Nanostruct 10(2): 307-316.
- Sater S, Khoudro A, Dalla A (2023) Studing Some of Physical Properties OF a Lead Doping Titanium Dioxide TiO2: Pb with Different Ratios. Physical Science & Biophysics Journal 7(1).
- Patiño WFO, Estrada N (2020) Densest arrangement of frictionless polydisperse sphere packings with a power‑law grain size distribution. Granular Matter, Verlag GmbH Germany, part of Springer Nature.


