


Optical and Photoluminescence (PL) Properties of Sm3+ Doped Tellurite Glasses as a Laser Material
R El-Mallawany1*, Samir A Yousef1, A El-Shaer2, S Marzouk3 and Hanan A Elabd1
1Department of Physics, Menoufia University, Egypt
2Department of Physics, Kafreelshikh University, Egypt
3Arab Academy for Science, Technology and Maritime Transport, Egypt
Submitted: February 05, 2024; Published: February 20, 2024
*Corresponding author: R El-Mallawany, Department of Physics, Menoufia University, Egypt
How to cite this article: R El-Mallawany, Samir A Yousef, A El-Shaer, S Marzouk, Hanan A E. Optical and Photoluminescence (PL) Properties of Sm3+ Doped Tellurite Glasses as a Laser Material. JOJ Material Sci. 2024; 8(3): 555739. DOI:10.19080/JOJMS.2024.08.555739
Abstract
Ultraviolet–visible spectra were measured (400–3000 nm) for the new glass system in the form of 80 (TeO2) - (20-x) (WO3) - x (Sm2O3), x = 0, 1, 2, 3, 4 and 5 mol% have been measured. The optical energy band gaps via Tauc's model and absorbance spectrum fitting (ASF) according to the absorption spectra fitting (ASF) method, refractive index (n), molar refraction (Rm), electronic polarizability (αm), reflection loss (RL), dielectric constant (ε) and optical electronegativity (χ*) were also calculated. The optical band gap values rose while the refractive index values dropped with increasing concentrations of dopant Sm3+. The photoluminescence spectra recorded under 325 nm excitation exhibited the emission bands at 563 nm, 599 nm, and 647 nm assigned to the transition of , 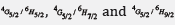 ;respectively. Additionally, the oscillator strength type transition probabilities, Smeas, Scal, and the parameters of Judd–Ofelt Ω2, Ω4, Ω6 have been calculated. The branching ratio, βR, spectroscopic quality factors, χ, and radiative lifetimes, τR, of number of excited states of Sm3+ were also determined. The probability of an absorption or emission process was determined using the absorption, emission cross-sections, and gain cross-section. These glasses doped with Sm3+ ions will be a good option and an excellent choice for optical applications, according to the spectroscopic characteristics.
Keywords: Glasses; Tellurite; Rare earth; Optical Properties; Photoluminescence (PL) properties
Introduction
The majority of optical technologies need a wide variety of material properties to be used effectively and efficiently in the application of interest. Due to some properties such as accessibility, corrosion resistance, ease of production, optical transparency as well as, and thermal and mechanical stability, silica glasses have traditionally been taken into consideration [1].
Why it is important to study tellurite glasses?
Because tellurite glasses are a new kind of glass with unique physical properties and sophisticated applications.
Why doping tellurite glasses by Rare Earth (RE)?
To get new optical characteristics of tellurite glasses.
Now, tellurite glasses are used in optical technologies such as optical transmission technology, and lasing material production, and this is due to their interesting properties rather than other glasses [2-19]. TeO2 is combined with other modifying oxides and glass-forming to enhance their performance in terms of physical properties. Also, it has been reported that in view of the rising global demand for energy and the climate effects associated, borosilicate and tellurites as cover glasses in Si photovoltaics and their performances under sunlight [16]. Moreover, sophisticated applications and thulium-doped fluorotellurite glass fibers have been reported [5,7]. The Sm3+ ion's luminescence properties in glass materials, including the transition probabilities, cross-sections of the emission, branching ratios βR, radiative lifetimes τR, and the widths of the line for the excited states, must be carefully studied. This information is necessary for the construction of optical devices including light-emitting diodes (LEDs), fiber amplifiers, and color displays.
The capability of storage of high energy, high gain as well and low optical losses are other significant features needed for a laser medium, in addition, to the cross-section of the stimulated emission, lifetime of the fluorescence, and optical efficiency [20-24]. By using Judd–Ofelt theory [25,26], the intensity factors, Ωt, (t=2, 4, 6), radiative branching ratios (βR), spontaneous transition probabilities (AR), and radiative lifetimes (τR) can be estimated.
The motivation for this work was:
Part 1: Synthesis of new tellurite glass system in the form of 80 (TeO2) - (20-x) (WO3) - x (Sm2O3), x = 0, 1, 2, 3, 4 and 5 mol%. XRD measurement has been used to check the amorphous state. Both density and molar volume have been measured [27].
Part 2: Ultraviolet–visible spectra will be measured (400–3000 nm) for the new glass system. The optical energy band gaps via Tauc's model and absorbance spectrum fitting (ASF) according to the absorption spectra fitting (ASF) method will be calculated. The photoluminescence spectra recorded under 325nm excitation exhibited the emission bands at 563 nm, 599 nm, and 647 nm will be measured. Additionally, the oscillator strength type transition probabilities, Smeas, Scal, and the parameters of Judd–Ofelt Ω2, Ω4, Ω6 will be calculated. The novelty of the present work is in the choice of the compositional oxides selected to suit their application in optical applications.
Experimental Work
The absorption spectra of the Tungsten Tellurite glass samples doped with Sm2O3 were examined in the wavelength range of 400 to 3000 nm by using a double beam spectrophotometer Cary 5000 UV–Vis-NIR. The luminescence spectra for the titled glass system have been recorded by using a simple photoluminescence (PL) system (He-Cd laser, CW, 325 nm, Max. 200 mW, KIMNON KOHA CO., LTD., JAPAN).
Results and Discussion
Optical Absorption Analysis
Table 1 [27] collected density and molar volume values for 80 (TeO2) - (20-x) (WO3) - x (Sm2O3), x = 0, 1, 2, 3, 4 and 5 mol%. Density was in the range (6.0296 - 6.1201) g/ cm3 m while molar volume was (29.05 - 29.39) cm3. Figure 1 displays the absorption spectra (400 nm-3000 nm) of the multi-component tellurite glasses with Sm3+ ions that were prepared. Several peaks have been found, and they are ascribed to transitions between the energy states of Sm3+ ions. In the Near Infrared Region, the absorption bands are centered at the wavelengths of 950, 1094, 1253, 1402, 1505, 1536, 1563, 1983, and 2759 nm. These bands associated with the electronic transitions in Sm3+ ions from  respectively [28]. The strongest absorption peaks were attributed to the
 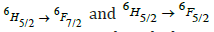 transitions respectively at 1253 and 1402 nm wavelength depending on the glass host environment surrounding the Rare Earth ion [29]. There were shoulder peaks on several of the major absorption peaks. The Stark effect has caused the manifold at which this occurs to be divided into numerous states of somewhat differing energy. All the glass samples have comparable absorption peaks in terms of position and shape; however, the intensity of these peaks increases linearly as the Sm3+ ion concentration increases. This nature means that there was no cluster formation around the Sm3+ ions in the glass matrix. The prior data are fairly consistent with earlier samarium oxide reports [30-32].


Band Gap Energy Eopt
Figure 2 shows the absorption spectra (400nm - 600nm) of the undertaken multi-component tellurite glasses incorporating Sm2O3. Tauc's model, the optical absorption coefficient α(ν) was calculated via Eq. (1) [33-36]:
In the above equation, A and d are signifiers of the absorbance in arbitrary units and the sample thickness in cm, respectively. Eq. (1) has been modified by Mott and Davis Eq. (4) according to this theory, the absorption coefficient
where B= band tailing, hν = the energy of the incident photon energy, and Eg = energy of the optical band gap. The power n refers to the nature of electronic transition during absorption [21-23]. Figure 3 displays the change of (αhν)2 that was measured by (cm−1 eV)2 with photon energy (E = hν) (eV) for direct allowable transition for the prepared glass system (TWSm). The Eg values for the studied glass samples (TWSm) were found in the range from (2.88 eV to 2.98) eV, listed in Table 1. The optical band gaps for the indirect allowed transition are evaluated by plotting hν as a function of (αhν)1/2 for all the Sm3+ doped TW glass samples, shown in figure 4. The values of Eopt were found in the range of 2.75 eV to 2.83 eV listed also in table 1 for TWSm samples. As the concentration of the dopant (Sm3+) rose, the band gap values tended to increase. This could be due to the creation of non-bringing Oxygen atoms (NBOs). (NBOs) could lower the valence band minimum, thus leading to the increase of direct band gap value. The number of (NBOs) increases due to the modifiers. The  values for indirect allowable transition for (TWSm) glass samples were (2.75 to 2.81) (eV), listed in table 1. It was found that the
  values were in agreement with those obtained by Tauc's method [35].


Recently, the EGap was calculated by using absorbance spectrum fitting (ASF) [32-34]. The absorption coefficient α(ν) can be expressed by the next equation as:
The cut-off wavelength which is related to the optical gap represented by λcut, c = the velocity of light, and h = Planck’s constant. The above Eq. will be as:
where .  in a model of ASF can be calculated directly from λcut by using Eq. (5):
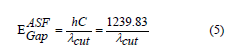
Figure 5 shows the changing of (A/λ)2 with (λ)-1 (nm−1) for direct transition for the studied glass system. By extrapolating the linear part of these plots at the values of (A/λ)2 = 0, the value λcut for each plot was obtained. Substituting the values of λcut in Eq. (6), the corresponding  will be calculated. The optical band gap values
  for the direct allowed transition were found in the range from (2.89 eV to 2.99) eV for the TWSm glass samples, listed in table 1. Figure 6 depicts the variation of (A/λ)0.5 with (λ)-1 measured in (nm−1) for indirect allowable transition for the glass system. The values of
  for indirect transition were estimated by extrapolating the straight region of the graphs which passed through nearly all of the points at the values where (A/λ)0.5 = 0. These values were then substituted in Eq. (5). The
  values for indirect allowable transition were found in the range from (2.75 to 2.81) eV, listed in table 1. It was found that the
  values were in agreement with those obtained by Tauc’s method. In addition, the values of the energy band gap for the indirect case were lower than those in the direct case.

The calculated refractive index (n) was determined using the next equation [37]:
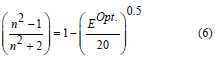
(n) of the 80 TeO2 - (20-x) WO3- x (Sm2O3) were inverse with the values Eopt and their behavior was shown in figure 7 and their values were listed in table 1. This decrease is not only due to the addition of less polarizable Sm3+ but could be also due to the conversion of TeO4 to the less polarizable TeO3 structural unit [38]. Molar refraction (Rm) and Molar polarizability (αm) were obtained as follows [39-41]:
Figure 8 displays the behavior of Rmolar & αmolar with Sm2O3 mol%. Table 4 collected values of Rm. The increment in both (Rm) and (αm) are enhanced by doping Sm3+ into tellurite glass. Moreover, the reflectivity, RL, optical transmission T, and metallization factor M will be calculated by the next equations [42-44]:
Rm = molar refraction and Vm = molar volume.
The behavior of T and RL are in opposite trends with increasing dopant mol% content as shown in figure 9 and their values are tabulated in table 2. Metallization criterion (M) is in which indicates that the prepared glasses are good nonlinear optical materials.


The static dielectric constant, ε will be calculated [45]:
Values in table 2 showed that the ε is directly proportional to the calculated refractive index of the prepared glasses. The optical electronegativity χ* may be estimated by using the next relation [46]:
The linear dielectric/dielectric susceptibility χ(1) of the glass system can be calculated by the next equation [46,47]:


The behavior of χ* and χ(1) with Sm2O3 mol% content in the proposed glasses is presented in figure 10. The value of χ* takes high values from 0.739 to 0.761, whereas χ(1) drops from 0.405 to 0.396 as Sm2O3 concentration increases from 1 to 5 mol%. as shown in table 2. The changes in the structure of glasses illustrate the behavior of the χ* and χ(1) with the addition of Sm3+ [48,49].

Luminescence spectra
The photoluminescence (PL) spectra of Sm3+ doped TW glasses were monitored within the wavelength range 550–700 nm under an excitation of 325-nm wavelength He-Cd laser, and displayed in figure 11. Three main emission bands that centered at 563 nm, 599 nm, and 647 nm were observed in the emission spectra figure. The emission peaks were indicated to the transition of  respectively. TWSm glasses emission spectra manifest that the
  transition is more intense, while &
 are moderately intense. It is feasible to expect colors of yellow, green, intense orange, and weak red color from these emission bands. In nature, these transitions are classified as magnetic and electric dipoles. Based on the literature, the selection rule
  indicated the electric and magnetic dipole in nature while the transitions
  are purely electric dipole in nature [50].

Oscillator Strengths and Judd-Ofelt Parameters
The Judd-Ofelt (JO) theory is frequently used to predict the probability of laser action and optical amplification [51], by analyzing the forced electric dipole transitions in the 4fn configuration of RE ions in various isotropic lattices (crystalline and amorphous). The next formula is used to calculate the measured line strengths, , of the absorption band: [25, 26].
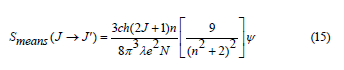
where J and J` stand for the total angular momentum of the initial and final levels, respectively, N is the concentration of Sm3+ ion, n is the refractive index, c and h have their usual meaning, λ stands for the mean wavelength of the certain absorption band and ψ = ∫α (λ )dλ indicates the integration of the absorption coefficient as a function of λ. The local field correction that’s associated with the ion in the dielectric host medium [52] is represented by the factor [9/ (n2+2)2] in Eq. (15). The Judd-Ofelt parameters Ω2, Ω4, and Ω6 that are related to the corresponding transitions between J and J` manifolds were then determined using the measured line strengths in the following form: [25,26]

where the matrix elements  are determined in the intermediate coupling approach, and aren’t dependent on the crystal host. They are doubly minimized rank unit tensor operators, λ. The crystal-field parameters, interconfigurationally radial integrals, and the interaction between the core ion and the intermediate environment are all included in the Judd-Ofelt parameters Ω2, Ω4, and Ω6, which illustrate how the host affects the transition probabilities. The measured absorption line strengths values, Smeas are summarized in table 3. The three JO parameters for Sm3+ in (TW) host material are given the following values by the least squares fitting of Smeas to Scalc. The values of U(λ) that were tabulated by Carnall et al. [53] were used for calculating the values of JO intensity parameters Ω(λ) because they are almost host-independent. In general, JO parameters may be affected by both the fit transition as well as the accuracy of the absorption measurements. J–O parameters Ωλ for the prepared glasses were shown in figure 12 and their values were summarized in table 3. From the observation in the table, the present glass system showed the intensity factors for J-O in the trend of Ω4 > Ω6 > Ω2 [54-58], like some other glass matrices as well which is a confirmation that the glasses show ionic nature, which has a strong and rigid network between Sm-O ions. Ω2 illustrates how the covalency between the rare earth ion and ligand anions is dependent. The decrease of Ω2 indicates the increase in the symmetrical degree around Sm3 ion site. When the ion site is more centro-symmetrical and its chemical bond is more ionic with ligands, the values of Ω2 become weaker. While Ω4 and Ω6 denote the viscosity of the glass matrix and dielectric of the media. They are corresponding to the host medium rigidity where the ions are located in the matrix. Moreover, they are influenced by the vibronic transitions of the RE ions bound to the ligand atoms [59,60]. This would also imply the formation of NBO, which is a reflection of the deformation of TeO4 tbp structural unit to TeO3+1 polyhedral or TeO3 tp structural unit. Compared to other glass samples, TWSm1 and TWSm3 have the highest values of Ω2 which is an indication that the Sm3 ions sites they occupy were more asymmetric in nature and the chemical bond between Sm3 ions and ligand ion is the most covalent. The quality of the prepared glasses is characterized by using the spectroscopic quality factor formula χ=Ω4/Ω6 [61,62]. The Ω4/Ω6 values were in the range of 2.57 × 10⁻²⁰ cm2 to 2.70 ×10⁻²⁰ cm2. The higher value of the spectroscopic quality factor (χ) is an indication that the glass material is appropriate for lasing media.


The spectroscopic quality parameter is greater than 1 for all the prepared samples, affirming the largest stability and fitting for the production of the photonic devices. Their values are collected in table 3. To assess the fitting quality between the calculated and the experimental oscillator strengths, the root mean square was determined using the relation [63,64]. Root-mean-square deviation (R. M. S.) is a measure of the fit quality and can be calculated as follows:
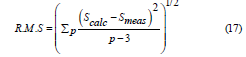
where, p, indicates the number of transitions that are observed on the absorption spectra that have been detected. R. M. S. values affirm the fitting quality as shown in table 3.
Radiative Properties
Branching Ratio βr and Radiative Lifetime τ
Radiative properties such as transition probability A, emission cross-section  , bandwidth
  , branching ratio βr, and radiative lifetime τ are evaluated by using both calculated refractive index n and JO parameters [65]. The branching ratio, a crucial factor in the design of the laser system and can be used to predict the radiative intensities of emission lines created from an excited level describes the probability of the stimulated emission for a certain transition [65,66]. Branching ratio βr is obtained from the next equation [67],
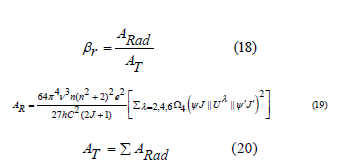
in which, AT stands for the overall probability of all transitions and the spontaneous emission possibility related to the transition of an electric dipole between the excited and the lower state denoted by ARad. The lasing efficiency of an emission transition is characterized by the luminescence branching ratios. The branching ratio for the potential laser transition is in the order of 0.50. The relative area under the emission bands was used to evaluate the branching ratios that are obtained experimentally (βexp). The experimental results obtained in the present glass system show that the  transitions for all samples have higher branching ratios than the other transitions and all their values are (≥0.5), which is essential for the design of the laser system. The radiative lifetime can be evaluated from the following equation
  [67]. This lifetime is dependent on the total probability of a spontaneous transition. The results for the branching ratio βr and the radiative lifetime τ of the prepared glass samples were collected in table 4.


Absorption and emission cross-sections
It is crucial to understand the gain bandwidth, the cross-section of the stimulated emission (σe), and the optical gain parameters for predicting the performance of laser in Sm3+ ions doped TW glass system. The gain bandwidth and optical gain values need to be quite large for a successful laser transition. Additionally, the stimulated emission cross-section is another factor to take into account when designing a laser because a high value for this parameter implies high-quality CW laser material.

The absorption cross-section (σa) of Sm3+ ions was obtained from the following equation [63,64]:
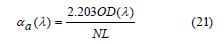
where N is defined as the concentration of Sm3+ ions in the density section that’s described previously and OD(λ) denotes the sample's optical density. The following equation was used to calculate the emission cross-section (σe) of Sm3+ ions containing glass [63,64]:
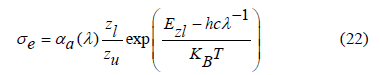
in which σe, σa denote the emission and absorption cross-sections respectively, Zl and Zu refer to the partition functions for the lower and upper states that are present in the considered optical transition, T in this case refers to the room temperature and Ezl is zero-line energy that’s related to the transition between the lower Stark sublevels of the emission multiplets and the receiving multiplets. Figure 13 displays the absorption and emission cross-sections that are calculated for the prepared Sm3+ ions doped in the glass samples. For the studied glasses, the stimulated emission cross-section peak (σEP) was typically 5.98 × 10⁻²⁰, 4.69 × 10⁻²⁰, 6.47 × 10⁻²⁰, 4.66 × 10⁻²⁰ and 6.31 × 10⁻²⁰ cm2, at which the Sm2O3 varied from 1.0 to 5.0 mol%, respectively. The highest σEP value is caused due to two reasons. The first one, it's because  has a high line strength value [63,68]. Second, since the glass has a relatively high refractive index [68]. Re-absorption will take place and lead to a deformation of the fluorescence spectrum because of the significant overlap between the absorption and emission spectra of Sm3+ ions.
The gain coefficient is crucial for evaluating the laser medium. The cross-section of the gain can be determined by using the absorption and emission cross-sections from the following equation [63],
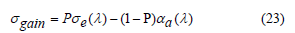
where σgain stands for the gain cross-section, σabs, and σems denote the absorption and emission cross sections respectively and P indicates the population inversion. Figure 14 illustrates the gain coefficient of the TW glass system doped with Sm2O3. The dependence of the wavelength of the gain cross section was obtained for (P=0, 0.1, 0.2, 0.3, 0.4, …, 1). The gain coefficient serves as guidance for prospective operating laser wavelength [63,64]. However, the inversion coefficient fraction is more inclined to be close to 0.2, as is common for such laser systems. It’s observed from the figure that the gain coefficients at 1088 nm are 6.00, 4.47, 6.47, 4.66 and 6.35 cm−1. Finally, it is well known that laser devices, systems, and applications are more likely to exhibit a 0.2 inversion, making these glasses appropriate for light amplification applications.
Conclusion
New glass series of Sm3+ ions doped Tungsten-tellurite glasses having the following chemical formula 80 TeO2- (20-x) WO3- x Sm2O3, x = 0.0, 1.0, 2.0, 3.0, 4.0, and 5 mol % have been synthesized. It could be concluded that:
a) Both VM and ρ increase with increasing concentrations of the dopant (Sm3+)
b) UV spectroscopic properties according to ASF:
c) In Tauc's model, optical energy band gaps in direct transition varied from 2.88 eV to 2.98 eV for Sm glass samples.
d) The indirect optical energy band gap values for Sm were found in the range 2.75 eV to 2.83 eV in Tauc's method.
e) By applying the ASF model, the optical energy band gap in direct transition varied from 2.89 eV to 2.99 eV for Sm glass samples.
f) The values of indirect optical energy band gaps varied from 2.75 eV to 2.81 eV when using the ASF model.
g) The values of the energy band gap for the indirect case were lower than those in the direct case for the prepared glass system.
h) The calculated refractive indices were high (around 2.5).
i) Molar refraction (Rm), reflection loss (RL), and dielectric constant (ε) showed a decreased trend with increasing concentrations of the dopant (Sm3+).
j) The electronic polarizability (αm), optical transmission (T), and Metallization criterion (M) showed an increasing trend with increasing concentrations of the dopant (Sm3+).
k) The value of χ* increases while χ(1) decreases with increment of Sm2O3 concentration from 1 to 5 mol%.
l) For the prepared glass system, JO spectroscopic parameters varied in the trend of Ω4 > Ω6 > Ω2. The lower Ω2 parameter was associated with the centrosymmetric and ionic character behavior of Sm3+ ions, whereas the larger values of Ω4 parameter were associated with the glasses’ rigidity.
m) These glasses were validated as a good option and an excellent choice for optical amplifier and laser technology applications due to their large values of the simulated cross-section and gain bandwidth values.
Declaration of Competing Interest
The authors declare that they have no known competing financial interests or personal relationships that could have appeared to influence the work reported in this paper.
Author Contribution and Research Data Policy
R.El-Mallawany: Idea, data curation, methodology, validation, investigation, writing original draft. Samir A. Yousef, A.El-Shaer, S. Marzouk data curation, methodology, calculations and shared in the analysis. Hanan A. Elabd (Ph.D. candidate) Sample Preparation, experimental measurements, calculations and shared in the analysis. All authors provided critical feedback and helped shape the research, analysis, and manuscript.
References
- Varshneya AK (2013) Fundamentals of inorganic glasses. Elsevier, USA.
- R El Mallawany (2024) The Physics of Advanced Optical Materials: Tellurite Glasses, Published by Springer, pp. 200.
- Vijayasri D, Rudramamba KS, Srikanth T, Mahendra RN, Nakka M, et al. (2023) Spectroscopic features of Tb3+ doped strontium zinc borate glasses for green laser applications. Journal of Molecular Structure 1274: 134514.
- Hager IZ, Mallawany REl, Poulain M (1999) Infrared and Raman spectra of new molybdenum and tungsten oxyfluoride glasses. Journal of materials science 34(21): 5163-5168.
- Al Qahtani SD, Binyaseen AM, Aljuhani E, Aljohani M, Alzahrani HK, et al. (2022) Production of smart nanocomposite for glass coating toward photochromic and long-persistent photoluminescent smart windows. Ceramics International 48(1): 903-912.
- A El Adawy, Mallawany REl (1996) Elastic modulus of tellurite glasses. Journal of materials science letters 15(23): 2065-2067.
- Wang J, Jia Z, Zhang C, Sun Y, Ohishi Y, et al. (2022) Thulium-doped fluorotellurite glass fibers for broadband S-band amplifiers. Optics Letters 47(8): 1964-1967.
- Mallawany REl, Sidkey M, Khafagy A, Afifi H (1994) Elastic constants of semiconducting tellurite glasses. Materials chemistry and physics 37(3): 295-298.
- Kilic G, Ilik E, Mahmoud KA, Mallawany R El, El Agawany FI, et al. (2020) Novel zinc vanadyl boro-phosphate glasses: ZnO–V2O5– P2O5–B2O3: Physical, thermal and nuclear radiation shielding properties. Ceramics International 46(11): 19318-19327.
- Mallawany REl, Abousehly A, El Rahamani AA, Yousef E (1998) Radiation effect on the ultrasonic attenuation and internal friction of tellurite glasses. Materials chemistry and physics 52(2): 161-165.
- Elkhoshkhany N, Mallawany REl, Syala E (2016) Mechanical and thermal properties of TeO2–Bi2O3–V2O5–Na2O–TiO2 glass system. Ceramics International 42(16): 19218-19224.
- Andrianov AV, Anashkina EA (2022) Thermo-optical control of L-band lasing in Er-doped tellurite glass microsphere with blue laser diode. Optics Letters 47(9): 2182-2185.
- Sidkey MA, Mallawany REl, Nakhla RI, Abd El Moneim A (1997) Ultrasonic Attenuation at Low Temperature of TeO2–V2O5 Physica Status Solidi (a) 159(2): 397-404.
- Mallawany RAEl, El-Deen LMS, Elkholy MM (1996) Dielectric properties and polarizability of molybdenum tellurite glasses. Journal of materials science 31(23): 6339-6343.
- Sidkey MA, El Mallawany RA, Abousehly AA, Saddeek YB (2002) Relaxation of longitudinal ultrasonic waves in some tellurite glasses. Materials chemistry and physics 74(2): 222-229.
- Belançon MP, Sandrini M, Muniz HS, Herculano LS, Lukasievicz GVB, et al. (2022) Float, borosilicate and tellurites as cover glasses in Si photovoltaics: Optical properties and performances under sunlight. Journal of Physics and Chemistry of Solids 161: 110396.
- Hampton RN, Hong W, Saunders G, El-Mallawany RA (1988) Dielectric properties of tellurite glass. Physics and chemistry of glasses 29(3): 100-105.
- Niu L, Shi H, Ye Y, Liu C, Jia B, et al. (2022) Optimized tellurite glasses containing CsPbBr3-quantum dots for white-light emitting diodes. Journal of Non-Crystalline Solids 581: 121429.
- El Mallawany R (1992) Structural and vibrational investigations of thermal properties of tellurite glasses. Journal of materials research 7(1): 224-228.
- Damak K, Yousef E, AlFaify S, Russel C, Maalej R (2014) Raman, green and infrared emission cross-sections of Er3+ doped TZPPN tellurite glass. Optical Materials Express 4(4): 597-612.
- Chen H, Liu YH, Zhou YF, Zhang QY, Jiang ZH (2005) Spectroscopic properties of Er3+ doped TeO2–BaO (Li2O, Na2O)–La2O3 glasses for 1.5-μm optical amplifiers. Journal of non-crystalline solids 351(37-39): 3060-3064.
- Lachheb R, Damak K, Assadi AA, Herrmann A, Yousef E, et al. (2015) Characterization of Tm3+ doped TNZL glass laser material. Journal of luminescence 161: 281-287.
- Marzouk SY, Hammad AH (2021) Influence of samarium ions on the structural, and optical properties of unconventional bismuth glass analyzed using the Judd–Ofelt theory. Journal of Luminescence 231: 117772.
- Elkhoshkhany N, Marzouk SY, Khattab MA, Dessouki SA (2018) Influence of Sm2O3 addition on Judd-Ofelt parameters, thermal and optical properties of the TeO2-Li2O-ZnO-Nb2O5 glass system. Materials Characterization 144: 274-286.
- Judd BR (1962) Optical absorption intensities of rare-earth ions. Physical review 127(3): 750.
- Ofelt G (1962) Intensities of crystal spectra of rare‐earth ions. The journal of chemical physics 37(3): 511-520.
- El Mallawany R, Yousef SA, El Shaer A, Hanan AE (2023) Elastic moduli of some rare-earth doped tellurite glasses. Journal Theoretical and Applied Physics.
- Carnall W, Fields P, Rajnak K (1968) Electronic energy levels in the trivalent lanthanide aquo ions. I. Pr3+, Nd3+, Pm3+, Sm3+, Dy3+, Ho3+, Er3+, and Tm3+. The Journal of chemical physics 49(10): 4424-4442.
- Nieboer E (1975) Radiative and non-radiative transitions of rare-earth ions in glasses. in Rare Earths. Springer.
- Sailaja B, Joyce SR, Thirumala RG, Jaya RB, Pushpa MV, et al. (2015) Physical, structural and spectroscopic investigations of Sm3+ doped ZnO mixed alkali borate glass. Journal of Molecular Structure 1096: 129-135.
- Tanko Y, Sahar M, Ghoshal S (2016) Prominent spectral features of Sm3+ ion in disordered zinc tellurite glass. Results in Physics 6: 7-11.
- Selvi S, Marimuthu K, Muralidharan G (2015) Structural and luminescence behavior of Sm3+ ions doped lead boro-telluro-phosphate glasses. Journal of Luminescence 159: 207-218.
- Lösche A, NF Mott, EA Davis (1972) Electronic Processes in Non‐Crystalline Materials Clarendon‐Press. Oxford 1971 437 Seiten. £ 7, 50, Wiley Online Library.
- Davis E, Mott N (1970) Conduction in non-crystalline systems V. Conductivity, optical absorption and photoconductivity in amorphous semiconductors. Philosophical magazine 22(179): 0903-0922.
- Fritzsche H, Tauc J (1974) Amorphous and liquid semiconductors. Plenum Press, New York pp. 254.
- Urbach F (1953) The long-wavelength edge of photographic sensitivity and of the electronic absorption of solids. Physical Review 92(5): 1324.
- Dimitrov V, Sakka S (1996) Electronic oxide polarizability and optical basicity of simple oxides. I. Journal of Applied Physics. 79(3): 1736-1740.
- Elkholy H, Othman H, Hager I, Ibrahim M, De Ligny D (2020) Thermal and optical properties of binary magnesium tellurite glasses and their link to the glass structure. Journal of Alloys and Compounds 823: 153781.
- Bhatia V, Kumar D, Kumar A, Mehta V, Chopra S, et al. (2019) Mixed transition and rare earth ion doped borate glass: structural, optical and thermoluminescence study. Journal of Materials Science: Materials in Electronics 30(1): 677-686.
- Kaur R, Bhatia V, Kumar D, Rao SMD, Singh SP, et al. (2019) Physical, structural, optical and thermoluminescence behavior of Dy2O3 doped sodium magnesium borosilicate glasses. Results in Physics 12: 827-839.
- Sayyed M, Rammah YS, Laariedh F, Abouhaswa AS, Badeche TB (2020) Lead borate glasses doped by lanthanum: synthesis, physical, optical, and gamma photon shielding properties. Journal of Non-Crystalline Solids 527: 119731.
- Umar S, Halimah MK, Chan KT, Latif AA (2017) Polarizability, optical basicity and electric susceptibility of Er3+ doped silicate borotellurite glasses. Journal of Non-Crystalline Solids 471: 101-109.
- Kundu R, Dhankhar S, Punia R, Nanda K, Kishore N (2014) Bismuth modified physical, structural and optical properties of mid-IR transparent zinc boro-tellurite glasses. Journal of Alloys and Compounds 587: 66-73.
- El Diasty F, Abdel WFA, Abdel BM (2006) Optical band gap studies on lithium aluminum silicate glasses doped with Cr3+ Journal of applied physics 100(9): 093511.
- Rockenberger J, Scher E, Alivisatos A (1999) Synthesis of monodisperse iron oxide nanocrystals by thermal decomposition of iron carboxylate salts. J Am Chem Soc 121: 11595-11596.
- Duffy JA (1990) Bonding, energy levels, and bands in inorganic solids. Longman Scientific and Technical.
- Dresselhaus G, Dresselhaus M (1966) Magneto-optical effects in solids. The optical properties of solids p. 198.
- Elkhoshkhany N, Essam R, El Yousef S (2020) Influence of La2O3 on the structural, optical and thermal properties of TeO2–ZnO–Li2O–Nb2O5 Journal of Non-Crystalline Solids 536: 119994.
- Halimah M, Faznny MF, Azlan MN, Sidek HAA (2017) Optical basicity and electronic polarizability of zinc borotellurite glass doped La3+ Results in physics 7: 581-589.
- Mahraz ZAS, Sahar MR, Ghoshal SK, Dousti MR (2013) Concentration dependent luminescence quenching of Er3+-doped zinc boro-tellurite glass. Journal of luminescence 144: 139-145.
- Lin H, Tanabe S, Lin L, Hou YY, Liu K, et al. (2007) Near-infrared emissions with widely different widths in two kinds of Er3+-doped oxide glasses with high refractive indices and low phonon energies. Journal of luminescence 124(1): 167-172.
- Krupke W (1974) Induced-emission cross sections in neodymium laser glasses. IEEE Journal of Quantum Electronics 10(4): 450-457.
- Carnall W, Fields P, Rajnak K (1968) Electronic energy levels of the trivalent lanthanide aquo ions. IV. Eu3+. The Journal of Chemical Physics 49(10): 4450-4455.
- Hemalatha S, Nagaraja M, Madhu A, Suresh K, Srinatha N, et al. (2021) The role of Sm2O3 on the structural, optical and spectroscopic properties of multi-component ternary borate glasses for orange-red emission applications. Journal of Non-Crystalline Solids 554: 120602.
- Subrahmanyam T, Suvarna RP, Jamalaiah BC, Rao C (2018) Optical properties of Sm3+-doped TeO2WO3GeO2 glasses for solid state lasers. Physica B: Condensed Matter 533: 76-82.
- Krishna V, Mahamuda SK, Rekha RP, Swapna K, Venkateswarlu M, et al. (2020) Effect of samarium ions concentration on physical, optical and photoluminescence properties of Oxy-Fluoro Boro Tellurite glasses. Optical Materials 109: 110368.
- Ravina N, Sheetal VK, Dahiya S, Deopa N, Punia R, et al. (2021) Judd-Ofelt itemization and influence of energy transfer on Sm3+ ions activated B2O3–ZnF2–SrO–SiO2 glasses for orange-red emitting devicesJ. Lumin 229: 117651.
- Ghosh S, Jana S, Biswas J (2022) Structural, thermal and spectroscopic properties of samarium (Sm3+) doped tungsten zinc tellurite glass for application in orange light emitting devices. Physica B: Condensed Matter 644: 414205.
- Jia G, Tu CY, Li JF, Zhu ZJ, You ZY, et al. (2004) Spectroscopy of GdAl3 (BO3)4: Tm3+ Journal of applied physics 96(11): 6262-6266.
- W Guo, Chen Y, Lin Y, Luo Z, Gong X, et al. (2008) Spectroscopic properties and laser performance of Tm3+-doped NaLa (MoO4)2 Journal of Applied Physics 103(9).
- Nii H, Ozaki K, Herren M, Morita M (1998) Up-conversion fluorescence of Er3+ - and Yb3+-doped TeO2-based oxide glass and single crystals. Journal of luminescence 76-77: 116-119.
- Praveena R, Venkatramu V, Babu P, Jayasankar CK (2008) Fluorescence spectroscopy of Sm3+ ions in P2O5–PbO–Nb2O5 Physica B: Condensed Matter 403(19-20): 3527-3534.
- Yousef ES, Elokr M, Aboudeif Y (2015) Deduction of the Luminescence Parameters of Tellurium Oxide Based Glasses Doped with Er3+ Chalcogenide Letters 12(11).
- Okasha A, Abdelghany A, Marzouk S (2017) Judd–Ofelt analysis of spectroscopic properties of Sm3+ doped P2O5–SrO glasses. Journal of Materials Science: Materials in Electronics 28: 12132-12138.
- Mariyappan M, Arunkumar MS, Marimuthu K (2016) Effect of Bi2O3 on the structural and spectroscopic properties of Sm3+ ions doped sodiumfluoroborate glasses. Journal of Molecular Structure 1105: 214-224.
- Karthikeyan P, Arunkumar S, Basavapoornima C, Marimuthu K (2016) Modifier effect on the spectroscopic properties of tellurofluoroborate glasses containing Sm3+ Journal of Luminescence 178: 43-53.
- Agarwal A, Pal I, Sanghi S, Aggarwal MP (2009) Judd–Ofelt parameters and radiative properties of Sm3+ ions doped zinc bismuth borate glasses. Optical materials 32(2): 339-344.
- Emara A, Alqahtani MM, Abou DYM, Yousef ES (2017) Emission cross section and luminescence spectroscopy of samarium oxide doped tellurite glasses. Chalcogenide Letters 14(9).


