Design and Preparation of Cresol Red Indicator on High Conducting Surface (SnO2) using Spin Coating Method
Nasser M Abu Ghalwa*, Fawzi Kodih, Nader B Farhat and Amer Said Abu Muammer
Department of Chemistry, Al-Azhar University, Palestine
Submitted: December 19, 2022; Published: January 18, 2023
*Corresponding author: Nasser M Abu Ghalwa, Department of Chemistry, Al-Azhar University, Gaza, Palestine
How to cite this article: Nasser M Abu G, Fawzi K, Nader B F, Amer Said Abu M. Design and Preparation of Cresol Red Indicator on High Conducting Surface (SnO2) using Spin Coating Method. JOJ Material Sci. 2023; 7(3): 555711. DOI: 10.19080/JOJMS.2023.07.555711
Abstract
The development and research of chemical sensors is becoming one of the most popular scientific areas at the intersection of the chemical and the engineering sciences. Semiconducting technology has matured so much that we see now a rapid developed of new different approaches in preparation of sensors. This study investigated the preparation of the modified electrodes of type glass SnO2/ Cresol red (G/CR) and their use as sensor indicator electrodes in the potentiometric acid-base titrations in aqueous solution at 298K and study the effect presence of and (HY) surfactant on time response. In this study the E-pH curve is linear with slope of 51.581V/dec at 298K. This value is close to the theoretical value 2.303RT/F (0.059V at 298K) and the recovery percentage for potentiometric acid-base titration using G/ CR as indicator electrode was calculated. The results show that the response time reaches the steady state potential in less time response in presence of surfactant for different concentration of acids and ammonia.
Keywords: Cresol red G/CR; SnO2; Surfactant; Acid-base titration
Introduction
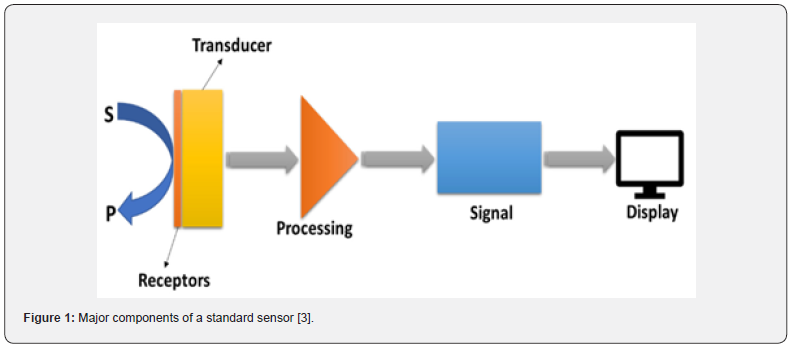
The world of sensors is diverse and is advancing at a rapid pace due to the fact of its high demand and constant technological improvements. Electrochemical sensors provide a low-cost and convenient solution for the detection of variable analytes and are widely utilized in agriculture, food, and oil industries as well as in environmental and biomedical applications [1]. A chemical sensor is defined by the IUPAC as “a device that converts chemical data, ranging from the concentration of a single sample component to complete composition analysis, into an analytically usable signal”. For the most part, a chemical sensor is constituted of two essential functional units: a receptor and a physicochemical transducer. The receptors are variable and can range from activated or doped surfaces to complex (macro)molecules that create highly specific interactions with the analyte (Figure 1) [2,3]. Chemical and Electrochemical sensor are of utmost importance for medical, biological and environmental applications. However, converting the chemical information to an easily processed electronic signal is challenging due to the complexity of connecting an electronic device directly to the samples. Electrochemical biosensors provide an attractive means to analyze the content of a chemical sample due to the direct conversion of a chemical event to an electronic signal [4].
The wide-band-gap semiconductor SnO2 has long been a material of interest for both applied and pure research. Tin dioxide has most notably been employed as a transparent conductor, exploiting both the unintentional conductivity and the large degree of transparency [5]. SnO2 is a wide band-gap semiconductor with a band gap of 3.6eV and was the first transparent conducting oxides to receive significant commercialization. It exhibits good transparency and can be easily n-type doped. Degenerate carrier densities can be achieved by doping with fluorine [6,7]. SnO2 have excellent transparency, chemical stability, optical and electrical properties. Because of these characteristics, SnO2 has a wide range of applications such as solar cells, transparent conducting electrodes, gas sensors, optoelectronic devices and transistors [8].
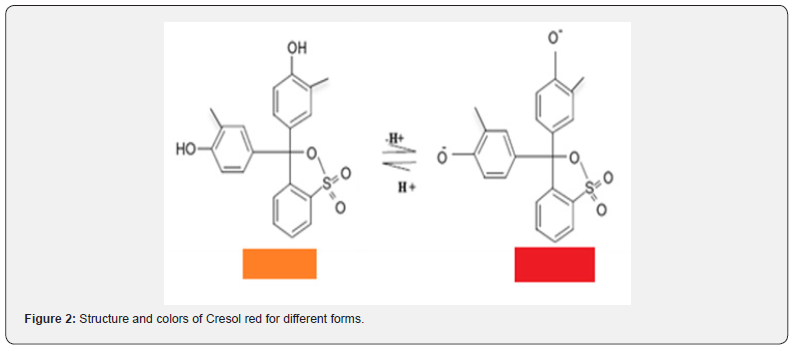
In this context Nasser et al developed of a new conductive glass / thymol blue TB and bromothymol Blue (BRB) sensors electrodes by spin coating of the (TB) and (BRB) indicators on conductive glass formed from F-SnO2 for used as indicator electrodes to potentiometric acid-base titration in aqueous solution [9,10]. Cresol red (full name: o-cresol sulfone phthalein) is a triarylmethane dye frequently used for monitoring the pH in solution. A solution of cresol red exists in two forms, acid form (orange color), and the base form (red color) [11] (Figure 2).
For the purpose this study focuses on the Cresol red to prepare a new modified electrode coated on conducting glass film as sensor (glass / indicator electrode), for used in potentiometric acid base titration.
Experimental
Chemicals
The chemicals used in potentiometric titrations and preparation the electrode was tetraethyl orthosilicate (TEOS), Cresol red (CR), hydrochloric acid, ammonia, Acetic acid, phosphoric acid, sodium hydroxide, sulfuric acid, citric acid and disodium phosphate. The chemicals are of analytical pure grade.
Synthesis of materials
Preparation of hydrolyzed TEOS
A mixture of 2.5ml of absolute ethanol, 0.86 ml of 0.1M of HCl were added to 2.5ml of TEOS under stirring. The obtained solution was kept under stirring at room temperature until a homogeneous clear solution was obtained. The solution was aged at least for 24 hours before used in the coating process. The hydrolyzed TEOS solution was used as a host matrix for the indicators (CR).
Preparation of indicators
Indicators solution (1 × 10⁻³M) of cresol red (CR) was prepared using absolute ethanol as solvent.
Stock solution of indicators: The sample solution was prepared by mixing 1ml of blank hydrolyzed TEOS solution and 1ml for indicator.
Preparation of silica-immobilized thin films
Substrate cleaning: Glass was activated by concentrated H2SO4 for 24 hours, then washed with distilled water and ethanol. The surface was finally rubbed with cleaning paper.
Preparation of glass/CR electrodes using spin coating method: All thin films layers prepared in this work were made by spinning three drops of the solutions onto a clean glass slide. The coating process was performed using the spin coater machine at 900rpm spinning speed for 1 min. period time. To obtain multilayers of thin films a subsequent spin coating method was performed after gradually drying of the previous layer at room temperature for 24 hours, and then dried at 80oC for another 48 hours.
Sensor design of potentiometric cell
The potential of the indicator electrode relative to the reference electrode was measured on a digital millimeter, model YDM 302C (China). The potential was measured at ± 5 mV. The potentials of the glass electrodes of the cresol red sensor indicator was measured relative to the saturated calomel electrode (SCE). The error in the measurement of the potential due to liquid- junction potentials in these electrolytes is estimated to be about 0.001 V. Titration was carried out in a (100ml) Pyrex glass beaker which the acid or base put in it and the base or the oxidant placed in a 25ml micro burette. The solution in a beaker is stirred by means of a magnetic stirrer. The electrodes (indicator and reference) were dipped slowly into aqueous solution (acid or base). After the steady state potential was attained, the titration of the acid was carried out by addition of 1ml of the base to the acidic solution, waiting until the steady potential is established and then measured. The potential variation depends on the type of the base, the progress of neutralization process and on the initial concentration of the acid to be titrated. The results were reproducible to satisfactory value of ± 5mV for potential measurements. The process of addition of the titrant was repeated until the equivalence point was reached.
Result and Discussion
Glass/Cresol red indicator electrode
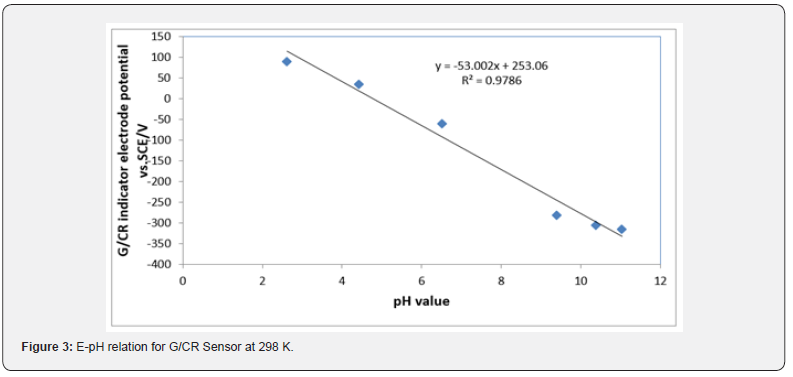
The E-pH relation of (CR) electrode: Figure 3 shows the change of the open circuit potential (E) of the G/CR indicator electrode with pH. The E-pH plot of the. Cresol red electrode fits straight line with slope of 51.581 at 298 K. This value is close to the magnitude of the term 2.303 RT/F at the corresponding temperature (0.059 V at 298 K). From Fig. the E0 value of the (CR) electrode, i.e. the potential at [H+] = 1, is computed as 325.32 mV relative to the saturated calomel electrode.
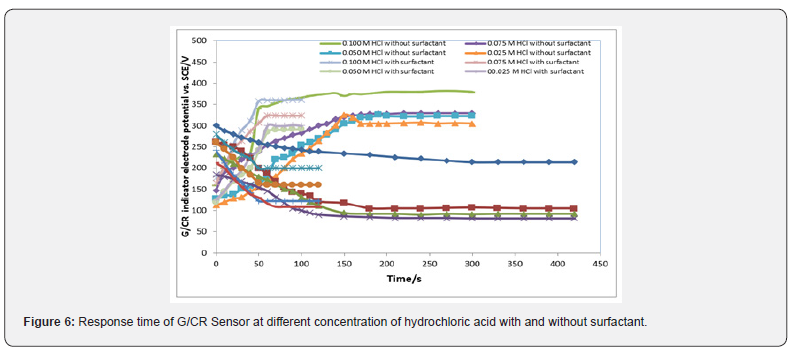
The response time of the sensor: Figures 4-7 offer the response time of the G/CR sensor at different concentration of phosphoric acid, acetic acid, Hydrochloric acid, ammonia and NaOH respectively. Response time, in the range of (100-450) seconds was achieved, which rendered the sensor highly practical.
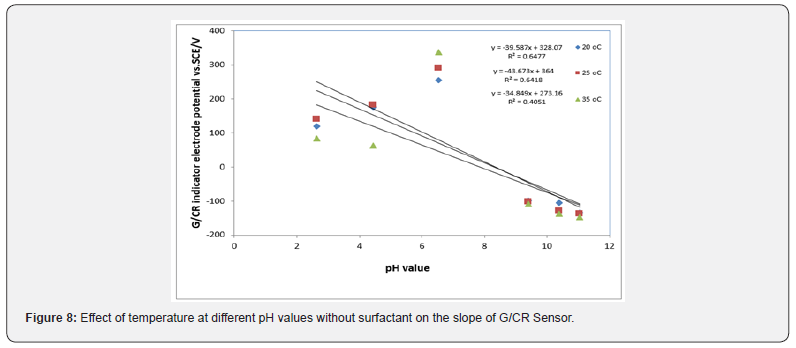
Effect of temperature on the response characteristics: The Cresol red sensor response was evaluated at different temperatures without and with surfactant (HY) (Figures 8 & 9). At lower temperatures, like 288K, the slope of the sensor was about 38.97mV/decade and the sensor would be used for pH measurements in the range from (2-11). However, when the temperature of the test solutions was adjusted to 298K, the slope significantly increased to 51.58mV/decade. By raising the temperature to 308K the slope increased to 53.64mV/decade. Figures 8 & 9 show the square of the correlation coefficient (r2) for pH measurements using the solid-state sensor, at different temperatures, as compared to pH values obtained by a conventional pH electrode (Hanna Instruments HI 1131 pH combination electrode) was found to change as the temperature increases whereas r2 values for measurements at 288K, 298K and 308K were 0.961, 0.98, 0.87 respectively. This indicates that better results could be obtained at 298K.




The relation between conventional glass pH electrode and G/ Cresol red indicator electrode
Figure 10 shows the correlation between the conventional glass pH electrode and G/Cresol red indicator electrode, it can be easily recognized that excellent correlation between the results obtained by the solid-state pH sensor and the conventional glass pH electrode could be achieved. The slope of this relation was 1.049 and the r2 was 0.951. This indicate that G/CR indicator electrode potential values are closed to the values of conventional glass pH electrode.

Potentiometric acid-base titration
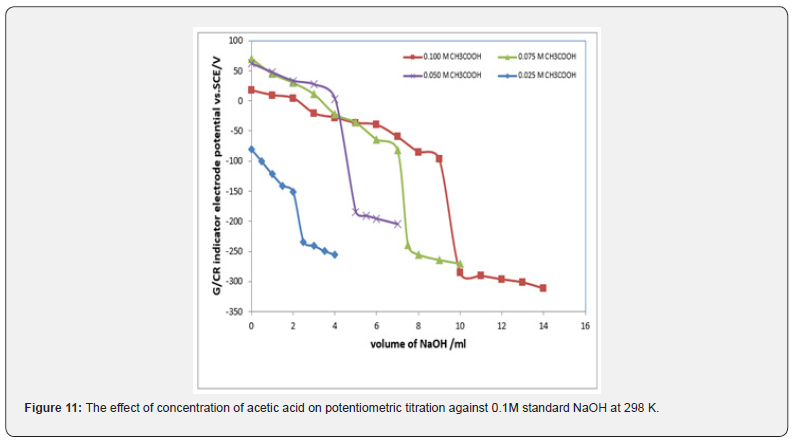
Potentiometric of weak acids against solution of NaOH: Figures 11 & 12 represent the relation between the volume of 0.1M NaOH with potential shift in the titrations at different concentrations of acetic acids and phosphoric acid. The variation of G/CR electrode potential at 298K with the different volumes of standard 0.1M NaOH followed typical potentiometric titration curves. These curves show slight decrease in potential (to more negative values) with the addition of the titrant. For locating end points, better results are obtained by constructing a plot of ΔE/ΔV against V of titrant.

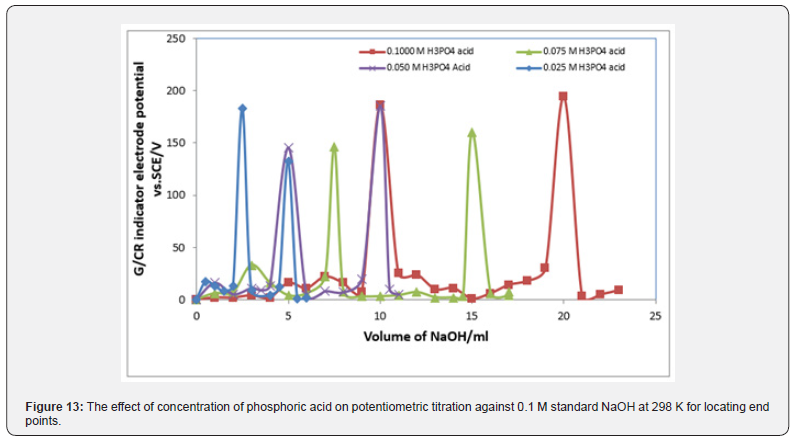
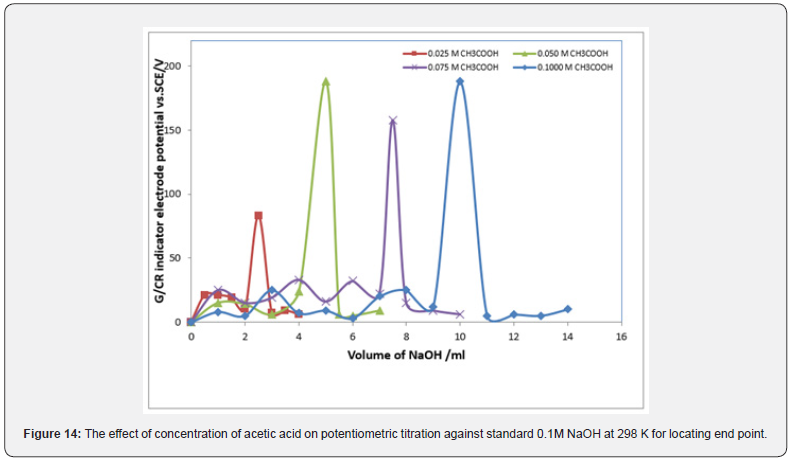
Figures 13 & 14 display ΔE/ΔV against V plot for the potentiometric titrations of CH3COOH and H3PO4 with 0.1M standard NaOH. From the plots the values of end points are determined. The obtained results and calculated values of (R%) are listed in tables 1 & 2 for acetic acid and phosphoric acid respectively. The values of pKa for different concentration of acetic acid and phosphoric acid can be determined using the method of half neutralization. as shown in table 3. The obtained values of pKa for the investigated bases are close to the previously reported values.


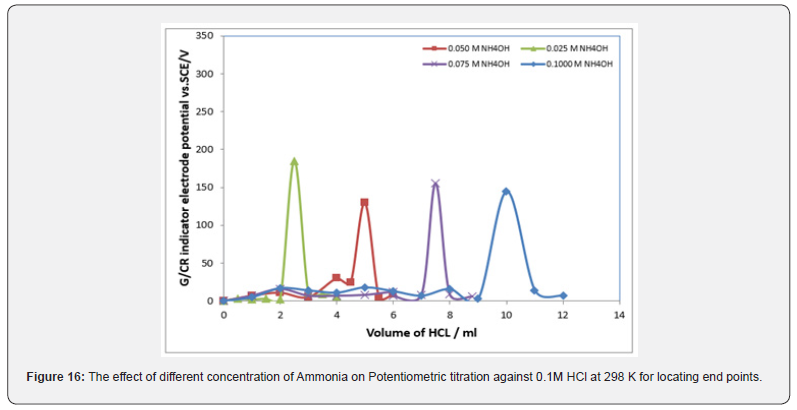
Potentiometric of weak base against solution of HCl: The relation between the volume of 0.1M standard HCl with each potential shift in the titrations of ammonia was shown in figure 15. The variation of the CR electrode potential at 298K with the different volumes of standard HCl followed typical potentiometric titration curves. These curves show slight increase in potential (to more positive values) with the addition of the titrant. For locating end points, better results are obtained by constructing a plot of ΔE/ΔV against V of titrant. Figure 16 display ΔE/ΔV against V for the potentiometric titrations of ammonia and 0.1M standard HCl respectively. From the plots the values of end points are determined. The obtained results and the calculated values of (R%) are listed in table 1. The values of pKb for different concentration of ammonia can be determined using the method of half neutralization. They are listed in table 3 for the tested bases. The obtained values of pKb for the investigated bases are close to the previously reported values.
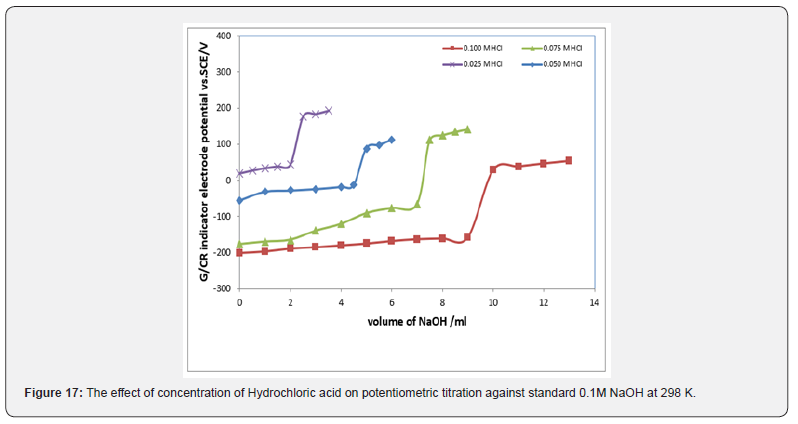

Potentiometric of strong acids against solution of NaOH: Figure 17 displays the relation between the volume of 0.1M NaOH with potential shift in the titrations of different concentrations of Hydrochloric acid The variation of G/CR electrode potential at 298K with the different volumes of standard NaOH followed typical potentiometric titration curves. These curves show slight decrease in potential (to more negative values) with the addition of the titrant. For locating end points, better results are obtained by constructing a plot of ΔE/ΔV against V of titrant. Figure 18 exhibit ΔE/ΔV against V plot for the potentiometric titrations of HCl with 0.1M standard NaOH. From the plots the values of end points are determined. The obtained results and the calculated values of (R%) are listed in table 1 for Hydrochloric acid.
Conclusion
According to this study, the dependent spin coating a thin films of Cresol red indicator on conductive glass formed from F-SnO2 as glass/indicator was studied in potentiometric titration in aqueous solution. The E-pH plot of the G /CR electrode fits straight line with slope of 51.581mV at 298K. The standard potential of the above electrode E0, was determined with respect to the SCE as reference electrode. The recovery percentage for potentiometric titration using G/CR as indicator electrode was calculated. The result show that the electrode very sensitivity for potentiometric acid - base titration.
References
Jaya B, Brajesh B, Gianluca G, Gabriela B, Amit K (2022) Electrochemical Sensors and Their Applications: A Review. Chemosensors 10: 363.
- Hulanicki A, Glab S, Ingman F (1991) Chemical sensors: Definitions and classification. Pure Appl Chem 63(9): 1247-1250.
- Shetti NP, Nayak DS, Reddy KR, Aminabhvi TM (2019) Graphene–Clay- Based Hybrid Nanostructures for Electrochemical Sensors and Biosensors. In: Graphene-Based Electrochemical Sensors for Biomolecules; Elsevier: Amsterdam, The Netherlands, pp. 235-274.
- Dorothee G, Robert M, Janos V, Erik R (2008) Electrochemical Biosensors - Sensor Principles and Architectures. Sensors (Basel) 8(3): 1400- 1458.
- Schleife A, Varley JB, Fuchs F, Rodl C, Bechstedt F, et al. (2011) Tin dioxide from first principles: Quasiparticle electronic states and optical properties A. Physical review B 83(3): 035116.
- Frohlich D, Kenklies R, Helbig R (1978) Band-Gap Assignment in SnO2 by Two-Photon Spectroscopy. Phys Rev Lett p 41(25): 1750-1751.
- Schleife JB, Varley FF, Odl CR, Bechstedt F, Rinke P, et al. (2011) Tin dioxide from first principles: Quasiparticle electronic states and optical properties. Phys Rev 83(3).
- Wang X, Fan H, Ren P (2012) UV light-assisted synthesis of coral SnO2: characterization and its enhanced photocatalytic properties. Colloids Surf A: Physicochem Eng Asp 402: 53-59.
- Nasser MAG, Fawzi K, Nader BF, Rewaa JAS (2020) Synthesis of a Novel Sensor Electrode Based on Bromothymol Blue as an Indicator Electrode in Potentiometric Acid-Base Titration in Aqueous Solution. Organic & Medicinal Chem IJ 9(3).
- Nasser MAG, Fawzi K, Nader BF, Rewaa JAS (2021) A Spin Coating of Thymol Blue Indicator on F-SnO2 Glass to fabricate a Novel Sensor Electrode in Potentiometric Acid-Base Titration. JOJ Material Sci 6(3).
- El Nahhal, Zourab MS, Kodeh FS, Babonneau F, Hegazy W (2012) Sol- Gel Encapsulation of Cresol Red in Presence of Surfactants. J of Sol-Gel Science and Technology 71: 117-125.


