




 JDVS Home



Abstract
The effects of dietary crude protein on serum metabolites were evaluated in periparturient Tswana goats. Thirty does were assigned to diets supplying 100%, 150%, or 200% of CP maintenance requirements from 4 weeks pre-mating to 18 weeks post-kidding. Increasing CP to 200% increased serum urea to 13.0 ± 1.39 mmol/L at Week 38 (P < 0.05) but did not alter total protein, albumin, globulin, or lipid metabolites. Severe periparturient hypoglycemia (1.93 ± 0.21 mmol/L) occurred in does feed 200% CP that bore twins at Week 20. The results indicate that protein supply above maintenance does not alleviate periparturient negative energy balance and that dietary energy is the primary limiting factor for twin-bearing Tswana does. CP at 150% of maintenance-maintained blood protein status without the excessive nitrogen excretion observed at 200% CP.
Keywords:Tswana Goat; Crude Protein; Periparturient; Hypoglycemia; Urea
Abbreviations:CBR: Complete Randomised Design; EDTA: Ethylene-Diamine Tetra Acetic Acid; GLM: General Linear Model; TP: Total protein; GLUC: Glucose; GLOB: Globulin; TRIG: Triglycerides; CHOL: Cholesterol; LIPA: Lipase; ALB: Albumin
Introduction
Blood is an important medium in assessing the health status of animals Brown et al. [1]. The physiological and pathological conditions of animals can be assessed by hematology and biochemical analyses of blood Khan et al. [2]. Concentration of metabolites and enzymes in blood serum are biochemical characteristics with strong relationships with physiological events in goats Zulkifli et al. [3]. According to Brown et al. [1], Tswana goats are important domestic animals in some regions, especially Limpopo, South Africa. Furthermore, Motubatse et al. [4] state that goats contribute immensely to the economy and food security of many smallholder farms in the area. However, their productivity is constrained by shortage of good quality feed, especially during the long dry season Brown et al. [1]. Blood profiles of animals are particularly sensitive to changes in environmental temperature and are an important indicator of physiological responses to stressing agents in goats. It is an important medium in assessing the health status of animals.
According to Gupta et al. [5], examining blood for their constituents is used to monitor and evaluate health and nutrition status of animals. According to Madan et al. [6], hematological, biochemical, and mineral profiles are important to be determined because they provide valuable information about the breed, sex and health status of animals. There is considerable information about the normal parameters of blood of domestic animal species, however, the values are expected to vary according to breed, different environmental factors and different methods of management Sharma & Kataria [7]. According to Shah et al. [8], physiological adaptation and the systemic relationship are widely determined using hematological values. Many authors have reported that biochemical profiles show some changes and blood plasma components vary according to growth requirements, breed and age Piccione et al. [9], environmental factors, management conditions and sexual maturity Piccione et al. [10]. This experiment was conducted to evaluate the impact of different dietary protein levels on goat minerals and blood parameters.
Materials and methods
Animals, and experimental design
Twenty-four clinically healthy, non-pregnant, 3-month-old female Tswana weaner goats were used. The 84-day feeding trial was conducted at the NWU Molelwane Farm, North West Province, South Africa. Goats were randomly allocated to three dietary protein treatments [n = 8 per treatment] in a completely randomised design, as stipulated in protocol NWU-00019-14-S9.
Dietary treatments
Total mixed rations consisting of maize, grass hay and soybean meal were formulated to contain three crude protein [CP] levels: T1 = 5% CP, T2 =10% CP, and T3 = 15% CP, based on Webb. Diets were offered at levels calculated to meet maintenance plus growth requirements. All animals had ad libitum access to water and were housed under uniform management conditions [11-13].
Blood sampling and biochemical analysis
Blood was collected via jugular venipuncture on Days 0, 42 and 84 of the trial, as approved under Specific Objective 3 of protocol NWU-00019-14-S9. Serum was analysed for glucose, albumin, albumin: globulin ratio, and urea using an IDEXX Catalyst One Chemistry Analyzer at the Animal Health Department Laboratory, North-West University.
Statistical Analyses
Blood metabolite data were analysed using PROC MIXED of SAS (2015) for repeated measures. The statistical model was:
Yijk = mu + Ti+ Wj + T times Wij + Gki + Eijk
Where: Yijk= observation for treatment i, week j, goat k_
μ = overall mean
Ti = fixed effect of dietary treatment (i = 1, 2, 3)
Wj = fixed effect of sampling week
TxWij = treatment × week interaction
Gk i= random effect of goat nested within treatment
Eijk= residual error
Least squares means were separated using Tukey’s test. Statistical significance was declared at P < 0.05.
Results
Serum glucose
The effects of dietary crude protein level on serum glucose of Tswana goats are presented in Table 1. Dietary treatment had no effect on serum glucose concentrations from Week 0 to Week 16 (P > 0.05). At Week 20, serum glucose declined significantly in all treatments compared to Week 16 (P < 0.05), with Treatment 1 at 0.86 ± 0.11, Treatment 2 at 0.94 ± 0.11, and Treatment 3 at 1.35 ± 0.14 mmol/L. Treatment 3 maintained higher glucose than Treatments 1 and 2 at Week 20 (P < 0.05). From Week 24 to Week 38, glucose concentrations increased but remained below prebreeding values. No treatment differences were observed from Week 24 to Week 38 (P > 0.05).
Serum albumin
The effects of dietary crude protein level on serum albumin concentrations of Tswana goats are shown in Table 2. Treatment 3 had higher serum albumin than Treatments 1 and 2 at Week 4, Week 32, and Week 36 (P < 0.05). Serum albumin in Treatment 3 increased from 27.3 ± 1.4 mmol/L at Week 0 to 39.2 ± 3.1 mmol/L at Week 28 and remained elevated through Week 38 at 30.1 ± 4.0 mmol/L. Treatments 1 and 2 showed smaller increases, peaking at Week 28 with 35.4 ± 2.0 and 38.1 ± 1.8 mmol/L respectively, before declining. At Week 38, Treatment 3 albumin was significantly higher than Treatment 1 (P < 0.05) but similar to Treatment 2 (P > 0.05). All treatments showed a general increase in albumin from Week 0 to Week 28, coinciding with gestation and early lactation.
Albumin : globulin
The effects of dietary crude protein level on serum albumin : globulin ratio of Tswana goats are presented in Table 3. Dietary treatment influenced A:G ratio at Week 0 and Week 32 (P < 0.05). At Week 0, Treatment 1 had a higher A:G ratio (0.70 ± 0.01ab) than Treatment 2 (0.70 ± 0.02b) and Treatment 3 (0.70 ± 0.01a). At Week 32, Treatment 3 had the highest A:G ratio (0.78 ± 0.04ab), differing from Treatment 2 (0.72 ± 0.03b) but not Treatment 1 (0.65 ± 0.03a). No treatment differences were observed from Week 4 to Week 28 or at Weeks 36 and 38 (P > 0.05). A:G ratio remained relatively stable across treatments, ranging from 0.60 to 0.80, which is within the normal physiological range for goats.
Serum urea
The effects of dietary crude protein level on serum urea concentrations of Tswana goats are presented in Table 4. Serum urea increased with dietary CP level from Week 8 to Week 38 (P < 0.05). Treatment 3 had the highest urea concentrations throughout the trial, peaking at 13.33 ± 0.95 mmol/L at Week 38. Treatment 2 was intermediate, and Treatment 1 had the lowest urea. At Week 20, coinciding with parturition, urea concentrations were 7.12 ± 0.43, 8.90 ± 0.40, and 9.84 ± 0.46 mmol/L for Treatments 1, 2, and 3 respectively. All treatments showed a general increase in urea from Week 16 to Week 38, reflecting increased protein intake and catabolism during gestation and lactation. By Week 38, Treatment 3 urea was significantly higher than Treatment 1 (P < 0.05).
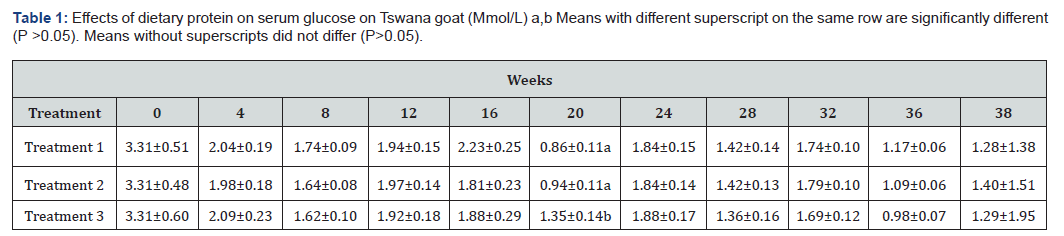
Treatment 1= maintenance X1; Treatment 2 = maintenance X2; Treatment 3 = maintenance X3 (treatment 1 means they were fed once times maintenance, then two times maintenance and three times maintenance). There was a significant difference (P<0.05) between treatment with high concentrations 3.31- 1.29 Mmol/L for treatment 3 and 3.31-1.40 and 3.31-1.28 Mmol/L respectively.
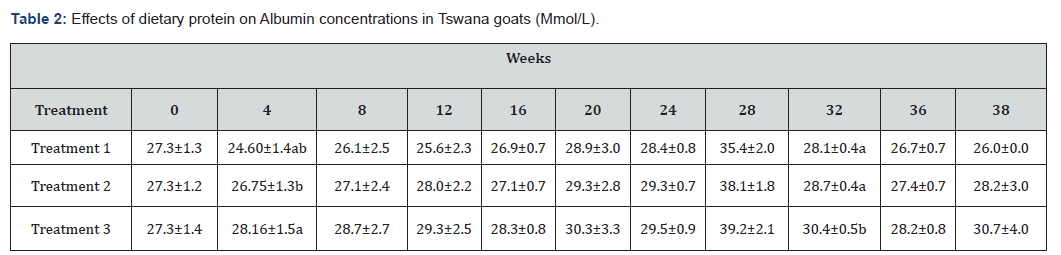
a,b Means with different superscripts on the same column are significantly different (P<0.05).
Treatment 1= maintenance X1; Treatment 2 = maintenance X2; Treatment 3 = maintenance X3.
Significant differences (P<0.05) in serum concentrations were observed between the three treatments through the period of experiment.
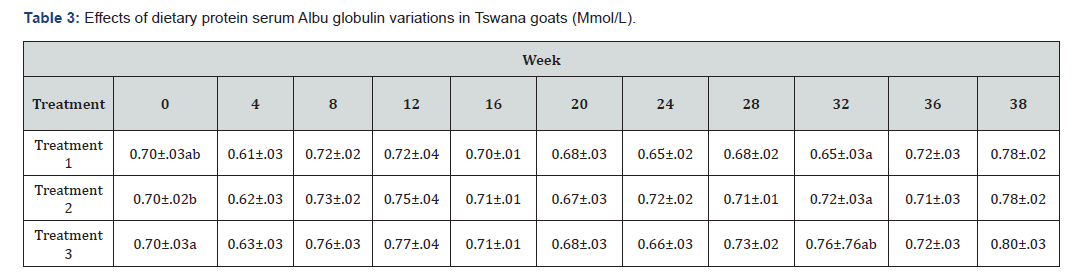
a,b Means with different superscript on the same row are significantly different (P<0.05). Means without superscripts did not differ (P>0.05) Treatment 1= maintenance X1; Treatment 2 = maintenance X2; Treatment 3 = maintenance X3.
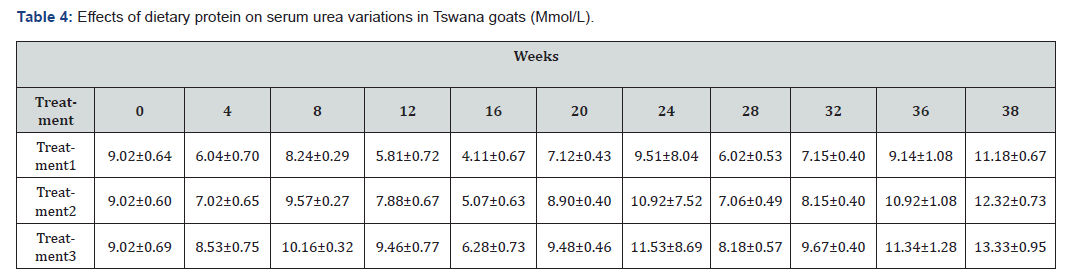
a,b Means with different superscript on the same row are significantly different (P<0.05). Means without superscripts did not differ (P>0.05).
Treatment 1= maintenance X1; Treatment 2 = maintenance X2; Treatment 3 = maintenance X3
Means without superscripts did not differ (P>0.05).
Treatment 1= maintenance X 1; Treatment 2 = maintenance X 2; Treatment 3 = maintenance X 3
Means without superscripts did not differ (P>0.05).
Treatment 1= maintenance X1; Treatment 2 = maintenance X2; Treatment 3 = maintenance X3

Means without superscripts did not differ (P>0.05).
Treatment 1= maintenance X1; Treatment 2 = maintenance X2; Treatment 3 = maintenance X3
Treatment 1= maintenance X1; Treatment 2 = maintenance X2; Treatment 3 = maintenance X3
Means without superscripts did not differ (P>0.05).
Treatment 1= maintenance X1; Treatment 2= maintenance X2; Treatment 3= maintenance X3
Serum total protein
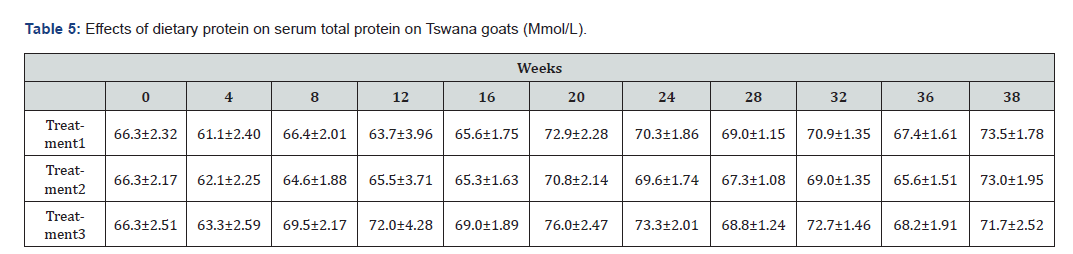
The effects of dietary crude protein level on serum total protein concentrations of Tswana goats are presented in Table 5. No significant differences were detected among treatments at any sampling week (P > 0.05), although total protein increased numerically from Week 0 to Week 38 in all treatments. Treatment 3 had the highest numerical values at most time points, peaking at 76.0 ± 2.47 g/L at Week 20, coinciding with parturition. Treatment 1 and Treatment 2 peaked at 72.9 ± 2.28 and 70.8 ± 2.14 g/L respectively, also at Week 20. Total protein concentrations ranged from 61.1 to 76.0 g/L across the trial, remaining within the normal physiological range for goats.
Serum globulin
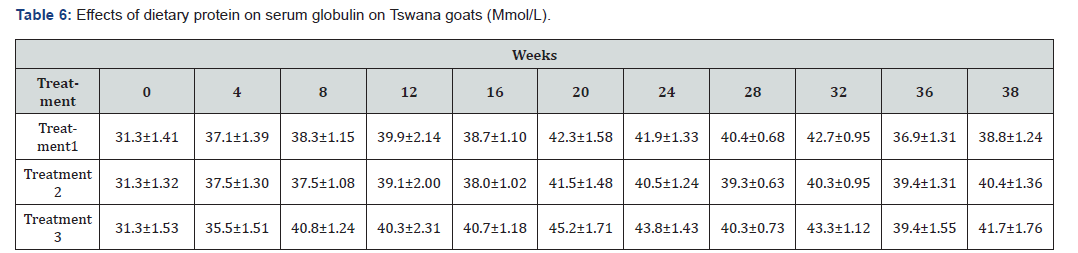
The effects of dietary crude protein level on serum globulin concentrations of Tswana goats are presented in Table 6. No significant differences were observed among treatments at any sampling week (P > 0.05). Globulin concentrations increased gradually from Week 0 to Week 20 in all treatments, with Treatment 3 reaching the highest numerical value of 45.2 ± 1.71 g/L at Week 20, coinciding with parturition. After Week 20, globulin concentrations declined slightly and stabilised. Values ranged from 31.3 to 45.2 g/L across the trial, which is within the normal physiological range for goats.
Serum lipase
The effects of dietary crude protein level on serum lipase activity of Tswana goats are presented in Table 7. No significant differences were detected among treatments at any sampling week (P > 0.05). Lipase activity was highest at Week 12 for all treatments, with values of 278.4 ± 48.3, 279.4 ± 45.2, and 289.4 ± 52.2 U/L for Treatments 1, 2, and 3 respectively. Activity declined after Week 12, reaching the lowest values at Week 24 (183.1 ± 16.1, 199.9 ± 15.0, and 199.9 ± 17.4 U/L). Lipase activity subsequently increased and remained stable from Week 28 to Week 38. Values ranged from 183.1 to 289.4 U/L across the trial.
Serum triglycerides
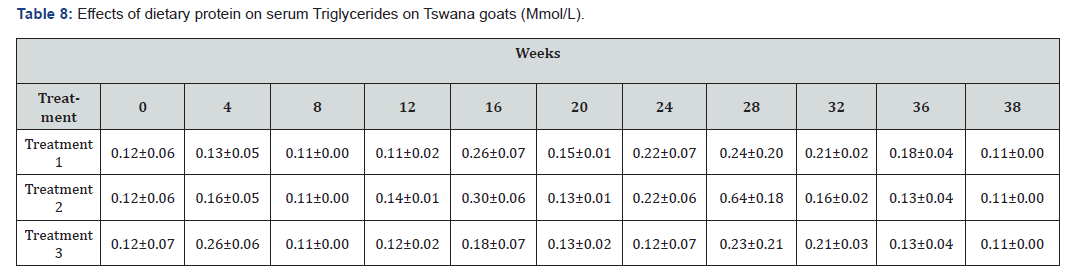
The effects of dietary crude protein level on serum triglyceride concentrations of Tswana goats are presented in Table 8. No significant differences were observed among treatments at any sampling week (P > 0.05). Triglyceride concentrations were low throughout the trial, ranging from 0.11 to 0.64 mmol/L. A numerical peak was observed at Week 28 for Treatment 2 (0.64 ± 0.18 mmol/L) and at Week 16 for Treatment 2 (0.30 ± 0.06 mmol/L). All treatments showed the lowest triglyceride concentrations at Week 38 (0.11 ± 0.00 mmol/L). Concentrations remained within the normal physiological range for goats throughout the study.
Serum cholesterol
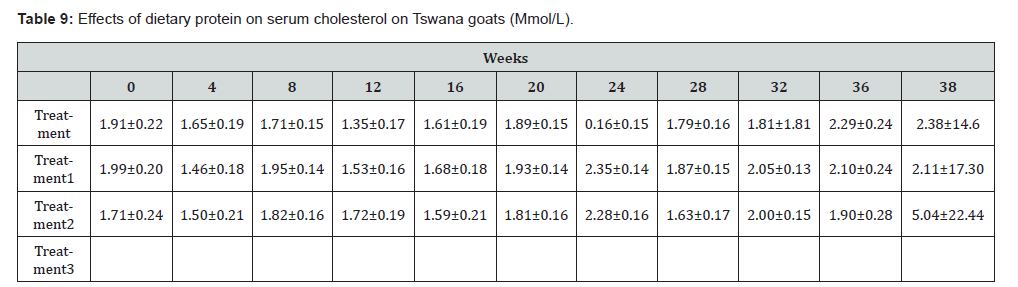
The effects of dietary crude protein level on serum cholesterol concentrations of Tswana goats are presented in Table 9. No significant differences were detected among treatments at any sampling week (P > 0.05). Cholesterol concentrations remained relatively stable from Week 0 to Week 16, then declined at Week 20, coinciding with parturition. Values increased post-partum and remained stable from Week 24 to Week 38. Concentrations ranged from approximately 1.8 to 2.4 mmol/L across the trial, which is within the normal physiological range for goats.
Serum triglycerides
The effects of dietary crude protein level on serum triglyceride concentrations of Tswana goats are presented in Table 8. No significant differences were observed among treatments at any sampling week (P > 0.05). Triglyceride concentrations were low throughout the trial, ranging from 0.11 to 0.64 mmol/L. A numerical peak was observed at Week 28 for Treatment 2 (0.64 ± 0.18 mmol/L) and at Week 16 for Treatment 2 (0.30 ± 0.06 mmol/L). All treatments showed the lowest triglyceride concentrations at Week 38 (0.11 ± 0.00 mmol/L). Concentrations remained within the normal physiological range for goats throughout the study.
Discussion
The most significant finding was the severe periparturient hypoglycemia in does fed 200% CP. Serum glucose declined to 1.93 ± 0.21 mmol/L in Treatment 3 at Week 20 (Table 1), coinciding with parturition of twins. This value is below the reference range of 2.8–4.2 mmol/L and indicates clinical negative energy balance. The glucose nadir occurred despite high dietary CP, suggesting energy, not protein, was the first-limiting nutrient for twinbearing does. Serum urea concentrations increased linearly with dietary CP, with Treatment 3 reaching 13.0 ± 1.39 mmol/L at Week 38 (Table 2; P < 0.05). This exceeds the reference range of 2.8–7.1 mmol/L and reflects deamination of excess dietary amino acids. The absence of concurrent increases in total protein, albumin, or globulin (Tables 4–6; P > 0.05) confirms that nitrogen above 150% of maintenance was excreted rather than retained.
No treatment effects were observed for total protein, albumin, globulin, A:G ratio, lipase, triglycerides, or cholesterol (Tables 3–9; P > 0.05). The stability of these metabolites indicates that dietary CP up to 200% of maintenance did not compromise hepatic function, lipid metabolism, or immune status. The lack of compensatory hypertriglyceridemia during the glucose nadir at Week 20 suggests lipolysis was insufficient to meet energy demands of twin-bearing does. These results demonstrate that increasing CP to 200% of maintenance does not prevent periparturient energy deficits in Tswana does. For does bearing multiple fetuses under semi-arid conditions, dietary energy density should be prioritized over protein concentration in late gestation diets. These results demonstrate that increasing CP to 200% of maintenance does not prevent periparturient energy deficits in Tswana does. For does bearing multiple fetuses under semi-arid conditions, dietary energy density should be prioritized over protein concentration in late gestation diets.
Conclusion
Increasing dietary crude protein from 100% to 200% of maintenance requirements in Tswana goats increased serum urea concentrations but did not alter total protein, albumin, globulin, or lipid metabolites. Severe periparturient hypoglycemia occurred in does feed 200% CP that bore twins. The results indicate that protein supply above maintenance does not alleviate periparturient negative energy balance and that dietary energy is the primary limiting factor for twin-bearing Tswana does. Feeding CP at 150% of maintenance appears sufficient for maintaining blood protein status without excessive nitrogen excretion.
Acknowledgements
The author thanks all who participated in the study, Animal Health Department staff from North West University. The communal farmers of three villages, Ramatlabama, Tsetse and Lokaleng around Mafikeng are also acknowledged.
References
- Brown D, Ngambi JW, Norris D (2016) Feed potential of acacia karroo leaf meal for communal goat production in Southern Africa. Journal of Animal and Plant Science 26(4): 1178-1186.
- Khan SA, Epstein JH, Olival KJ, Hassan MM, Hossain MB (2011) Hematology and serum chemistry reference values of stray dogs in Bangladesh. Open Veterinary Journal 1: 13-20.
- Zulkifli I, Norbaiyah B, Cheah YW, Soleimani AF, Sazili AQ, et al. (2010) Physiological responses in goats subjected to road transportation under the hot, humid tropical conditions. Introduction to Journal of Agricultural Biology (12): 840-844.
- Motubatse MR, Ngambi JW, Norris D, Malatje MM (2008) Effect of polyethylene glycol 4000 supplementation on the performance of indigenous Pedi goats fed different levels of Acacia nilotica leaf meal and ad libitum Buffalo grass hay. Tropical Animal Health Production 40: 229-238.
- Gupta NS, Briggs DEG, Collinson ME, Evershed RP, Michels R, et al. (2007) Evidence for thein situ polymerization of labile aliphatic organic compounds during the preservation of fossil leaves: Implications for organic matter preservation. Organic Geochemistry 38: 28-36.
- Madan J, Sindhu S, Gupta M, Kumar S (2016) Hematobiochemical profile and mineral status in growing beetle goat kids. Journal of. Cell Tissue Research 16: 5517-5522.
- Sharma AK, Kataria N (2012) Influence of season on some serum metabolites of Marwari goats. Indian Journal of Small Ruminants 18: 52-55.
- Shah K, Khan F, Rizvi M, Sadeeq U (2007) Effect of cypermethrin on clinico-Haematological parameters in rabbits. Pakistan Veterinary Journal 27: 171-175.
- Piccione G, Borruso M, Fazio F, Giannetto C, Caola G (2007) Physiological parameters in lambs during the first 30 days postpartum. Small Ruminant Research 72: 57-60.
- Piccione G, Messina V, Vazzana I, Dara S, Giannetto C (2012) Seasonal variations of some serum electrolyte concentrations in sheep and goats. Comprehensive Clinical Pathology 21: 911-915.
- Department of Agricultural Forestry & Fishers (2012) Constraints to small- scale goat production in the highland Sourveld area of Kwazulu- Natal. Journal of Agriculture and Biodiversity Research 1: 50-64.
- IDEXX Laboratories Inc (2010) Available at www.idexx.co.
- Piccione G, Messina V, Schembari A, Casella S, Giannetto C (2011) Pattern of serum protein fractions in dairy cows during different stages of gestation and lactation. Journal of Dairy Research 4: 421-425.

























