Impact of Changing Climactic Conditions on Bulk Tank Milk Fatty Acid Production and its Relationship with Milk Composition
SC Allen and SH Ward*
*Department of Animal Science, North Carolina State University, USA
Submission: September 23, 2022; Published: November 22, 2022
*Corresponding author: SH Ward, Department of Animal Science, North Carolina State University, Raleigh 27607, USA
How to cite this article: SC Allen and SH Ward. Impact of Changing Climactic Conditions on Bulk Tank Milk Fatty Acid Production and its Relationship with Milk Composition. Dairy and Vet Sci J. 2022; 15(3): 555911.DOI: 10.19080/JDVS.2022.15.555911
Abstract
Recent advancements in the analysis of fatty acid groups using NIR technology developed revealed correlations between de novo fatty acids (FA) and total milk fat and protein production, however this work focused on northeastern U. S. Holstein herds. The objectives of this project were to evaluate the impacts of management practices, environmental conditions and breed on milk FA composition in the Southeast. Ten herds (6 Jersey, JE, 3 Holstein, HO, 1 mixed) were sampled weekly for milk FA (de novo, DNFA; mixed origin, MOFA; and preformed, PRFA). A positive relationship was observed between milk fat%, protein% and DNFA in JE herds (r = 0.7473 and 0.6474, R2 = 0.5571 and 0.6474, P < 0.0001). Herd management assessments were conducted quarterly, and temperature humidity index (THI) was collected throughout the study. Data were analyzed using PROC CORR and REG of SAS Fatty acid content was not affected by herd management factors assessed. HO herds produced less milk during elevated average THI while JE herds produced more milk. Milk fat and protein were greater in low minimum THI for both breeds. De novo FA was greater during low minimum THI. This indicates that milk FA, particularly DNFA, could be used as predictors of disorders or stressors to the cow.
Keywords: Herd management, de novo fatty acids, Milk fat, Temperature humidity index
Introduction
Milk fatty acids (FA) can originate from two sources: preformed FA (PRFA; C18 and greater) or de novo FA (DNFA; C4 through C14). Preformed fatty acids originate from FA reserves and dietary FA that have undergone rumen modification. These FA enter the bloodstream and are utilized by the mammary gland in their preformed state. De novo FA are synthesized in the mammary cells from acetate and butyrate, two volatile fatty acids produced through ruminal fermentation. Milk FA that can originate from both sources are considered mixed origin (MOFA; C16:0, C16:1, C17:0).
De novo FA typically contributes 18 to 28% of total FA content in high producing Holstein herds [1], but fatty acid content can vary based on stage of lactation, breed, and genetics [2,3] as well as feed and other management practices [4-6]. For example, elevated stocking density and a lesser feeding frequency was related to a lower DNFA content, and herds with a lower DNFA content were reported to produce less milk, fat, and protein compared to higher DNFA herds [7]. With this relationship, measures like DNFA could be used to identify inefficiencies in the herd and stabilize or even increase milk production.
The southeastern U.S. is challenged with long periods of warm temperatures and high relative humidity, which is known to contribute to reduced milk yields. When discussing environmental stressors, temperature humidity index (THI) is often used as it incorporates the combined effects of temperature and relative humidity [8]. Periods of heat stress have been shown to reduce DMI [9-12] and milk yield [11-13]. Additionally, elevated THI was reported to reduce milk fat and protein percent [11,14] and alter the fatty acid composition [15]. An overall decrease in DNFA and increase in PRFA was observed during periods of heat stress [15]. The objective of this study was to evaluate the relationship between milk FA content and milk composition in SE dairy herds during times of heat stress. We hypothesized that mixed origin and de novo FA would be more positively related to milk fat and protein production than preformed FA, and that heat stress would reduce DNFA content.
Materials and Methods
Nine North Carolina dairy farms (average herd size = 200, range =117 to 1200 cows) voluntarily enrolled in the study. The study was conducted from March 2018 through September 2019. The herds enrolled consisted of 5 Jersey, 3 Holstein, and 1 mixed herd of both Jersey and Holstein breeds (the latter was included in the Holstein breed analysis because it was the dominant breed on the farm). Herds used in this study represented a various housing type from predominantly grazing to predominantly housed in freestalls. Four of the nine farms allowed access to grass, but all of the herds fed a total mixed ration (TMR) as their primary feed source (Table 1).

1Herd contained a mixture of Jersey and Holstein cows.
Herds were classified as high de novo (≥ 23.99 and 25.45 g/100 g FA) or low de novo (< 23.99 and 25.45 g/100 g FA), high mixed origin (≥ 37.04 and 38.82 g/100 g FA) or low mixed origin (< 37.04 ± 2.466 and 38.82g/100 g FA), and high preformed (≥ 38.95 and 35.40 g/100 g FA) or low preformed (< 38.95 and 35.40 g/100 g FA for Holstein and Jersey herds, respectively). Classification was determined by using the median of each variable across the collection period. Herds assessments and classifications were performed each season: spring 2018 (March 2018 to May 2018), summer 2018 (June 2018 to August 2018), fall 2018 (September 2018 to November 2018), winter 2018 (December 2018 to February 2019), spring 2019 (March 2019 to May 2019), and summer 2019 (June 2019 to August 2019).
Frequency of fresh feed delivered, and feed push up was recorded. Samples of the TMR offered were taken during visits and later analyzed for nutrient composition. Of the herds enrolled, only two (1 Jersey, 1 Holstein) fed multiple rations. For those herds, the mid-lactation diet was used for analysis. Feed samples were subjected to proximate analysis to determine nutrient composition. Feed samples were frozen after collection until analyzed.
Farms were evaluated for bunk space (linear feed bunk space per cow in the pen), stocking density (number of cows per freestall in the pen), grouping strategy, and cooling strategy (fans over feed bunk, holding pen, and freestalls). Average herd DIM was collected from the nearest test day to the sample collection (United Federation of DHI, Hillsville, VA).
A random subsection of 30% of the herd was assessed for body condition and lameness during each herd assessment. For herds with multiple pens, 30% of each pen was assessed to ensure a representative selection of animals. Body condition was measured in 0.25-unit increments on a 1 to 5 scale [16]. Locomotion was measured in 1.0-unit increments on a 1 to 5 scale [17]. Locomotion score (LS) was assigned to three categories: no lameness (NLS; LS = 1), moderate lameness (MLS; LS = 2 through 4), and severe lameness (SLS; LS = 5). Average body condition score (BCS) was evaluated for each herd at assessment. Locomotion score was evaluated using average LS, as well as percentage of herd within each category.
Milk Sample Collection and Analysis
Milk samples were collected from the bulk tank of enrolled herds. Samples were taken during each milk tank collection for 7 consecutive milk pickups. A total of 381 Jersey and 284 Holstein bulk tank samples were analyzed and utilized in this analysis. Samples were preserved after collection using Broad Spectrum Microtabs (Advanced Instruments Inc., Norwood, MA), refrigerated, and collected at the end of the monthly collection period.
Milk was analyzed for milk fat, protein, and lactose content using a Fourier transform mid-infrared (FTIR) spectrophotometer (Lactoscope FTA, Delta Instruments, Drachten, the Netherlands). Machine calibration was performed using mean reference chemistry values for fat, protein, and lactose [18]. Reference values were produced monthly by a network of 10 to 12 laboratories [19]. Methods used to determine reference values were performed in duplicate in each laboratory using the following methods: modified Mojonnier ether extract (method 989.05), Kjeldhal analysis (method 991.22), and enzymatic analysis of lactose (method 2006.06). Slopes and intercepts were checked and adjusted monthly. Milk FA analysis was performed with FTIR using a Delta Instruments FTA (Delta Instruments) simultaneously with component analysis using the methods described by Woolpert et al. [6].
The number of cows in milk and bulk tank milk volume shipped on the sample day was used to calculate average milk yield per cow (kg/d). In the case of milk pickup intervals greater than 24 h, a 24 h milk yield was calculated for each sample day. Production variables were averaged seasonally for analysis of herd fatty acid classification.
Feed Sample Collection and Analysis
Particle size distribution was determined using a Penn State Particle Separator. This was used to determine physically effective neutral detergent fiber (peNDF) content of the ration. Feed samples were placed in an oven at 65 °C until dry to determine air dry matter (DM). Samples were then ground through a 1 mm screen in a Thomas Wiley mill (Thomas Wiley mill, model 4, Thomas Scientific, Swedesboro, NJ) and stored at room temperature. All feed samples were subjected to proximate analysis for absolute dry matter (method 934.01), ash (method 942.05), neutral detergent fiber (method 973.18), acid detergent fiber (ADF; method 2002.04), and crude protein (CP; method 990.03; AOAC) [20], and ether extract (EE, method Am 5-04; AOCS) [21]. Organic matter was determined by subtracting ash from total DM.
Collection of Climatic Data
Climatic data was collected using the National Oceanic and Atmospheric Administration Local Climatological Data [22]. Data were collected using the weather station closest to the farm location. Average, Maximum, and Minimum dry bulb temperature (T°C) and relative humidity (RH) were collected on an hourly basis throughout the study. Hourly data was then averaged by day and used to calculate daily average, maximum, and minimum THI using the following equation [23]:
THI= (1.8*T°C +32)- (0.55-0.0055*RH) * (1.8*T°C-26)
A 3-d average, including the sample day and two days prior to sample, were classified as low (THI < 62), medium (62 ≥ THI < 72), or high (THI ≥ 72) and used for this analysis.
Statistical Analysis
Relationship between milk components and milk FA composition were analyzed using PROC CORR and PROC REG by breed in SAS (version 9.4, SAS Institute Inc., Cary, NY). All other data were analyzed using the GLIMMIX procedure in SAS (version 9.4, SAS Institute Inc., Cary, NY). In analysis of impact of herd classification on fatty acids, herd classification was considered the independent variable. Nutrient composition, production parameters, milk fatty acid composition, and herd management parameters were considered dependent variables. In analysis of impact of THI, THI classification (high, med, low) was considered the independent variable. Production parameters and milk fatty acid composition were considered dependent variables. To analyze impact of season, season of study was considered the independent variable. Milk fatty acid content, ratio of milk fatty acids, and THI were considered dependent variables. Means were separated using Fisher’s Least Significant Difference, and significance was declared when P < 0.05 (Fisher’s Least Significant Difference). Trends were discussed when P ≤ 0.10. All data were presented as mean ± the largest standard error of the mean (SEM).
Results
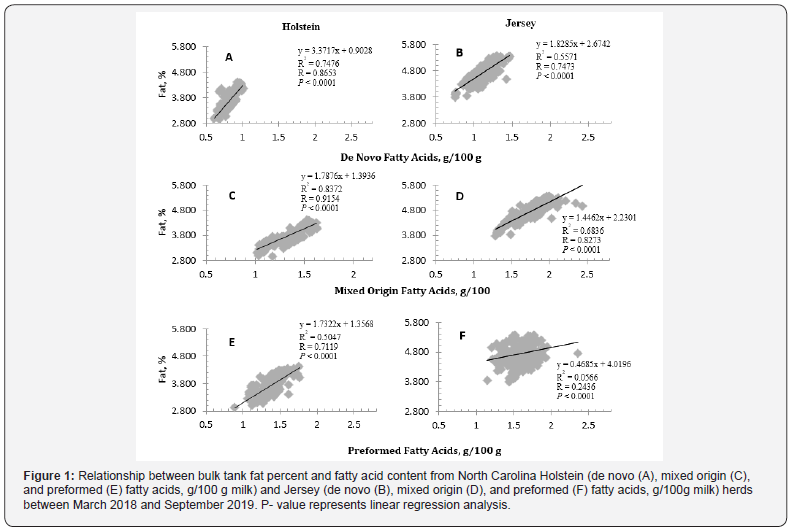
A strong positive correlation was observed between DNFA and milk fat content for Holstein herds (r = 0.7473 and 0.8653 for Jersey and Holstein, respectively; P < 0.001; Figure 1). An R2 of 0.5571 and 0.7477 was observed for Jersey and Holstein herds, respectively (P < 0.001). Similarly, a strong positive correlation was observed between DNFA and milk fat content for both Jersey and Holstein herds (r = 0.8273 and 0.9154 for Jersey and Holstein, respectively; P < 0.001). An R2 of 0.6474 and 0.7433 was observed for Jersey and Holstein herds, respectively (P < 0.001). However, the relationship between PRFA and milk fat content was largely different between the breeds. A strong positive correlation was observed in Holstein herds (r = 0.7119, P < 0.001), however, the relationship was still positive but much weaker in Jersey herds (r = 0.2436, P < 0.001). Although a strong positive correlation was observed between the variables in Holstein herds, an R2 of 0.2215 and 0.1269 was observed for Jersey and Holstein herds, respectively (P < 0.001).
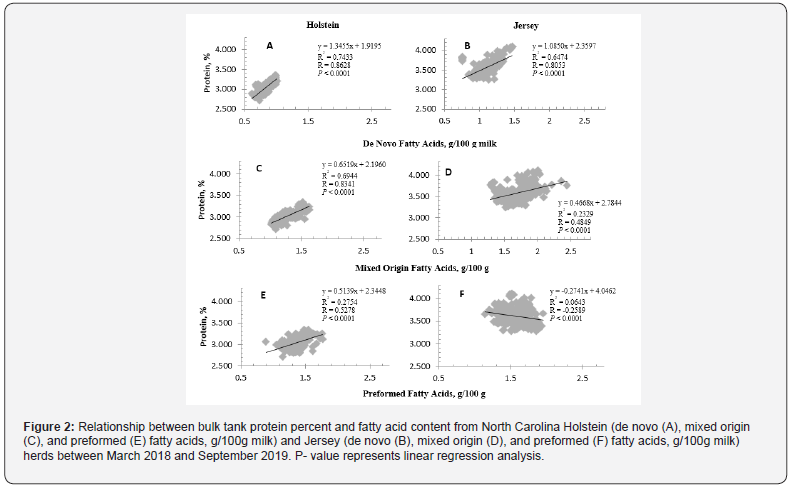
A strong positive correlation was observed between DNFA and milk protein content for both Jersey and Holstein herds (r = 0.8053 and 0.8628 for Jersey and Holstein, respectively; P < 0.001; Figure 2). An R2 of 0.6474 and 0.7433 was observed for Jersey and Holstein herds, respectively (P < 0.001). A positive correlation was observed between MOFA and milk protein content among both breeds, however the relationship was stronger in Holstein herds (r = 0.4849 and 0.8341 for Jersey and Holstein, respectively; P < 0.001). Although protein was positively correlated with MOFA in both breeds, an R2 of 0.2329 and 0.6944 was observed for Jersey and Holstein herds, respectively (P < 0.001). A positive correlation was observed between protein and PRFA in Holstein herds, however it is remarkably smaller than with other FA groups (r = 0.5277, P < 0.001). In contrast, Jersey herds exhibited a negative between PRFA and milk protein content (r = -0.2589, P < 0.001). An R2 of 0.0670 and 0.2754 was observed for Jersey and Holstein herds, respectively (P < 0.001).
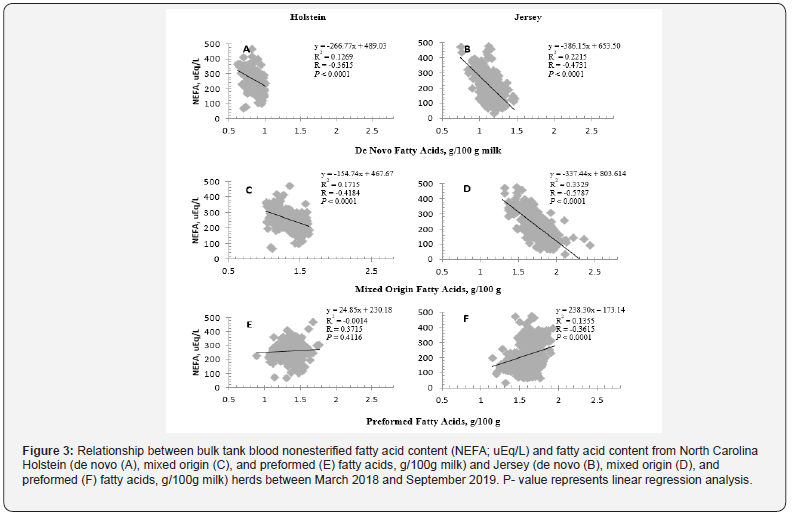
Both Jersey and Holstein herds exhibited a negative correlation between DNFA and NEFA (r = -0.4731; R2= 0.2215 and r = -0.3615; R2= 0.1269 for Jersey and Holstein, respectively; P < 0.001; Figure 3). Similarly, MOFA was negatively correlated to NEFA in both breeds (r = -0.5787 and -0.4184 for Jersey and Holstein, respectively; P < 0.001). No relationship was observed between NEFA and PRFA in Holstein herds (r = 0.0539, P = 0.4116), however NEFA was positively correlated with PRFA in Jersey herds (r = 0.3715, P < 0.001).
Holstein herds
Average milk yield was unaffected by herd classification (high, medium, or low de novo, mixed, or preformed FA; P > 0.05; Table 2). Bulk tank fat, protein, and lactose percent were not impacted by DNFA or PRFA classification (P > 0.05). However, Holstein herds classified as high mixed origin produced milk containing more milk fat, more lactose, and had a tendency for increased protein percent than those classified as low mixed origin (Table 2). Similarly, DNFA and PRFA classification did not impact protein content of bulk tank samples, however high mixed origin herds had a tendency for increased protein content (3.12 v. 2.98 ± 0.052 %). Herd classification did not impact component yields (P > 0.05).
Herd classification did not impact average de novo and preformed fatty acid content (g/100 g milk, P > 0.05). However, low de novo herds tended to have a greater content of MOFA compared to high de novo herds (P = 0.059). Additionally, high mixed origin and low preformed herds had a greater content of MOFA compared to low mixed origin (P < 0.001) and high preformed (P = 0.007) herds respectively. Bulk tank β-hydroxybutyrate and acetone content were unaffected herd classification. Bulk tank nonesterified fatty acid content (NEFA) was unaffected by PRFA classification, however NEFA content was reduced in high mixed origin herds and tended to be reduced in high de novo herds compared to low mixed origin and de novo herds (Table 2).
Jersey herds
Average milk yield was unaffected by herd classification (P > 0.05; Table 2). Jersey bulk tank fat percent was unaffected by herd classification. Bulk tank protein percent was unaffected by MOFA and PRFA classification but tended to be elevated in high de novo herds compared to low de novo herds (3.66 v. 3.50 ± 0.054%; P = 0.059). Bulk tank lactose percent was not impacted by PRFA classification. Herd classification did not impact component yields (P > 0.05). There was a tendency for high de novo herds to yield more fat (P = 0.089) and protein (P = 0.080) compared to low de novo herds. Lactose was unaffected by herd classification, and MOFA and PRFA classification did not impact fat and protein yield (P > 0.05). Herds classified as high de novo and low preformed had more DNFA content compared to low de novo and high preformed herds (1.17 and 1.16 v. 1.06 and 1.07 ± 0.025 g/100 g milk, P = 0.006 and 0.038, respectively). Mixed origin classification did not impact DNFA content. Mixed origin FA content was not affected by DNFA or MOFA classification but was greater in low preformed compared to high preformed herds (1.82 v. 1.66 ± 0.047 g/100 g milk, P = 0.041). Preformed FA content was greater in low de novo compared to high de novo herds (1.57 v. 1.61 ± 0.043 g/100 g milk, P = 0.043). Average preformed FA content tended to be greater in low mixed origin herds but was unaffected by PRFA classification. Jersey herd classification did not impact β-hydroxybutyrate, NEFA, and acetone content.
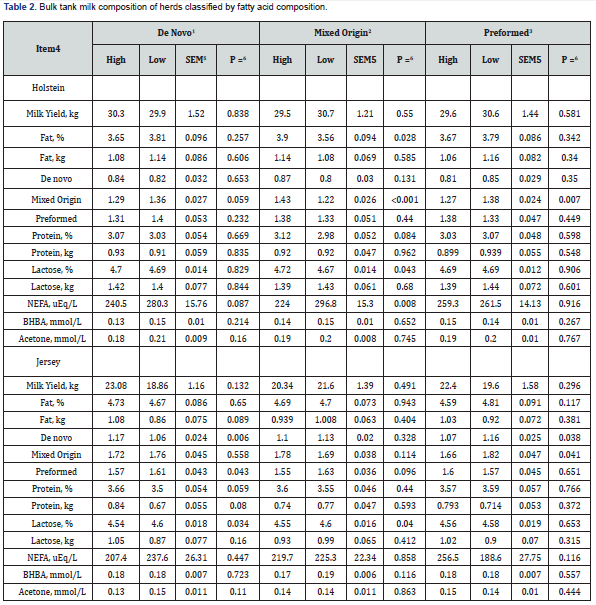
1Herds were classified as high de novo (≥ 23.99 ± 1.201 and 25.45 ± 1.858) or low de novo (< 23.99 ± 1.201 and 25.45 ± 1.858) for Jersey and Holstein herds, respectively.
2Herds were classified as high mixed origin (≥ 37.04 ± 2.466 and 38.82 ± 2.217) or low mixed origin (< 37.04 ± .466 and 38.82 ± 2.217) for Jersey and Holstein herds, respectively.
3Herds were classified as high preformed (≥ 38.95 ± 2.772 and 35.40 ± 3.192) or low preformed (< 38.95 ± 2.772 and 35.40 ± 3.192) for Jersey and Holstein herds, respectively.
4 De novo, mixed origin, and preformed fatty acids are expressed as g/100 g milk; NEFA = nonesterified fatty acids, BHBA = β-hydroxybutyrate
5Greatest standard error of treatment mean
6Main effect of treatment
Relationship of management practices to fatty acid content
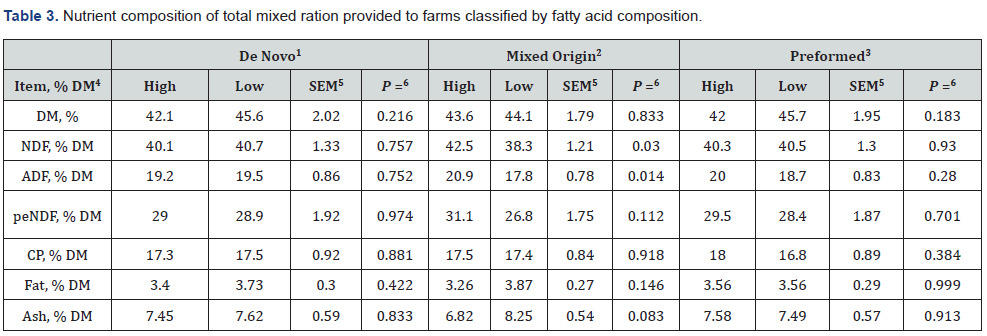
No differences were noted between DNFA and PRFA classification and nutrient composition of herd total mixed ration across all herds (TMR; Table 3). Effective fiber (peNDF), protein, or fat content was not different according to Mixed origin FA classification. Herds classified as high mixed origin were fed diets containing more NDF, ADF, and tended to have less ash than low mixed origin herds. Dietary NDF averaged 42.5 and 38.3 ± 1.21% (P = 0.030) for high mixed origin and low mixed origin herds, respectively. Dietary ADF averaged 20.9 and 17.8 ± 0.78% (P = 0.014) for high mixed origin and low mixed origin herds, respectively. Dietary ash averaged 6.82 and 8.25 ± 0.54% (P = 0.083) for high mixed origin and low mixed origin herds, respectively. Average herd DIM, body condition, locomotion score, and stocking density was unaffected by herd FA classification (Table 4). Percent incidence of locomotion score category was not affected by herd FA classification.
1Herds were classified as high de novo (≥ 23.99 ± 1.201 and 25.45 ± 1.858) or low de novo (< 23.99 ± 1.201 and 25.45 ± 1.858) for Jersey and Holstein herds, respectively.
2 Herds were classified as high mixed origin (≥ 37.04 ± 2.466 and 38.82 ± 2.217) or low mixed origin (< 37.04 ± 2.466 and 38.82 ± 2.217) for Jersey and Holstein herds, respectively.
3Herds were classified as high preformed (≥ 38.95 ± 2.772 and 35.40 ± 3.192) or low preformed (< 38.95 ± 2.772 and 35.40 ± 3.192) for Jersey and Holstein herds, respectively.
4 NDF = neutral detergent fiber, ADF = acid detergent fiber, peNDF = Physically effective NDF, CP = crude protein
5Greatest standard error of treatment mean
6Main effect of treatment

1Herds were classified as high de novo (≥ 23.99 ± 1.201 and 25.45 ± 1.858) or low de novo (< 23.99 ± 1.201 and 25.45 ± 1.858) for Jersey and Holstein herds, respectively.
2 Herds were classified as high mixed origin (≥ 37.04±2.466 and 38.82±2.217) or low mixed origin (< 37.04 ± 2.466 and 38.82 ± 2.217) for Jersey and Holstein herds, respectively.
3Herds were classified as high preformed (≥ 38.95 ± 2.772 and 35.40 ± 3.192) or low preformed (< 38.95 ± 2.772 and 35.40 ± 3.192) for Jersey and Holstein herds, respectively.
4DIM = days in milk; Body Condition (1 = thin, 5 = obese); Locomotion (1 = no lameness, 5 = severe lameness); Stocking rate = cow/stall
5Greatest standard error of treatment mean
6Main effect of treatment
Impact of Temperature Humidity Index on Production
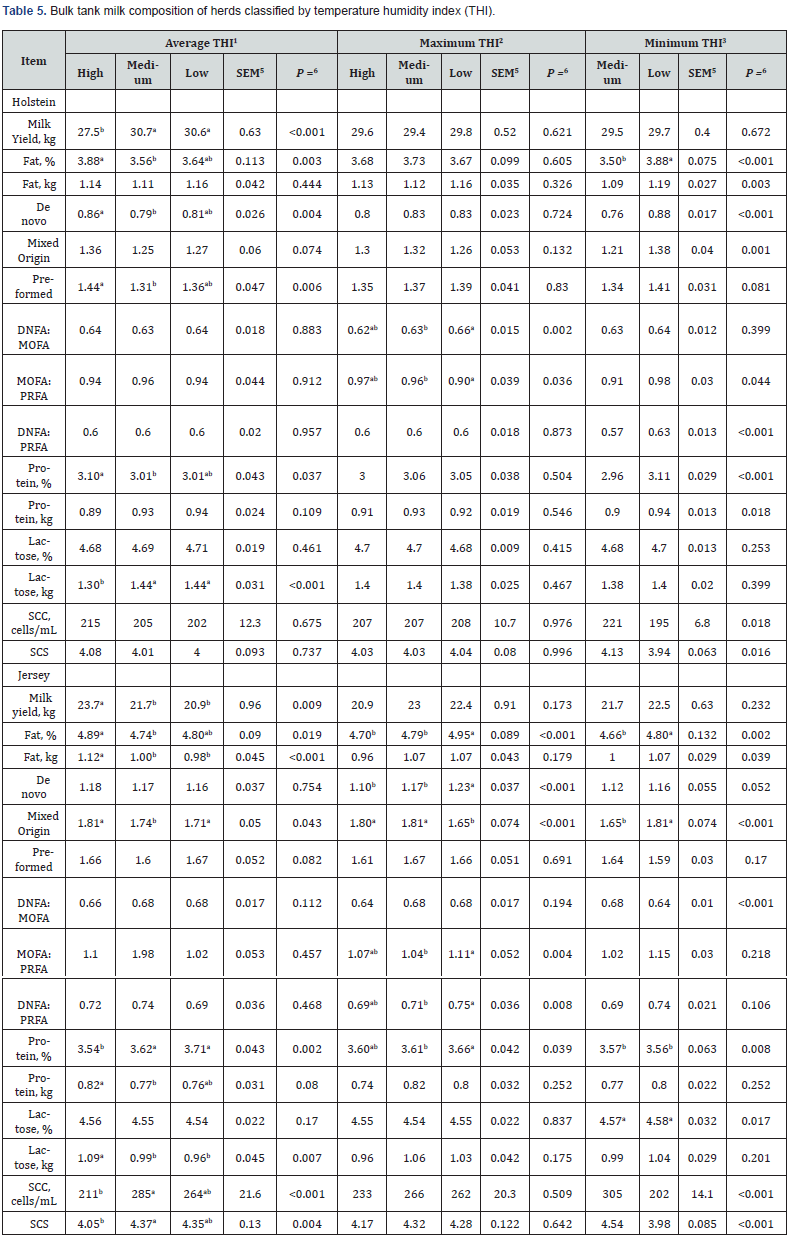
1Average THI = average dry bulb temperature (°C) (1 – average relative humidity) (average dry bulb temperature – 58). THI was classified as high (THI < 62), medium (62≥THI < 72), and high (THI ≥ 72). Temperature data was collected relative to each herd used in analysis.
2Maximum THI = maximum dry bulb temperature (°C) (1 – maximum relative humidity) (maximum dry bulb temperature – 58). THI was classified as high (THI < 62), medium (62 ≥ THI < 72), and high (THI ≥ 72). Temperature data was collected relative to each herd used in analysis.
3Minimum THI = minimum dry bulb temperature (°C) (1 – minimum relative humidity) (minimum dry bulb temperature – 58). THI was classified as low (THI < 62), medium (62 ≥ THI < 72), and high (THI ≥ 72). Temperature data was collected relative to each herd used in analysis. High minimum THI is not provided as there were not enough days above the threshold to analyze the impact.
4De novo, mixed origin, and preformed fatty acids are expressed as g/100 g milk; SCC = somatic cell count; SCS = somatic cell score (LOG 2 (SCC x 103/100) + 3)
5Greatest standard error of treatment mean
6Main effect of treatment
Holstein herds. Impact of average, maximum, and minimum THI on production is summarized in Table 5. High THImin is not provided as there were not enough days above the threshold (72) to analyze the impact. Milk yield was unaffected by maximum and THImin, however, milk yield was reduced when during periods of high THIavg compared to medium and low THIavg (27.5 v. 30.7 and 30.6 ± 0.63 kg/d for high, medium, and low THIavg, respectively, P < 0.001). Percent fat and fat yield were unaffected by average and THImax but both elevated during periods of low THImin compared to medium THImin. Fat percent average 3.88 and 3.50 ± 0.075% (P < 0.001), and fat yield averaged 1.19 and 1.10 ± 0.027 kg/d (P = 0.003) for low and medium THImin, respectively. Protein percent was unaffected by THImax but was greater during high THIavg compared to medium THIavg, and low THIavg was intermediate. Protein percent averaged 3.10, 3.01, and 3.01 ± 0.043% for high, medium, and low THIavg, respectively (P = 0.037). Protein percent was also greater during periods of low THImin (3.11v. 2.96 ± 0.029, P < 0.001). Similarly, protein yield was greater during low THImin (0.94 v. 0.90 ± 0.013 kg/d, P = 0.018) but was unaffected by THIavg and THImax. Percent and yield of lactose was not affected by THI with the exception of lactose yield being greater during medium and low THIavg compared to high THIavg. Lactose yield averaged 1.30, 1.44, and 1.44 ± 0.031 kd/d for high, medium, and low THIavg, respectively (P < 0.001). Somatic cell count and SCS were unaffected by THIavg and THImax, however both were greater during medium THImin. Somatic cell count averaged 221 and 195 ± 6.8 cells/mL for medium and low THImin, respectively (P = 0.018). Somatic cell score averaged 4.13 and 3.94 ± 0.063 for medium and low THImin, respectively (P = 0.016).
De novo FA content was greater during periods of high THIavg compared to medium THIavg, and low THIavg was intermediate. De novo FA content averaged 0.84, 0.79, and 0.81 ± 0.026 g/100 g milk for high, medium, and low THIavg, respectively (P = 0.004). Maximum THI did not affect DNFA content, however DNFA was greater during periods of low THImin (0.88 v. 0.76 ± 0.017 g/100 g milk, P < 0.001). Mixed origin FA content tended to be greater during high THIavg (P = 0.074), was unaffected by THImax, and was greater during low THImin (1.38 v. 1.21 ± 0.017 g/100 g milk, P = 0.001). Preformed FA content was unaffected by THImax but was greater during low THImin (1.41 v. 1.34 ± 0.031 g/100 g milk, P = 0.008). Preformed FA content was also greater during high THIavg compared to medium THIavg, and low THIavg was intermediate. Preformed FA content averaged 1.44, 1.31, and 1.36 ± 0.047 g/100 g milk for high, medium, and low THIavg, respectively (P = 0.006).
Average THI did not affect FA ratios. However, milk from periods of low THImax had greater MOFA: PRFA and DNFA: MOFA compared to medium THImax, and high THImax was intermediate. Ratio of DNFA: MOFA averaged 0.62, 0.63, and 0.66 ± 0.015 for high, medium, and low THImax, respectively (P = 0.002). Ratio of MOFA: PRFA averaged 0.97, 0.96, and 0.90 ± 0.039 for high, medium, and low THImax, respectively (P = 0.036). Maximum THI did not affect DNFA: PRFA. Low THImin yielded greater MOFA: PRFA (0.98 v. 0.91 ± 0.030, P = 0.044) and DNFA: PRFA (0.63 v. 0.57 ± 0.030, P < 0.001) but did not affect DNFA: MOFA.
Jersey Herds
Impact of average, maximum, and minimum THI on production is summarized in Table 5. High THImin is not provided as there were not enough days above the threshold (72) to analyze the impact. Milk yield was unaffected by THImax and THImin but was greater in high THIavg compared to medium and low THIavg (23.7 v. 21.7 and 20.9 ± 0.96 kg/d, respectively, P = 0.009). Fat percent was greater during high THIavg compared to medium THIavg, and low THIavg was intermediate. Fat percent averaged 4.89, 4.74, and 4.80 ± 0.090 % for high, medium, and low THIavg, respectively (P = 0.019). Fat percent was greater during low THImax compared to high and medium THImax (4.95 v. 4.70 and 4.79 ± 0.089%, respectively, P < 0.001). Fat percent was greater during low THImin (4.80 v. 4.66 ± 0.132%, P = 0.002). Fat yield was greater in periods of high THIavg compared to medium and low THIavg (1.12 v. 1.00 ± 0.045 kg/d, respectively, P < 0.001) and was greater during low THImin (1.07 v. 1.00 ± 0.029 kg/d, P = 0.039) but was unaffected by THImax. Protein percent was greater during medium and low THIavg compared to high THIavg (3.62 and 3.71 v. 3.54 ± 0.043%, respectively, P = 0.002). Protein percent was also greater during periods of low THImax compared to medium THImax, and high THImax was intermediate. Protein percent averaged 3.60, 3.61, and 3.66 ± 0.036 % for high, medium, and low THIavg, respectively (P = 0.039). Protein percent ws greater during periods of high THImin (3.57 v. 3.56 ± 0.063, P = 0.008). Protein yield was unaffected by THImax and THImin but was greater during high THIavg compared to medium THIavg, and low THIavg was intermediate. Protein yield averaged 0.82, 0.77, and 0.76 ± 0.031 kg/d for high, medium, and low THIavg, respectively (P = 0.080). Lactose percent was unaffected by THIavg and THImax but was greater during periods of high THImin (4.58 v. 4.57 ± 0.032%, P = 0.017). Lactose yield was unaffected by THImax and THImin but was greater in high THIavg compared to medium and low THIavg (1.09 v. 0.99 and 0.96 ± 0.045 kg/d, P = 0.007). Somatic cell count was unaffected by THImax but was greater during high THImin (305 v. 202 ± 14.1 cells/mL, P < 0.001). Somatic cell count was also greater during periods of medium THIavg compared to high THIavg, and low THI avg was intermediate. Somatic cell count averaged 211, 285, and 264 ± 21.6 cells/mL for high, medium, and low THIavg, respectively (P < 0.001). Similarly, SCS was unaffected by THImax but was greater during medium THImin (4.54 v. 3.98 ± 0.085, P < 0.001). Somatic cell score was also greater during periods of medium THIavg compared to high THIavg, and low THI avg was intermediate. Somatic cell score averaged 4.05, 4.37, and 4.35 ± 0.130 for high, medium, and low THIavg, respectively (P = 0.004).
De novo FA content was unaffected by THIavg but was greater during periods of low THImax compared to high and medium THImax (1.23 v. 1.10 and 1.17 ± 0.037 g/100 g milk, respectively, P < 0.001) and tended to be greater during low THImin. Mixed origin FA content was greater during high and low THIavg compared to medium THIavg (1.81 and 1.71 v. 1.74 ± 0.050 g/100 g milk, respectively, P = 0.043). Mixed origin FA content was also greater during during high and low THImax compared to medium THIavg (1.80 and 1.81 v. 1.65 ± 0.074 g/100 g milk, respectively, P < 0.001) and was greater in low THImin (1.81 v. 1.65 ± 0.074 g/100 g milk, respectively, P < 0.001). There was a tendency for elevated PRFA content during high THIavg, but PRFA was otherwise unaffected by THI.
Average THI did not affect FA ratios. However, milk from periods of low THImax had greater MOFA: PRFA and DNFA: PRFA compared to medium THImax, and high THImax was intermediate. Ratio of MOFA: PRFA averaged 1.07, 1.04, AND 1.11 ± 0.052 for high, medium, and low THImax, respectively (P = 0.004). Ratio of DNFA: PRFA averaged 0.69, 0.71, and 0.75 ± 0.036 for high, medium, and low THImax, respectively (P = 0.008). Maximum THI did not affect DNFA: MOFA. Milk from periods of high THImin was greater in DNFA: PRFA (0.68 v. 0.64 ± 0.010, P < 0.001). Minimum THI did not affect MOFA: PRFA or DNFA: PRFA.
Changes in Temperature Humidity Index and Fatty Acid Content by Season
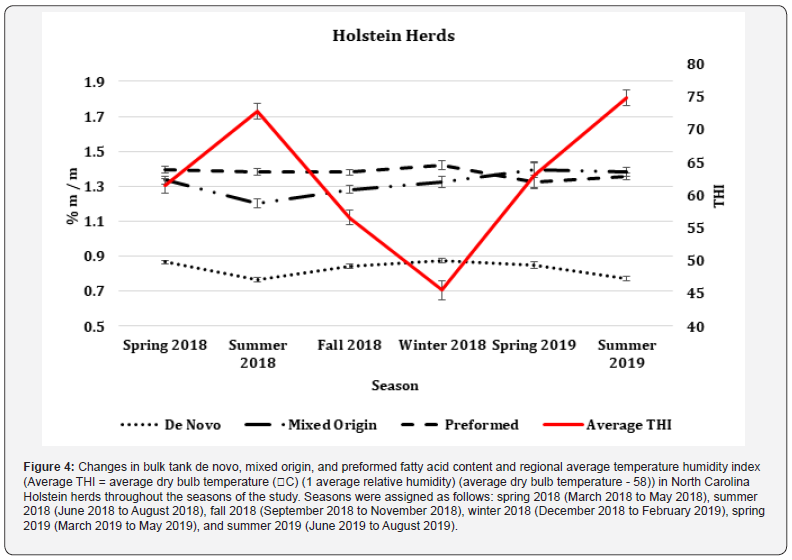
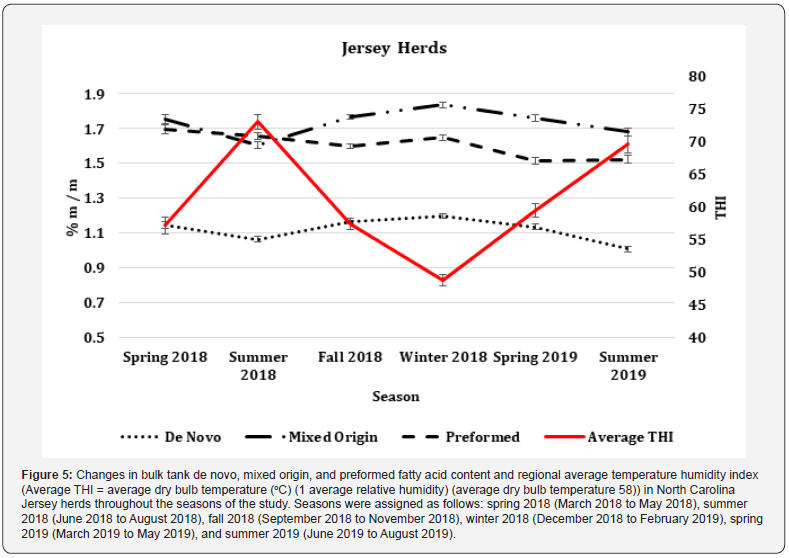
Temperature Humidity Index. In regions where Holstein herds were located, THIavg was greater during summer months (2018 and 2019), followed by spring months (2018 and 2019). Spring months had a greater THIavg than fall 2018, and winter 2018 had the lowest THIavg. Average THI averaged 61.4, 72.8, 56.5, 45.5, 63.0, and 74.9 ± 2.11 for spring 2018, summer 2018, fall 2018, winter 2018, spring 2019, and summer 2019 respectively (P < 0.001). In regions where Jersey herds were located, THIavg was greatest in summer 2018 followed by summer 2019. Summer 2019 was greater in THIavg than spring 2018, fall 2018, and spring 2019. Winter 2018 had the lowest THIavg. Average THI averaged 57.2, 73.1, 57.4, 48.1, 59.5, and 69.6 ± 1.36 for spring 2018, summer 2018, fall 2018, winter 2018, spring 2019, and summer 2019 respectively (P < 0.001).
In regions where Holstein herds were located, THImax followed the same pattern as THIavg. Maximum THI was greater during summer months (2018 and 2019), followed by spring months (2018 and 2019). Spring months had a greater THImax than fall 2018, and winter 2018 had the lowest THImax. Maximum THI averaged 71.6, 86.1, 65.2, 52.7, 75.1, and 87.6 ± 2.83 for spring 2018, summer 2018, fall 2018, winter 2018, spring 2019, and summer 2019 respectively (P < 0.001). In regions where Jersey herds were located, THImax was greatest in summer 2018 followed by summer 2019. Spring 2019 was greater in THImax than fall 2018, and spring 2018 was intermediate. Winter 2018 had the lowest THImax. Maximum THI averaged 67.1, 87.0, 66.0, 57.1, 70.7, and 82.2 ± 1.58 for spring 2018, summer 2018, fall 2018, winter 2018, spring 2019, and summer 2019 respectively (P < 0.001).
In regions where Holstein herds were located, THImin followed the same pattern as THIavg and THImax. Minimum THI was greater during summer months (2018 and 2019), followed by spring months (2018 and 2019). Spring months had a greater THImin than fall 2018, and winter 2018 had the lowest THImin. Minimum THI averaged 53.8, 64.4, 50.7, 41.1, 54.0, and 66.0 ± 1.80 for spring 2018, summer 2018, fall 2018, winter 2018, spring 2019, and summer 2019 respectively (P < 0.001). In regions where Jersey herds were located, THImin followed the same pattern as THIavg. Minimum THI was greatest in summer 2018 followed by summer 2019. Summer 2019 was greater in THIavg than spring 2018, fall 2018, and spring 2019. Winter 2018 had the lowest THIavg. Average THI averaged 49.8, 64.4, 51.9, 43.9, 51.5, and 60.1 ± 1.20 for spring 2018, summer 2018, fall 2018, winter 2018, spring 2019, and summer 2019 respectively (P < 0.001).
De novo, Mixed Origin, and Preformed Fatty Acid Content. Changes in fatty acid content by season among Holstein herds are shown in Figure 4. Holstein herds had greater bulk tank DNFA during winter 2019 followed by fall 2018. Spring months (2018 and 2019) were intermediate of winter and fall 2018. Summer months (2018 and 2019) had the least DNFA content. Bulk tank DNFA averaged 0.87, 0.77, 0.84, 0.87, 0.85 and 0.77 ± 0.021 g/100 g milk for spring 2018, summer 2018, fall 2018, winter 2018, spring 2019, and summer 2019 respectively (P < 0.001). Bulk tank MOFA was greater during spring 2019 followed by fall and winter 2018. Spring 2018 and summer 2019 were intermediate. Summer 2018 had the least MOFA. Bulk tank MOFA averaged 1.34, 1.21, 1.28, 1.32, 1.39, and 1.38 ± 0.044 g/100 g milk for spring 2018, summer 2018, fall 2018, winter 2018, spring 2019, and summer 2019 respectively (P < 0.001). Bulk tank PRFA content was greatest during spring 2018, fall 2018, and winter 2018 than spring 2018. Summer months (2018 and 2019) were intermediate. Bulk tank PRFA averaged 1.39, 1.38, 2.38, 1.42, 1.33, AND 1.36 ± 0.025 g/100 g milk for spring 2018, summer 2018, fall 2018, winter 2018, spring 2019, and summer 2019 respectively (P = 0.014).
Changes in fatty acid content by season among Jersey herds are shown in Figure 5. Jersey herds had greater bulk tank DNFA during winter 2019 followed by spring 2018 and 2019 and fall 2018. Spring and fall had greater DNFA than summer 2018, and summer 2019 had the least DNFA content. Bulk tank DNFA averaged 1.14, 1.07, 1.16, 1.20, 1.14, and 1.01 ± 0.018 g/100 g milk for spring 2018, summer 2018, fall 2018, winter 2018, spring 2019, and summer 2019 respectively (P < 0.001). Jersey herds had the greatest MOFA content during winter 2018 followed by spring months (2018 and 2019) and fall 2018. Spring and fall months had greater MOFA content than summer 2019, and summer 2018 had the least MOFA content. Bulk tank MOFA averaged 1.76, 1.61, 1.77, 1.84, 1.76, and 1.68 ± 0.025 g/100 g milk for spring 2018, summer 2018, fall 2018, winter 2018, spring 2019, and summer 2019 respectively (P < 0.001). Jersey herds had greater PRFA content during spring 2018, summer 2018, and winter 2018 followed by fall 2018. Spring 2019 and summer 2019 had the least PRFA content. Bulk tank PRFA averaged 1.70, 1.66, 1.60, 1.65, 1.52, and 1.52 ± 0.023 g/100 g milk for spring 2018, summer 2018, fall 2018, winter 2018, spring 2019, and summer 2019 respectively (P < 0.001).
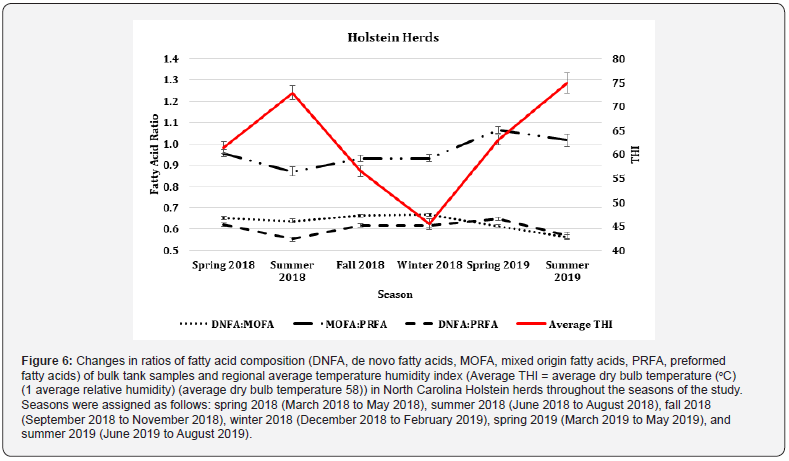
Fatty Acid Ratios. Changes in fatty acid ratios by season among Holstein herds are shown in Figure 6. Holstein herds had greater DNFA: MOFA during fall 2018 and winter 2018 followed by summer 2018, where spring 2018 was intermediate. Spring 2019 had greater DNFA: MOFA than summer 2019. Ratio of DNFA: MOFA averaged 0.65, 0.64, 0.66, 0.67, 0.61, and 0.56 ± 0.009 for spring 2018, summer 2018, fall 2018, winter 2018, spring 2019, and summer 2019 respectively (P < 0.001). Holstein herds had greater MOFA: PRFA during spring 2019 than spring 2018, and summer 2019 was intermediate. Spring 2018, fall 2018, and winter 2018 all had greater MOFA: PRFA than summer 2018. Ratio of MOFA: PRFA averaged 0.96, 0.87, 0.93, 0.93, 1.07, and 1.02 ± 0.030 for spring 2018, summer 2018, fall 2018, winter 2018, spring 2019, and summer 2019 respectively (P < 0.001). Holstein herds had the greatest DNFA: PRFA during spring 2019 followed by spring 2018, fall 2018, and winter 2018. Summer months (2018 and 2019) had the least DNFA: PRFA. Ratio of DNFA: PRFA averaged 0.62, 0.55, 0.62, 0.62, 0.65, and 0.57 ± 0.008 for spring 2018, summer 2018, fall 2018, winter 2018, spring 2019, and summer 2019 respectively (P < 0.001).
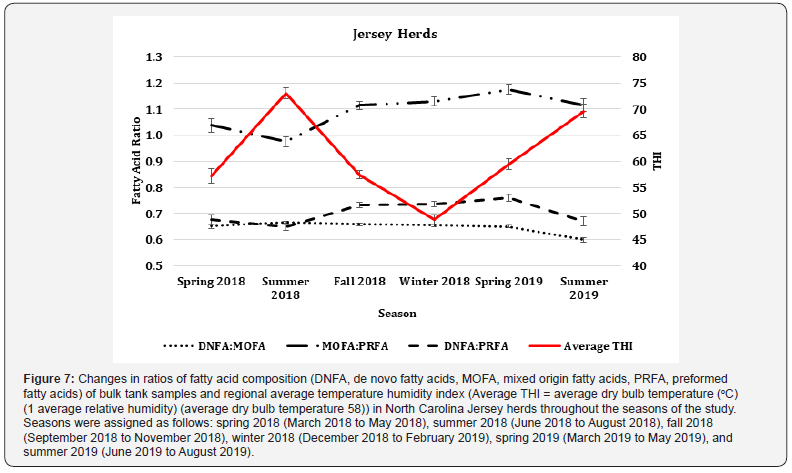
Changes in fatty acid ratios by season among Jersey herds are shown in Figure 7. Jersey herds had the least DNFA: MOFA during summer 2019 compared to all other seasons. Ratio of DNFA: MOFA averaged 0.65, 0.67, 0.66, 0.66, 0.65, and 0.60 ± 0.008 for spring 2018, summer 2018, fall 2018, winter 2018, spring 2019, and summer 2019 respectively (P < 0.001). Jersey herds had greater MOFA: PRFA during spring 2019 compared to fall 2018, and winter 2018 and summer 2019 were intermediate. Spring 2018 and summer 2018 had the least MOFA: PRFA. Ratio of MOFA: PRFA averaged 1.04, 0.97, 1.11, 1.13, 1.17, AND 1.12 ± 0.025 for spring 2018, summer 2018, fall 2018, winter 2018, spring 2019, and summer 2019 respectively (P < 0.001). Jersey herds had the greatest DNFA: PRFA during fall 2018, winter 2018, and spring 2019 compared to all other seasons. Ratio of DNFA: PRFA averaged 0.68, 0.65, 0.73, 0.74, 0.76, and 0.67 ± 0.016 for spring 2018, summer 2018, fall 2018, winter 2018, spring 2019, and summer 2019 respectively (P < 0.001).
Discussion
Relationships between Fatty Acid Composition and Milk Components
Breed differences were observed when analyzing the relationship between fatty acid composition and milk components. The strong positive relationship between DNFA, MOFA, and percent fat is consistent with previous work reported by Barbano et al. [24]. Holstein herds displayed a stronger relationship between all fatty acid classes and milk fat percent. However, the current study also showed a strong positive relationship between PRFA and fat percent, which is strong than previously reported [24]. However, a weak positive correlation between PRFA and fat among Jersey herds is similar to that reported by the previous authors. Overall, the relationship between all fatty acid categories and milk fat was greater in Holstein herds than Jersey herds. This is in contrast to data reported previously, which reported stronger correlations and relationships within Jersey herds. However, it is important to note the regional differences between the studies. Barbano et al. [24] sampled 430 farms (Jersey and Holstein) over a period of 15 months in Northeastern New York State and Northern Vermont while the current study was conducted in North Carolina. Both regions differ vastly in climactic challenges and management practices, which may contribute to overall relationships. However, even with regional differences, both studies report a DNFA and MOFA being a better predictor of overall milk fat percent than PRFA.
The strong positive relationship observed between DNFA, and protein percent is consistent with results reported by Barbano et al. [24]. The previous authors did not report correlations between MOFA, PRFA, and protein percent, however the weaker relationships observed of MOFA and PRFA support the theory produced by the previous authors that both DNFA and milk protein % are indicators of overall optimization of rumen function and health. The main source of DNFA is acetate through carbohydrate fermentation, particularly fibrous sources, so optimization of rumen fermentation activity should result in increased DNFA content. Likewise, optimizing rumen fermentation should maximize the microbial protein synthesis and thus amino acid supply for synthesis of milk protein. Following that theory, the relationship observed in the current study between MOFA, PRFA, and milk protein is expected. Roughly half of MOFA originate from de novo synthesis (Loftin et al., 2014), while the other half originates from preformed sources (rumen modified fat and mobilized adipose tissue), therefore maximization of fermentation products would also increase MOFA content even if not to the extent of DNFA. However, that would not be observed to the same degree when evaluating PRFA.
The relationship observed between NEFA and fatty acid classification is consistent with previous studies that [25,26]. The negative relationship between DNFA and NEFA may be explained through a dilution effect from increased fat mobilization or inhibition of de novo synthesis by long chain FA [25]. Jorjong et al. [27] reported increased risk of detrimental blood plasma NEFA (> 0.6 mmol/L) during the first 8 wk of lactation when concentration of C18:1 cis-9 was at least 240 g/kg. Similarly, Dórea et al. [26] reported that plasma NEFA may be predicted by milk fatty acid ratios C18:1 to C15:0 and C17:0 to C15:0. Understanding this relationship is necessary when interpreting DNFA milk content. Seasonal herds with a lower average DIM may have reduced DNFA compared to nonseasonal herds or their herd later in lactation due to increased C18:1 during negative energy balance [28]. Although this study was performed on bulk tank samples, monitoring fatty acids on an individual cow basis may be a predictor of incidence of metabolic diseases associated with energy balance, such as hyperketonemia [25-28].
Impact of Herd Classification on Production
Previous studies reported milk production factors of high and low DNFA herds in Holstein herds from the northeastern United States [6,7]. Milk yield response varied across the studies. Woolpert et al. 2016 [6] reported no difference in milk yield, however Woolper et al. 2017 [7] reported a tendency for a 3.6 kg/d increase in milk yield for HDN herds compared to LDN herds. However, the previous authors reported increased fat percent, DNFA, MOFA, and protein, and reduced PRFA in HDN herds compared to LDN herds. This contrasts the current study which observed no differences in milk production and composition by DNFA herd category with the exception of a tendency for reduced MOFA in HDN herds. In contrast MOFA classification had the greater impact on fat percent in Holstein herds. However, the previous authors categorized herds based on at least 6 mo of sampling for DNFA content and reported production averages of the month a herd assessment was performed whereas the current study categorized and reported herd data seasonally.
The reduced NEFA content in HDN and HMO Holstein herds is consistent with the negative correlation between the two variables observed. However, the correlation did not transfer to Jersey herd classification, which interestingly had a stronger correlation and R2 than Holstein herds. Breed differences in responses of herd classification observed in the current analysis, emphasizing the importance of understanding the relationships of milk parameters within a breed as they can vary greatly across breeds. Additionally, the lack of observed differences across herd classifications indicate that the relationships observed may be a better indicator of individual cow status and performance rather than herd-wide analysis as the changes in fatty acid content may become diluted when assessed on a herd basis.
Impact of Nutrient and Herd Management
Previous studies reported reduced concentrations of EE in TMR fed to HDN herds compared to LDN herds [6], which was not observed in the current study. Excessive dietary fat a well-known risk factor for milk fat depression [5]. However, concentrations present in the rations evaluated in this study were not expected to cause changes in milk fat content, so the lack of response was expected. Previous studies also reported increased peNDF in HDN herds compared to LDN herds [7] which was not observed in the current study although NDF and ADF were in fed in greater concentrations in HMO herds. A minimum of 21% peNDF is recommended to prevent milk fat depression [29], and all the herds utilized in the current study fed rations well above that benchmark.
The effect of average BCS on bulk tank milk FA is variable. Woolpert et al. [7] reported no difference in BCS whereas Woolpert et al. 2016 [6] lower BCS in LDN herds. Interestingly, Woolpert et al. [6] reported an average BCS of 2.96 in LDN herds and 3.08 in HDN herds (± 0.03) while both HDN and LDN herds had an average BCS above 3 (3.05 and 3.03 ± 0.02, respectively) in the study by Woolpert et al. [7]. The herds assessed in this study may have consistently lower BCS than that observed in the previous studies. On a herd basis, BCS may be less likely to influence FA content, however if during periods of negative energy balance the mobilization of body fat would most likely be observed in individual cow milk FA content.
The negative impact of clinical lameness on milk yield is established [30, 31], however its impact on milk components is not often observed. Although no difference in lameness was observed in the current study, diets high in rapidly fermentable carbohydrates reduce rumen pH which both reduces rumen digestion of NDF but also increases the risk of lameness due to laminitis [32, 33].
Woolpert et al. [6] reported lower stocking density in HDN herds compared to LDN herds, which was not observed in the current study. However, the authors reported stocking densities of 1.05 and 1.20 ± 0.05 cow/stall for HDN and LDN herds, respectively. Farm assessed in the current study did not exhibit stocking densities as high as those observed in the LDN herds reported by Woolpert et al. [6]. Woolpert et al. [7] reported no change in stocking density in HDN and LDN herds when stocking density average 1.11 and 1.16 ± 0.04, respectively. Farm assessed in the current study may not have reached the threshold required for stocking density to impact milk FA content.
Impact of Season and Temperature Humidity Index on Production
The reduction in milk yield during periods of high THIavg in Holstein herds but increase in Jersey herds has been previously reported [34]. Smith et al. 2013 [34] reported that Jersey cows in southeastern U.S. did not decline in milk production until severe heat stress (THI ≥ 90) was experienced while Holstein cows exhibited reduced milk yield during moderate (79 ≥ THI < 90) and severe heat stress. Dry matter intake has been negatively correlated with THI in both Jersey and Holstein cows [12], which may indicate that Jersey cows are more feed efficient during periods of elevated THI. Additionally, pasture housing challenges conventional heat abatement practices, and of the herds used, two Jersey herds were pasture based while no Holstein herds were housed entirely on pasture.
The increase in fat percent during high THIavg contracts previous research reporting reductions in fat percent during heat stress [11]. However, Smith et al. [34] reported increased fat percent in Holstein cows and no change in Jersey cows when THI ≥ 72. The increase in fat percent of Holstein cows may be due to the reduction in milk yield but steady fat yield, resulting in a more concentrated fat percent. However, Jersey herds had both increased milk yield and fat percent in high THIavg, so the increased fat yield is expected. Minimum nighttime THI has been shown to be more strongly correlated with a depression in DMI than maximum daytime THI, and the effects of heat stress on DMI were lessened when cows were allowed a temporary nighttime relief [9] [35].
In Holstein herds, protein percent was greater in high THIavg compared to medium THIavg, which contradicts previous research [11,32]. However, Jersey herds showed a reduction in protein percent in high THIavg, so the increase in Holstein herds may be due to an increased concentration resulting from the reduced milk yield as protein yield was not affected.
Although intake was not measured on this study, it has strong influence over milk production characteristics. Maximum THI did not impact Holstein milk components; however, fat and protein percent were greater during low THImin. During the spring and fall months where daytime THI is elevated but nighttime relief is more frequent, the impact of the daily THI on milk production may not be as severe. Although high THImax reduced milk fat percent and medium THImax reduced protein percent in Jersey herds, low THImin also increased fat and protein percent.
The increase in DNFA of Holstein herds during high THIavg contradicts previous work reporting reduction in triacylglycerol groups predominately composed of short and medium chain FA when cows were exposed to THI between 72 and 84. However, the previous study subject cows to a simulated heat-stress in climatecontrolled chambers whereas the current study evaluated the conditions present during the sampling period. The increase in DNFA during low THImin may support the theory that nighttime relief mitigates the effects on milk composition as well as intake. The current study also observed increased PRFA in high THIavg and a reduction in DNFA: PRFA in low THImin. The FA components were also expressed in g/100 g milk, so the potential fat concentration of Holstein herds may have been observed in DNFA content. In contrast, Jersey herds displayed increased MOFA and a tendency for increased PRFA during high THIavg. However, DNFA and MOFA were both elevated during low THImin.
In both Jersey and Holstein herds, DNFA and MOFA displayed a more inverse relationship to THI during the seasons. Both FA categories were in elevated concentrations during cooler seasons. De novo FA were lowest during summer seasons and highest during winter and spring months. This may be attributed to THI variations but also grazing conditions and forage quality changes throughout the year that are more challenging during summer months close to harvest season. Preformed FA did not follow a distinct pattern like that displayed by other FA, however the ratio of DNFA:PRFA was lowest during summer months of both breeds.
Conclusion
De novo FA and MOFA are strongly related to milk fat and protein content of milk. Holstein herds classified as HMO fed more NDF and ADF and produced milk with more fat percent than LMO herds, however herd FA classification did not affect herd production or nutrient management otherwise. Herd management parameters evaluated in this study did not affect herd FA category. However, the herds assessed in the current study did not exceed benchmarks discussed by previous authors. Factors such as increased stall stocking density may alter milk FA content if they exceed industry benchmarks and subject cows to environmental stressors. During periods of elevated average THI, Holstein herds exhibited a reduction in milk yield while Jersey herds improved milk production indicating that Jersey herds are more tolerant to elevated THI than Holstein herds. Both Holstein and Jersey herds produced milk with more fat and protein percent during periods of low minimum THI. Periods that allow for nighttime relief from daily THI increases may mitigate the negative effects of heat stress on dairy cattle production. In Holstein herds, the ratio of DNFA:PRFA was elevated during periods of low minimum THI. De novo FA and MOFA displayed a more inverse relationship to THI across the seasons, and the ratio of DNFA:PRFA was lowest during summer months of both breeds. Further research is needed to understand the relationship heat stress and FA composition of both Jersey and Holstein herds. Analysis of milk FA composition may be useful for predicting disorders and stressors of individual cows, however further research is necessary to evaluate fluctuations in FA composition on an individual cow basis to determine if this may be an appropriate farm management tool.
Acknowledgements
This study was funded by the North Carolina Dairy Foundation and the American Jersey Cattle Association AJCC Research Foundation. This project was completed as part of a PhD Dissertation (S.C. Allen) and we would like to recognize committee members who are not co-authors: DM Barbano2, DH Poole1, J Odle1, MA Drake3. 1Department of Animal Science, North Carolina State University, Raleigh 27607; 2Department of Food Science, Cornell University, Ithaca 14850; 3Department of Food, Bioprocessing, and Nutrition Sciences, North Carolina State University, Raleigh 27607.
References
- Jensen RG (2002) The composition of bovine milk lipids: January 1995 to December 2000 J. Dairy Sci: 85(2): 295 -350.
- Lynch JM, Barbano DM, Bauman DE, Hartnell GF, Nemeth MA (1992) Effect of a prolonged release formulation of Nmethionyl bovine somatotropin (sometribove) on production and composition of milk fat J. Dairy Sci: 75(7): 1794 -1809.
- Soyeurt HP, Dardenne A Gillon, C Croquet, S Vanderick, P Mayeres, et al. (2006) Variation in fatty acid contents of milk and milk fat within and across breeds. J Dairy Sci 894858-4865.
- Palmquist DL, Beaulieu AD, Barbano DM (1993) Feed and animal factors influencing milk fat composition. J Dairy Sci: 76(6): 1753 -1771.
- Bauman DE, Griinari JM (2003) Nutritional regulation of milk fat synthesis. Annu. Rev. Nutr 23: 203 -227.
- Woolpert ME, Dann HM, Cotanch KW, Melilli C, Chase LE, et al (2016) Management, nutrition, and lactation performance are related to bulk tank milk de novo fatty acid concentration on northeastern US dairy farms. J Dairy Sci 99: 8486-8497.
- Woolpert ME, Dann HM, Contach K, Melilli C, LE Chase, et al. (2017) Management practices, physically effective fiber, and ether extract are related to bulk tank milk de novo fatty acid concentration on Holstein dairy farms. J Dairy Sci 100(6): 5097-5106.
- NOAA (1976) Livestock hot weather stress. United States Dept. of Commerce, Natl. Oceanic and Atmospheric Admin., Natl. Weather Service Central Region. Regional Operations Manual Letter C-pp 31-76.
- Holter JB, West JW, McGilliard ML, Pell AN (1996) Predicting ad libitum dry matter intake and yields of Jersey cows. JDairy Sci: 79(5): 912 -921.
- Holter JB, West JW, McGilliard ML (1997) Predicting ad libitum dry matter intake and yield of Holstein cows. J Dairy Sci: 80(9): 2188 -2199.
- Bouraouri R, Lahmar M, Majdoub A, Djemali M, Belyea R (2002) The relationship of temperature-humidity index with milk production of dairy cows in a Mediterranean climate Anim Res: 51: 479-491.
- West JW, Mullinix BG, Bernard JK (2003) Effects of hot, humid weather on milk temperature, dry matter intake, and milk yield on lactating dairy cows. J Dairy Sci 86: 232-242.
- Wildridge AM, Thompson PC, Garcia SC, John AJ, Jongman EC, et al. (2018) Short communication: The effect of temperature-himidity index on milk yield and milking frequency of dairy cows in pasture-based automatic milking systems. J Dairy Sci 101: 4479-4482.
- Berbanucci U, Basiricò L, Morera P, Dipasquale D, Vitali A et al. (2015) Effect of summer season on milk protein fractions in Holstein cows. J. Dairy Sci: 98(3): 1815-1827.
- Liu Z, Ezernieks V, Wang, Wanni Arachchillage N, Garner JB (2017) Heat stress in dairy cattle alters lipid composition of milk Sci Reports: 7(1): 961-970.
- Ferguson JD, Galligan DT, Thomsen N (1994) Principal descriptors of body condition score in Holstein cows Dairy Sci: 77(9): 2695-2703.
- Zinpro Corporation, Eden Prairie, MN. Locomotion scoring of dairy cattle. Available at:. Accessed Jun. 23, 2015.
- Kaylegian KE, Lynch JM, Houghton GE, Fleming JR, Barbano DM (2006) Modified versus producer milk calibration: mid-infrared analyzer performance validation: J. Dairy Sci: 89(8): 2883-2845.
- Wojciechowski KL, DM Barbano (2016) Prediction of fatty acid chain length and unsaturation of milk fat by mid-infrared milk analysis. J Dairy Sci 99: 8561-8570.
- AOAC International (2009) Official Methods of Analysis. 17th Arlington VA: AOAC Int.
- AOCS (1998) American Oil Chemists Society. Official methods and recommended practices of the AOCS. Champaign, Ill: American Oil Chemists Society.
- NOAA (2020) Climate Data Online. Local Climatological Data, pp. 5.
- Kelly CF, Bond TE (1971) Bioclimatic factors and their measurement: a guide to research on animals. National Academy Press, Washington DC.
- Barbano DM, Melilli C, Overton TR (2014) Advanced use of FTIR spectra of milk for feeding and health management. Pages 105-113 in Proc; Cornell Nutr; Conf; Syracuse; NY. Cornell Univ; Ithaca NY.
- Craninx M, Steen A, Van Laar H, Martín-Tereso J, de Baets B et al. (2008) Effect of lactation stage on the odd- and branched-chain milk fatty acids of dairy cattle under grazing and indoor conditions. J. Dairy Sci: 91(7): 2662-2677.
- Dórea JRR, French EA, Armentano LE (2017) Use of milk fatty acids to estimate plasma nonesterified fatty acid concentrations as an indicator of animal energy balance J. Dairy Sci: 100(8): 6164-6176.
- Jorjong S, van AT, Knegsel J, Verwaeren M, Lahoz V et al., (2014) Milk fatty acids as possible biomarkers to early diagnose elevated concentrations of blood plasma nonesterified fatty acids in dairy cows J. Dairy Sci: 97(11): 7054-8039.
- Jorjong S A, van Knegsel TM, Verwaeren J, Bruckmaier RM, De Baets B et al (2015) Milk fatty acids as possible biomarkers to diagnose hyperketonemia in early lactation J. Dairy Sci: 98(8): 5211-5221.
- Mertens DR (2015) Determination of Starch in Large Particles. Ro- Tap Shaker Method. U.S. Dairy Forage Research Center, Madison, WI. 98(6): 4041-4054.
- Warnick LD, Janssen D, Guard CL, Gröhn YT (2001) The effect of lameness on milk production in dairy cows. J Dairy Sci. 84: 1988-1997.
- Green LE, Hedges VJ, Schukken YH, Blowey RW, Packington AJ (2002) The impact of clinical lameness on the milk yield of dairy cows J. Dairy Sci: 85(9): 2250-2256.
- Nocek JE (1997) Bovine acidosis: implications on laminitis J. Dairy Sci: 80(5): 1005-1028.
- Krajcarski Hunt HJ, Plaizier C, Walton JP, Spratt R, McBride BW (2002) Short communication: Effect of subacute ruminal acidosis on in situ fiber digestion in lactating dairy cows: J. Dairy Sci. 85(3): 570-573.
- Smith DL, Smith T, Rude BJ, Ward SH (2013) Short communication: Comparison of the effects of heat stress on milk and component yields and somatic cell score in Holstein and Jersey cows. J. Dairy Sci. 96: 3028-3033.
- Kay JK, Weber WJ, Moore CE, Bauman DE, Hansen LB, et al (2005) Effects of week of lactation and genetic selection for milk yield on milk fatty acid composition in Holstein cows J. Dairy Sci: 88(11): 3886-3893.


