Indigenous Chicken Production Environments, Reproductive and Productive Performances and Constraints in Kaffa Zone, South Western Ethiopia
Abiyu Tadele*
Department of Animal Science, Bonga University, Ethiopia
Submission: April 09, 2019; Published: May 01, 2019
*Corresponding author: Abiyu Tadele, College of Agriculture and Natural Resources, Department of Animal Science, P.O. Box 334, Bonga University, Ethiopia
How to cite this article: Abiyu T. Indigenous Chicken Production Environments, Reproductive and Productive Performances and Constraints in Kaffa Zone, South Western Ethiopia. Dairy and Vet Sci J. 2019; 11(4): 555816. DOI: 10.19080/JDVS.2019.11.555816
Abstract
The main objective of this study was to assess the production environments, reproductive and productive performances and constraints of indigenous chicken in Kaffa Zone. From ten districts of Kaffa Zone, three districts were purposively selected based on their potential for indigenous chicken population and accessibility. From each rural kebeles those households who possess a minimum of five mature indigenous chicken were purposively selected. Then, data on both qualitative and quantitative variables were collected from 300 purposively selected households using a semi-structured questioner. The results indicated that majority of the respondent were female (71.1%) and 56% of them were illiterate. The average family size per household was 5.86. Farmers mainly keep their chickens in the kitchen (60.7%) and main houses (30.7 %). Maize (55.7 %) and sorghum (20.3 %) were the major feed supplements provided by the households. The average chicken flock size, age at first egg (months), average egg/hen/clutch (clutch size), clutch number and annual egg/hen/year were 8.68, 6.09, 12.3, 3.6 and 44, respectively. Indigenous chickens have long age of sexual maturity and long brooding period. This was mainly influenced by inadequate feed supplementation, predators and diseases. Therefore, educating and training women should be implemented to improve the overall socio-economic status of the family and benefit them. Besides, adequate feed supplementation, predator and disease control programs should be implemented. Again, conservation of the indigenous chicken populations should also be carried out before they have been diluted with exotic breeds.
Keywords: Age at first egg; Annual egg production; Indigenous chicken; Predators; Production environments; Productive performance
Introduction
In Ethiopia, most of the rural communities keep indigenous chicken populations under scavenging management system [1,2]. Due to the presence of various agro-climatic conditions which enables the rural societies to keep a wide variety of indigenous chicken populations under scavenging management systems [2,3]. In Ethiopia chickens are the most widespread and almost every rural family owns chickens, which provide a valuable source of family protein and income [4]. The total chicken population in the country is estimated to be 56.53 million and of these 94.3 % indigenous which are mainly kept by smallholder farmers in scavenging environments [5]. The most dominant chicken types reared in Ethiopia are local ecotypes, which show a large variation in body conformation, plumage colour, comb type and productivity [2,6]. However; the economic contribution of the sector is not still proportional to the huge chicken numbers, attributed to the presence of many productions, reproduction and infrastructural constraints [7]. In the rural areas of Ethiopia indigenous chickens has been mainly kept by the poor people due to their significance for the source of animal protein, generation of extra cash incomes and religious /cultural [8].
Moreover, the indigenous chicken’s populations which have been kept by the majority of rural farmers in Ethiopia are good scavengers and foragers, well adapted to harsh environmental conditions and their minimal space requirements make chicken rearing a suitable activity and an alternative income source for the rural farmers. In addition, the local chicken sector constitutes a significant contribution to human livelihood and contributes significantly to the food security of poor households. Horst considered the indigenous fowl populations as gene reservoirs, particularly for those genes naked neck (Na) that have adaptive values in tropical conditions. Despite the important roles of local chickens, rearing them can be considered as a sideline agricultural activity. However, the indigenous chicken populations in Ethiopia were neglected for conservation, rather they have been diluting with the imported exotic breeds [6].
The indigenous chicken populations which are found in large proportions are often low in their egg production, late in maturation, long broodiness and unimproved [7,9]. Due to their low genetic potential, the incidence of diseases and predators, limited supplementary feed resources, constraints related to institutional socio-economic and infrastructural as well as poor management practices contributed for the low production and productivity of chickens. Therefore, the present study was conducted to assess the production environments, productive and reproductive performances and constraints of indigenous chicken populations reared in three districts of Kaffa Zone.
Materials and Methods
Description of the Study Area
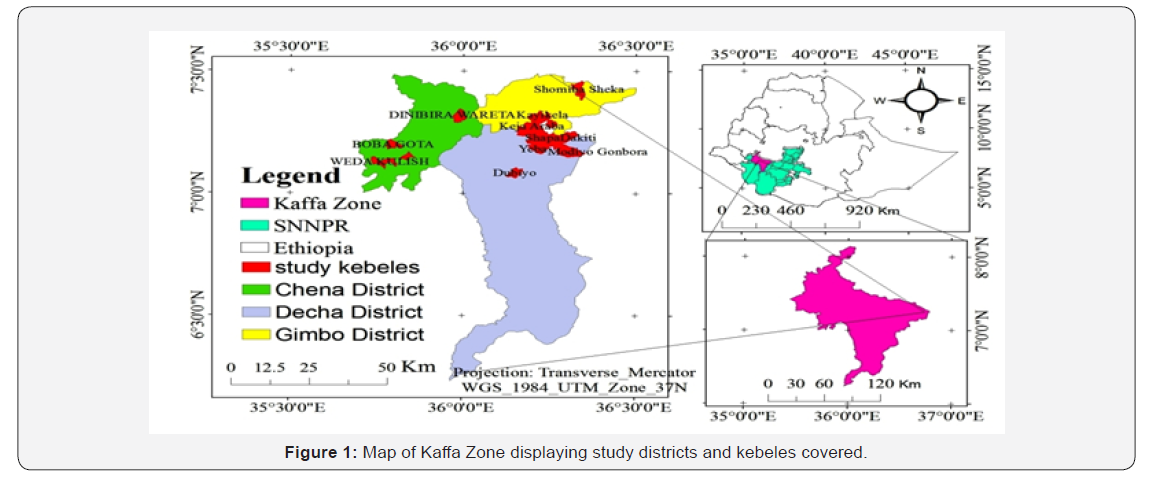
This study was conducted in Kaffa Zone which is located between 6 ͦ24’ to 8 ͦ13’ North latitude and 35 ͦ30’ to 36 ͦ46’ East longitude in South Western part of South, Nation, Nationalities and Peoples Region. The Zone has a total area of 10,602.7km2 which accounts for 7.06% of the total area of the region. Administratively, Kaffa Zone is divided into ten districts and has three conventional climatic zones based on variations in altitude and temperature. These are highland (2500 - 3000 m a.s.l), Midland (1500 - 2500 m a.s.l) and lowland (500 - 1500 m a.s.l). Out of the total area of the Zone, Highland, Midland and lowland cover 11.6%, 59.5% and 28.9%. The mean annual temperature of the area ranges 10.1 °C - 27.5 °C. The warmest months are February, March and April while the coldest months are July and August. According to the meteorological data obtained from the Zone, the annual rainfall ranges from 1001-2200mm. Kaffa Zone is a part of the South West Ethiopian regions which receive the highest amount of rainfall. This is attributable to the presence of the evergreen forest cover on top of the windward location to the moist monsoon winds.
Sampling Technique and Methods of Data Collection
The study districts were purposively selected based on their potential for chicken population, accessibility and presence of indigenous chicken production. Before the main survey was commenced, a preliminary assessment was made to identify whether there is pure exotic and/or their crosses in the study areas. From ten districts of Kaffa Zone, three districts namely Decha, Chena and Gimbo districts were selected from which 15 rural kebeles (seven from Decha; four from each Chena and Gimbo district) were randomly sampled. Then, a total of 300 households, 20 households from each rural kebeles, that possess a minimum of 5 matured indigenous chickens were randomly selected. Closely adjacent households were also skipped to avoid the risk of sampling chickens sharing the same cock (Figure 1).
Effective Population Size
Data on effective population size was collected from the surveyed chicken populations which were mature male and female. However, pullets and cockerels which are not ready for breeding were excluded from both districts to estimate the effective population size. Effective population size for a randomly mated population was calculated following the equation given by Falconer & Mackay [10].

Where; Ne=effective population size; Nm=number of breeding males and Nf=number of breeding females.
Estimation of the Rate of Inbreeding
Data on the rate of inbreeding was calculated from an effective number of breeding indigenous chickens from the studied districts to determine the current status of inbreeding. Effective population size (Ne) was used to estimate the rate of inbreeding in a population. The rate of inbreeding (ΔF) for each studied districts and total populations were estimated from the effective population size data following the model adopted from [10,11].
Rate of inbreeding = ΔF = 1 / (2 Ne)
Where;
ΔF = rate of inbreeding
Ne = effective population size
Statistical Analysis
Data collected on socio-economic, production systems, productive performances and constraints of chicken populations were coded and entered into a computer using Microsoft Office Excel 2007. Descriptive statistics were employed to analyze the data in each district and Chi-square (χ2) test was also employed to compare the significance of district by using Statistical Analysis System.
Results
Household Characteristics of the Study Areas

N: Number of observations; Numbers in parenthesis are percentage values.
a,bRow means with different superscript letters are significantly different (P < 0.05); SE: Standard error of the mean, N: Number of observations.
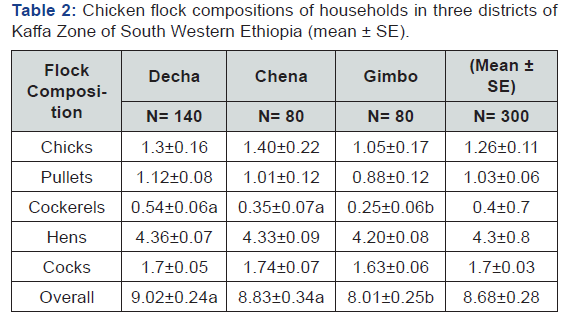
The household characteristics of the respondents are presented in Table 1. From the total interviewed indigenous chicken owning farmers, 70.7, 70 and 72.5 % were females in Decha, Chena and Gimbo districts, respectively. A higher proportion of female respondents (71.1%) than males (28.9%) was observed. This indicates that female farmers are mainly involved in managing and caring for chickens in the study districts. The average age of respondents in the present study was 39.9, 41.3 and 39.2 years in Decha, Chena and Gimbo districts, respectively. The educational level of respondents showed that about 66.4, 58.7 and 42.5 % in Decha, Chena and Gimbo districts, respectively were illiterate. This might be due to the fact that farmers in rural communities particularly in this area did not have access to education before. Others can read and write and some were involved in formal education such as primary first cycle (1-4th); second cycle (5-8th) and high school (9-10th or 12th) and above in all study districts. The average family size in Decha, Chena and Gimbo districts was 5.97, 5.83 and 5.7 persons, respectively with the overall mean family size of 5.86 persons. The average chicken flock size per household in Decha, Chena and Gimbo districts was 9.02, 8.83 and 8.01, respectively with the overall mean chicken flock size of 8.68 (Table 2). The largest proportions of chicken populations were reported from Decha and Chena districts and which are significantly higher (p <0.05) than Gimbo district.
Indigenous Chickens
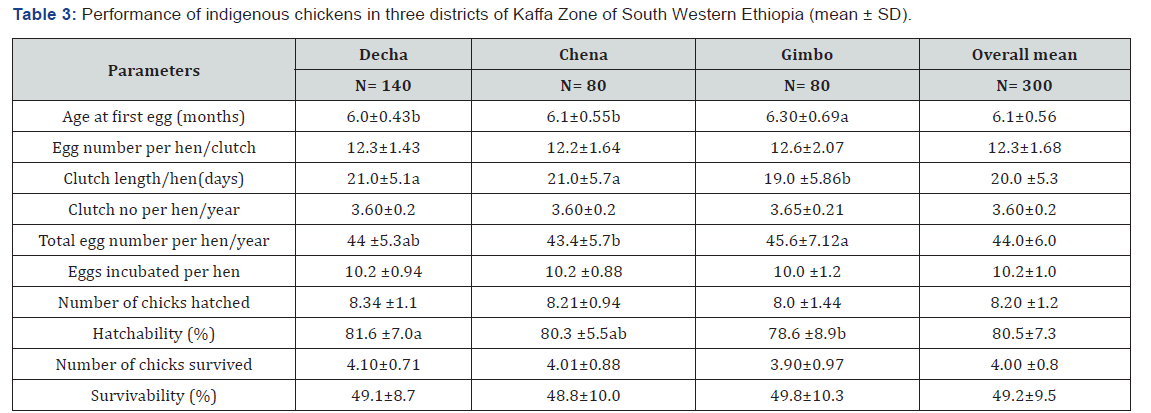
The performance of indigenous chicken populations is presented in Table 3. Age at first egg (months) was significantly longer for chickens reared in Gimbo (6.3 months) district than Chena (6.1 months) and Decha (6 months) districts. Egg number per hen per clutch in the present study was 12.3, 12.2 and 12.6 eggs in Decha, Chena and Gimbo districts, respectively. An average number of days per clutch (clutch length) was lower in Gimbo district than, Decha and Chena districts, which had similar values. Eggs incubated per hen/clutch in Decha, Chena and Gimbo districts were 10.2, 10.2 and 10, respectively. The hatchability percentages of chickens reared in Gimbo district was significantly (P < 0.05) lower than Decha chickens and has comparable with Chena district chickens. The district had no significant effect (P > 0.05) on the survivability of chicken. In general, the average egg and clutch number per hen per year in the current study were 44 and 3.6, respectively.
a,bRow means with different superscript letters are significantly different (P < 0.05); SD: Standard Deviation; N: Number of observations.
Husbandry Practices of Chickens
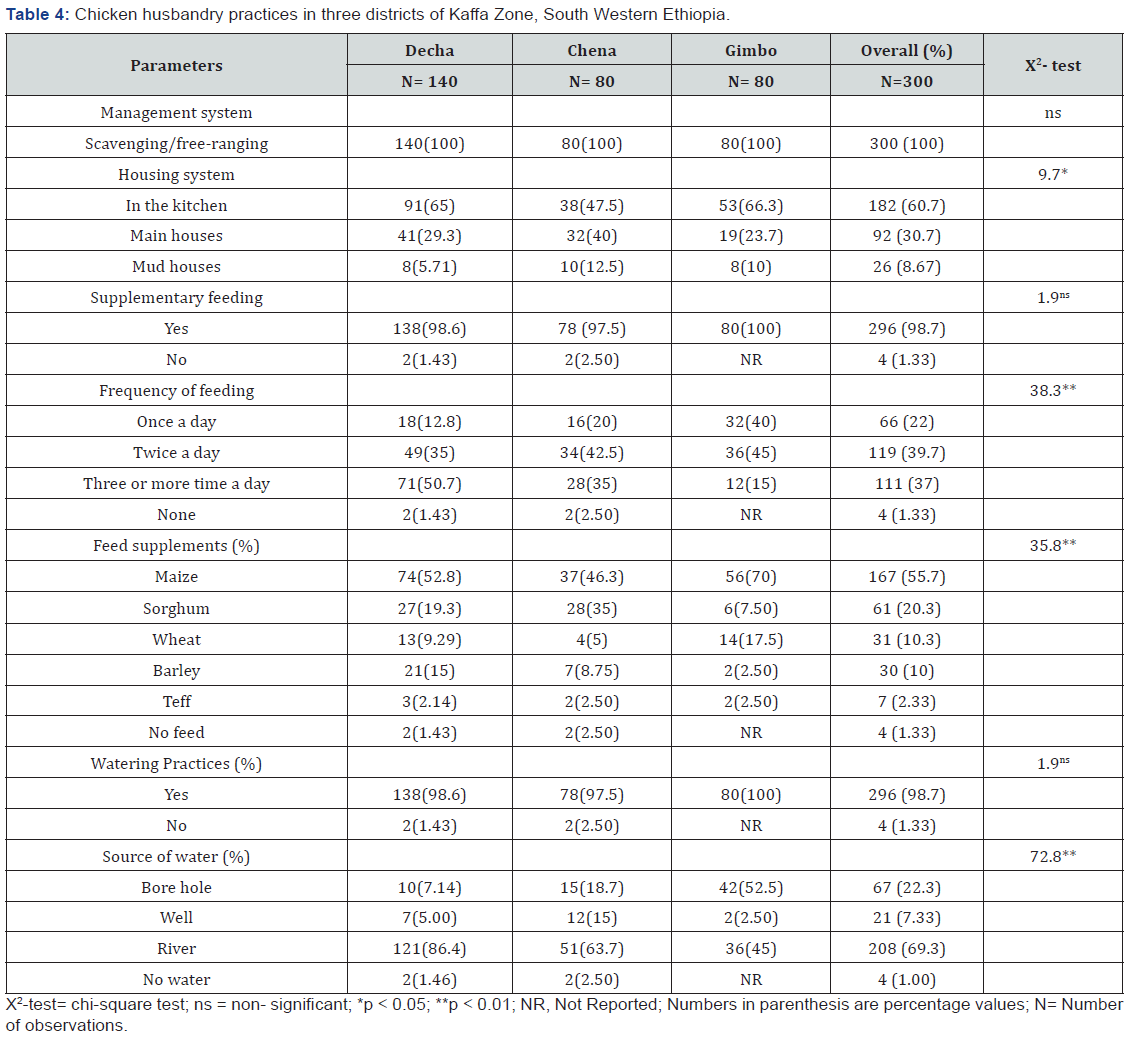
Management Systems: Chicken management systems practised in the three districts is presented in Table 4. The current study has revealed that scavenging/free-ranging as the main production systems practised in all the study districts.
Housing System: Housing system had significantly differed (p <0.05) among the studied districts. As presented in Table 4, about 60.7 % of households keep their chicken in the kitchen while 30.7 % of them shared their main houses with their chicken and other farm animals.
X2-test= chi-square test; ns = non- significant; *p < 0.05; **p < 0.01; NR, Not Reported; Numbers in parenthesis are percentage values; N= Number of observations.
Feed and feeding practices
In the current study, supplementary feeding for chickens was provided in all study districts. In Gimbo, all the interviewed households provide supplementary feeds to their chickens, whereas 98.6 and 97.5 % in Decha and Chena districts respectively provide supplementary feeds. The common feed supplements feed in the study districts was Maize (55.7 %), Sorghum (20.3 %), and Wheat (10.3 %). Majority (39.7 %) provide feed twice per day across the study districts.
Watering practices
With regard to the provision of water in the current study, all respondents in Gimbo district provide water while 98.6 and 97.5 % of them in Decha and Chena districts, respectively provide water for their chickens. In the study districts, river water was the major source of water (69.3 %) followed by Borehole water (22.3 %).
Production constraints of indigenous chicken in the study area
Data pertaining to constraints in chicken production is presented in Table 5. Predators were the most important problem reported to be affecting poultry productivity in all the study districts accounting for 74.3, 80 and 62.5 % in Decha, Chena and Gimbo districts, respectively. The disease was the second constraint as reported by 25.7, 20 and 37.5 % of respondents in Decha, Chena and Gimbo districts, respectively. In all the production constraints reported, significance differences (P < 0.05) were observed among the study districts. The type of predators commonly occurring in the study districts was significantly differed (P < 0.05) across the different sites. These predators, which are mentioned by their scientific and local name included Milvus migrants locally known as “Gace”, Helogale hirtula locally known as “Shiifoo” or “Wociwoco”, Leptailurvs serval locally known as “Hallaroo” and Felis silvestris locally known as “Kubbi Kullaaro” accounted for about 54.6, 24.4, 15.5, and 5.5 %, respectively.
The prevalence of chicken diseases in Decha and Gimbo districts was higher with 98.6 and 97.5 %, respectively and in Chena 88.7 % (Table 5). The season had a significant effect (p < 0.05) on the occurrence of disease and the highest outbreak was recorded on the rainy season, as witnessed by 71.8, 53.2 and 52.1 % of respondents in Gimbo, Chena and Decha districts, respectively. This indicates rainy season was more favourable for the growth of disease causing agents across the study districts. Overall, the chisquare test suggests there were significant differences (p < 0.01) in the prevalence of disease and in a favorable season of disease occurrences (p < 0.05) across the study districts.
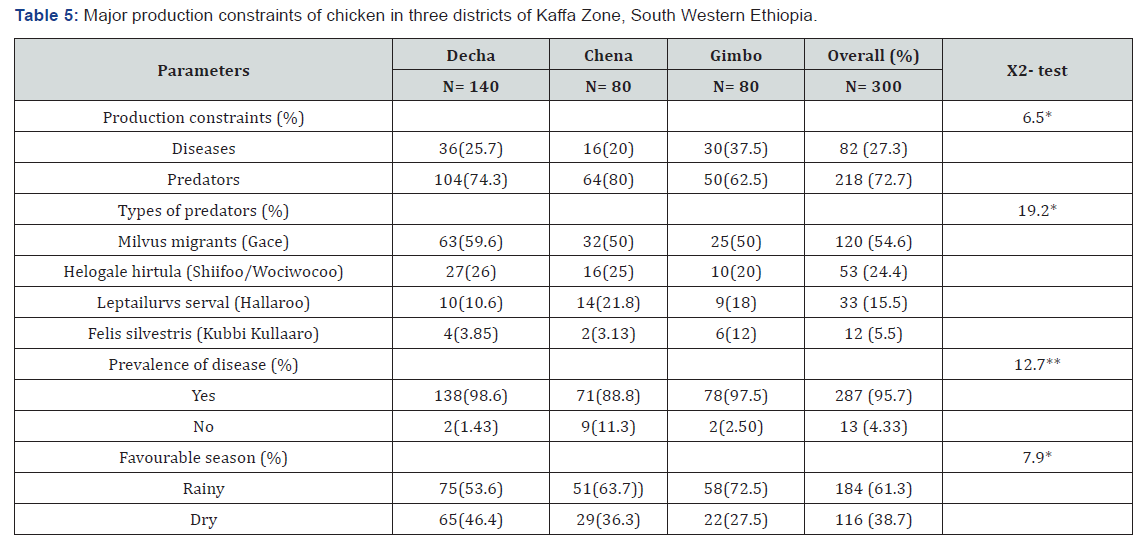
X2- test= Chi-square test; **p <0.01; *p <0.05;
Numbers in parenthesis are percentage values; Names of predators are in their scientific name, and names in brackets are in Kafigna language,the official working language of Kaffa Zone.
Effective Population Size and Inbreeding
As presented in Table 6, the overall effective population size (Ne) was found to be 486 while the rate of inbreeding was 0.073, 0.126 and 0.133 % in Decha, Chena and Gimbo districts, respectively with the overall rate of inbreeding 0.111 % across the study areas. In Decha district the percentage value of the rate of inbreeding was comparatively lower than Chena and Gimbo districts, however, Chena and Gimbo districts had comparable percentage value. The variation of Ne in the studied district might be due to the small number of cocks kept in the studied households.

Ne: Effective population size; ΔF: Rate of inbreeding; Nm: Number of breeding male chicken; Nf: Number of breeding female chicken; Nm/Nf (%): Ratio of Male: Female chickens in percent’s; N: Total breeding chicken populations (Nm+Nf); Ne/N (%): Ratio of breeders contributing efficiently genes to the population
Discussion
Household Characteristics and Respondents Profile in the Study Area
Household Characteristics of the Study Area: In the present study, majority of respondents were females (71.1% which agreed with the results of various scholars in the country [12- 14]. However, the highest value of males (62%) was reported by Mulgeta & Tebikew. The result on educational level obtained in the current study with higher illiterate (56%) was also in line with the findings of different scholars [6,12-14]. The average family size in the present study (5.86) was in close agreement with the findings of Halima, Moreda &Hailemichael [6,12,13]. Lower family sizes: 4.5 and 4.06 person per households was reported by Mulgeta & Tebikew and Solomon [15], respectively. From the present findings and the reports from various parts of the country, it is clear that female farmers are the main to care and manage chickens. Hence, it is important to empower women’s through better education as they are the most to contribute a significant role in the improvement of indigenous chicken production systems. In line with this Halima [6] also indicated that educating women will improve the overall socio-economic status of the family and society.
Reproductive and Productive Performance of Indigenous Chickens
The average age at first egg (6.1) of chickens in the current study was in close agreement with the findings of Deneke from the Southeastern Oromia Zone. High age values at first egg of indigenous chickens were reported from various parts of the country by Tadele, Aberra, Melkamu & Nebiyu [4,16-18]. Low age at first egg was also reported from Northwest Ethiopia by Addisu & Solomon [15,19] with 5.6 and 5.2 months, respectively. A different report on the age of chickens at first egg might be due to lack of proper supplementary feeds, availability of scavengable feed resources, disease outbreak and provision of clean water by the households.
The present finding with regard to average egg production per clutch per hen (12.3), number of eggs incubated (10.2) and number of chicks hatched (8.2) differed from the results of Melkamu & Andargie [17], Nebiyu & Solomon [15,18]. However, it was in close agreement with the findings of Addisu [19], Mulgeta & Tebikew and also was comparable with the reports of CSA [5]. The highest value of eggs/clutch/hen was reported from Eastern Gojam Zone by Melkamu & Andarge 17 eggs/clutch/hen. The average clutch number per hen per year (3.6) and total egg number per hen per year (44) in the current study was comparable with the findings of Addisu [19] which was 3.62 and 46, respectively. However, high values of clutch number and egg number per hen per year were reported by Melkamu & Andargie & Solomon [15]. The management aspects of the household’s chicken rearing might be the reason contributing to the observed variations in the production and reproduction traits of indigenous chickens in the country.
The average hatchability (80.5 %) of chickens in the current study was comparable with the results of Aberra & Deneke [16] in which the hatchability percentages were 79.1 and 81.5 percents, respectively. However, observations by several scholars in various parts of the country were higher than the present study [20]. On the other hand, lower hatchability values were reported from various parts of the country. The average survival rate of chickens in the present study (49.2 %) was lower than those reported by Aberra [16], Nebiyu, Deneke & Getachew with the respective values of 58.3, 52.3, 62.7 and 66.5 percent. These variations in the hatchability and survivability of chicks might be due to storage condition of the egg, incubation materials, quality of eggs, to some extent the hen factors, seasonal outbreak of disease, predator attacks, poor nutrition and management, availability of scavenging feed resources and feed supplements.
Husbandry Practices of Chickens in the Study Area
In the present study, all the studied districts manage their chickens in the scavenging system. These findings are in close agreement with the observations of different scholars in various parts of the country, where scavenging was the dominant type of chicken rearing. This management system might be due to the fact that indigenous chickens can best fit as they receive few inputs such as feed supplementation and health care for their survival, production and productivity.
The majority of chickens in the study area are kept in the kitchen (60.7%) and main houses (30.7%) during night time which agrees with the reports of Halima, Addisu, Moreda & Mulgeta. A study conducted in western Kenya indicated a similar scenario where the majority of the households (73%) in the rural areas kept their chickens in the kitchen or in main houses.
In the study districts chickens were provided with supplemental feeds (98.7%), which is in line with those reported by Addisu [19], Melkamu & Tebikew, Mulgeta and Solomon [15]. Water is provided for chicken from different sources such as river (69.3%), Borehole (22.3%) and well (7.33%) which is also common scenario in various areas. The present study agrees with the findings of Nebiyu & Solomon [15] who noted river water as the major source for chickens. However, the current study disagrees with the reports of Wondu who found that tap water as the major source (92 %) for chickens reared in Nothern Gonder Zone of Amhara region. Thus, the current study suggests most of the rural society in the studied districts depends mainly on river, borehole or well water due to lack of tap water.
Production Constraints of Chickens in the Study Area
The major constrains of chickens in the study districts were predators (72.7%) and diseases (27.3%). This result agrees with the reports of Melkamu & Wube, Alem, Matiwos & Selamawit [21,22] where predators were reported to be the major problems in indigenous chickens reared in various parts of the country. In the current study, the types of diseases affecting chicken production were not included as farmers could not identify clearly the types of diseases affecting their chickens. However, the various types of predators which are reported in their scientific names and local languages such as Milvus migrants locally known as “Gace”, Helogale hirtula locally known as “Shiifoo” or “Wociwoco”, Leptailurvs serval locally known as “Hallaroo” and Felis silvestris locally known as “Kubbi Kullaaro” accounting 54.6, 24.4, 15.5, and 5.5 %, respectively, which are also reported in various parts of the country. As reported by Alem [21], Hawk, Genet, Wild cat, Fox and snake were found to be the most important predators occurred in the low and mid land agro-ecological zones of central Tigray. Similarly, as reported by Matiwos & Selamawit [22], Wild cats, Wild Egyptian vulture, Honey bagger and Snakes were being the most challenging predators in Amaro districts. Hence, the various types of predators observed in the current study and elsewhere might be due to the agro-ecological suitability of the country for predators.
Effective population size (Ne) and rate of inbreeding (ΔF)
To obtain some idea on the Ne and rate of inbreeding over generations, Ne was calculated based on the total chicken flocks of farmers who possessed their own breeding male and female chickens. The Ne in the current study ranged from 375 to 685 with the average Ne of 486 implying number of breeding individuals were comparatively low. According to Maiwashe, Ne is a measure of genetic variability within a population where large values of Ne indicate more variability and small values of Ne indicate less genetic variability. The low Ne estimated in the current study suggests that the breeding population might be too small. Even if neighbouring flocks were scavenging together, which gives an opportunity for breeding cocks to mating with hens, the number of cocks per flock is still considered lower than required.
Effective breeding population size and the corresponding ΔF reported by Nigussie [23] by considering the average mean flock size of chickens for Mandura, Horro and Konso, village chickens, Eskindir et al. (2013) from Jarso districts and Hailemichael [13] for Endamehari, Ofla and Raya- Azebo districts’ chicken population were in agreement with the present study. However, the report of Eskindir from Horro districts (3.73) was lower than the current study due to the fact that they considered the average flock size rather than taking the total number of chickens in computing both parameters, i.e., Ne and ΔF. However, the result reported by Hagan et al. (2013) from Ghana for Coastal, Forest and Guinea Ecological Zones which were 13.3, 11.3 and 12.9 respectively had three-fold higher than those reported in Ethiopia. The current study was also in a similar scenario with the result reported by Rusfidra [24].
The average rate of inbreeding (0.111%) in the current study was in good agreement with the reports of various scholars in the country. Hailemichael [13] reported 0.16, 0.15 and 0.14 rate of inbreeding for Endamehari, Ofla and Raya-Azebo districts of the chicken population, respectively. The rate of inbreeding reported by Eskindir falls in the range of 0.13 to 0.12 which is in line with the current study. The rate of inbreeding values reported by Hagan [25] was comparable with the observed values in Decha chicken populations. According to Henson, the acceptable level of inbreeding rate per generation is between 1% and 2%. Therefore, the rate of inbreeding obtained from the current study was low which suggests that chicken populations in the study area are not exposed to inbreeding [26-28].
Conclusion and Recommendations
The current study indicated scavenging as the major chicken production systems practised across all the study districts. Due to this reason the average annual egg production as well as total egg production throughout the life of the hens is very low. Indigenous chickens have long age of sexual maturity and long brooding period. The major production constraints were predators and diseases across the studied districts. Effective population size and inbreeding rate obtained in the present study indicates the chicken populations are not exposed for inbreeding. However, the distribution of exotic chicken breed has been increasing from time to time, which might lead for the loss of genetic resources in the future. Therefore, an adequate supplementary fedding, health care and housing should be carried out to improve production performances and protect them from predators and disease. In addition, conservation of indigenous chicken needs to be implemented before they have been diluted with exotic breeds.
Acknowledgement
The authors would like to acknowledge the Ministry of Agriculture and Natural resource, Mizan Agricultural, Technical, Vocational and Educational Training College, for their financial support during the research work. We further express our deepest gratitude for Kaffa Zone, Decha, Gimbo and Chena district Livestock and Fishery development offices for their kind support. Finally, we are also indebted to thank those farmers and development agents who participated in this study.
Conflict of interests
The author has not declared any conflict of interests.


