GIS-Based Assessment of Methane Emission from Livestock in India
Shilpi Kumari1*, Naik SN2 and Dahiya RP1
1 Centre for Energy Studies, Indian Institute of Technology Delhi, India
2 Centre for Rural Development and Technologies, Indian Institute of Technology Delhi, India
Submission: August 18, 2018; Published: September 17, 2018
*Corresponding author: Shilpi Kumari, Centre for Energy Studies, Indian Institute of Technology Delhi, New Delhi-110016, India, Tel:+91-9958633143 ; Email: shilpiddas.iit@gmail.com
How to cite this article: Shilpi K, Naik SN, Dahiya RP. GIS-Based Assessment of Methane Emission from Livestock in India. Dairy and Vet Sci J. 2018; 7(5): 555721. DOI: 10.19080/JDVS.2018.07.555721
Abstract
Livestock farming is a major source of livelihood in India, but also a potential source of greenhouse gases (GHGs) emission, particularly CH4. The present research provides a detailed spatial livestock mediated CH4 emission inventory covering all the districts and states of India. Results show, livestock CH4 emission in India is 15.3 Tg yr-1 with Banas Kantha (Gujarat) and Uttar Pradesh being the highest emission contributor at district and state level, respectively. Thus, monitoring and understanding spatial livestock distribution and its CH4 emission pattern is essential for policy design to ensure sustainable livestock farming and effective climate mitigation policies.
Keywords:Livestock farming; GIS; CH4 emission; Climate mitigation; India
Introduction
Climate change is altering the world ecosystems and threatening the comfort of current and future generations. To control the temperature, rise below 2° Celsius as envised in the Paris climate deal and avoid risky climate change, halt in global emissions is immediately required. With these growing concerns of the detrimental impacts of climate change, identification and controlling of potential sources of greenhouse gases (GHGs) emissions has become an international priority [1]. Main contributors of anthropogenic GHGs are CO2, CH4 and N2O, where agriculture is a major source of emission for last two GHGs [2,3]. The livestock sector is considered as one of the major anthropogenic sources of GHGs emissions [4,5]. Livestock production and environmental impacts are facing unprecedented challenges due to the growing economy and rapid demand for meat and dairy products [6]. This will be an important issue in coming decades to reduce GHGs emissions from livestock sector and to support economic services in a sustainable way [7]. Within the livestock farming, milk and meat production contribute significant amount of GHGs emissions.
Enteric fermentative digestion by ruminant animals is the world’s largest source of CH4 emissions [8]. The specific digestive system of ruminant animals such as cattle, buffalo, sheep, and goat are associated with high levels of CH4 production [9,10]. It is also estimated that 5.6–7.5 Gt CO2e GHGs yr–1 is emitted annually by livestock sector between 1995 and 2005 where the most important sources of emissions were enteric CH4 (1.6–2.7 GtCO2e yr–1) [11]. Among livestock group, cattle dominate (64–78%) the sector’s emissions [11]. However, livestock contribute significant part of the livelihoods of at least 1.3 billion poor people in rural households [12]. Despite the importance of livestock to the poor and the magnitude of the changes that are likely to be fall on livestock systems, the intersection of climate change and livestock in developing countries is a relatively neglected research area [13]. Environmental legislation and public concerns about the environmental footprint of livestock production operations have increased pressure on producers to adopt measures to reduce atmospheric and environmental pollution [14]. Worldwide initiatives such as the Kyoto Protocol demand that GHGs emissions should be reduced or at least prevented from further increase [15]. Monitoring and understanding the distribution of livestock in relation to production system at various geographical scales is essential for designing intervention to ensure sustainability of livestock production [16].
India, the world’s 2nd most populace country is also the world’s 3rd largest GHGs emitter, contributing ~7% of the global total [17]. To be effective and least cost, climate policy requires the reduction of emissions of all GHGs [18]. It is reported that Indian livestock sector emits significant GHGs, particularly in the form of CH4 [19,20]. In India, enteric CH4 emission is high due to two main reasons: large number of ruminant densities over large area and poor feeding management [21,22]. The Paris climate deal through its Intended Nationally Determined Contributions (INDC) also sought climate pledges from individual countries to devise domestic plans to reduce GHG emissions [23].
Assessment of GHGs emissions from the livestock sector and identifying the hot-spots of emissions as well as livestock population is pre-requisite for cost-effective emission reduction goals. The hot spot analysis can be helpful to minimize negative environmental impact of livestock production and design and implement more effective policy instruments for livestock farmers at different scales including local policy making. However, no assessment has been conducted in India to assess the geographical distribution of CH4 emission from livestock at small spatial units up to district level. Furthermore, district level partitioning of emissions among the different livestock groups (cattle, buffalo, goat, and sheep) and CH4 fluxes per capita and per geographical unit are also have not been previously studied. Aiming to fulfill this research gap, the present research is conducted in India on GIS platform to (i) assess district and state level CH4 emission from different livestock categories, (ii) per capita and per geographical area wise spatial distribution of livestock and CH4 emission, and (iii) identify livestock-mediated CH4 emission hotspots in India.
Methodology
The methodology is divided into three sections as shown in Figure 1. In summary, estimation of CH4 emission from livestock is based on the IPCC Tier 1 guideline [24]. The livestock population and CH4 emission is estimated at district, state and national level. In addition to CH4 emission, CH4 flux per capita and per unit geographical area are also calculated. The findings are then applied in the GIS (Geographical Information System) platform to map spatial distribution of CH4 emission in India.
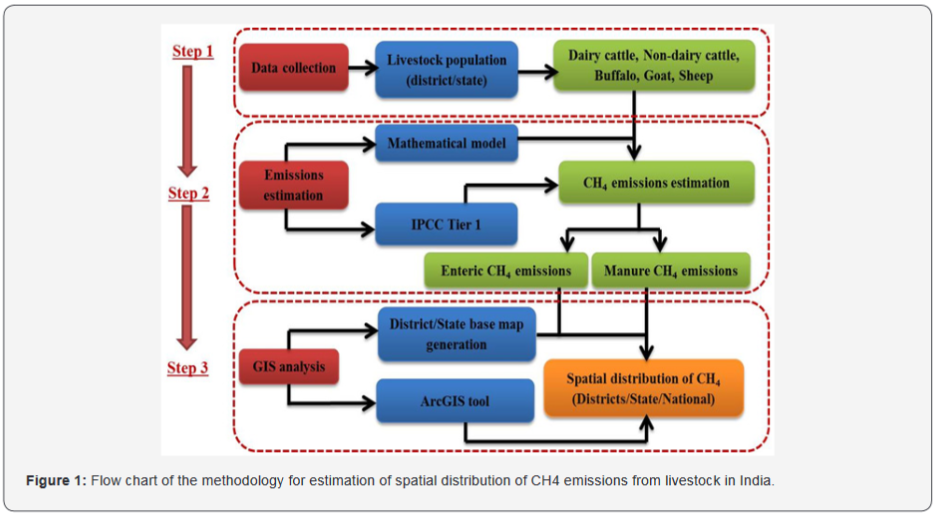
The first section of the method is comprised of livestock population database collection and associated CH4 emission estimation. Livestock population database are collected from the Department of Animal Husbandry and Statistics, India for year 2012 [25]. The collected livestock database of all the 28 states and 7 UTs covering 649 districts of India is divided into four categories viz. cattle, buffalo, goat and sheep. CH4 emission is estimated from enteric fermentation and manure management practices. The specific CH4 emission factor for each category of livestock as given in IPCC guidelines, 2006 (Table 1) both for enteric fermentation and manure management are used to further calculate livestock category-wise emission. Finally, the district-wise CH4 emission are summed together to estimate state-wise and national-level CH4 emission.

Per capita and per unit geographical area-based CH4 emission flux are calculated for each district of India considering district-wise human population and geographical area data available from the Census of India, 2011 [26]. The district wise CH4 emission fluxes are presented as GgCO2e CH4 km-2 and Gg CO2e CH4 capita-1. In third step, ArcGIS software is used to generate the spatial CH4 emission distribution map in India at district, state and national level. For a spatial map generation, standard images for different districts and states of India have been collected from the National Remote sensing Centre (NRSC), Government of India. Once the standard images of the district level map and state level map of India have been collected, CH4 emission is categorized in to different rank to generate CH4 emission. However, district level map is not available for Jammu and Kashmir. Therefore, it is represented at state level map.
Results
CH4 emissions from livestock (cattle, buffalo, goat and sheep) are estimated both from enteric fermentation and manure management processes at district, state and national level in India and the results are presented below.
CH4 Emission at National Level
Overall, livestock CH4 emission in India are estimated to be 15.3Tg CH4 on annual basis considering 2012 livestock population data as baseline. CH4 emission related to enteric fermentation and manure management are estimated to be 14.20Tg and 1.16Tg, respectively. Thus, it is observed that enteric fermentation contributes more than 90% of emissions. Among the livestock groups, in case of enteric fermentation, livestock category-wise emissions are 51% (7.25 Tg yr-1), 42% (5.97 Tg yr-1), 5% (0.68 Tg yr-1) and 2% (0.30 Tg yr-1) due to cattle, buffalo, goat and sheep, respectively. Similarly, in manure management practices, emission contribution of cattle, buffalo, sheep and goat are estimated at 0.59Tg yr-1 (50%), 0.43 Tg yr-1 (37%), 0.13 Tg yr-1 (11%) and 0.03 Tg yr-1 (2%), respectively (Figure 2).

CH4 Emission at State Level
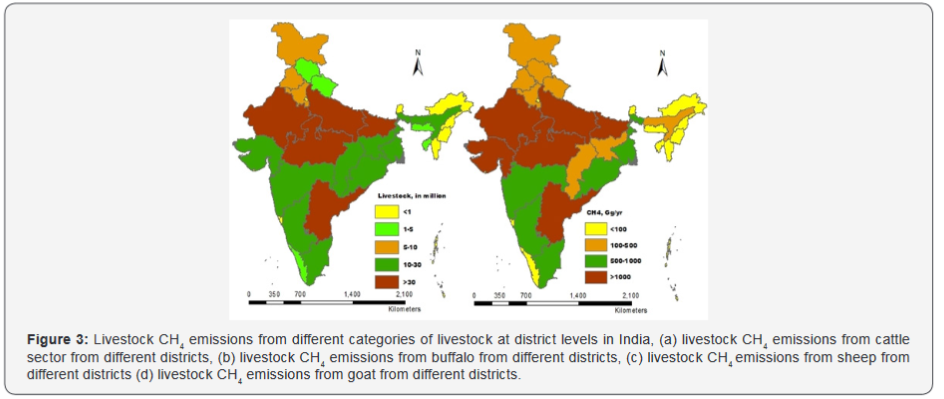
Among the 28 states and 7 Union Territories (UTs), the highest CH4 emission is observed in Uttar Pradesh (2746 Gg yr-1), followed by Rajasthan (1528 Gg yr-1) and Madhya Pradesh (1310 Gg yr-1). Spatial distribution of livestock and associated CH4 emission among the states are shown in Figure 3. It is observed from Figure 3 that Uttar Pradesh, Rajasthan, Madhya Pradesh, Gujarat, Andhra Pradesh and Bihar have annual livestock CH4 emission greater than 1000Gg. It is also observed that major emitting states are distributed in the western and Indo-Gangetic plains of India. In contrast, CH4 emission contributions from all the 8 north-eastern states are very less compared to other parts of the country.
CH4 Emission at District Level
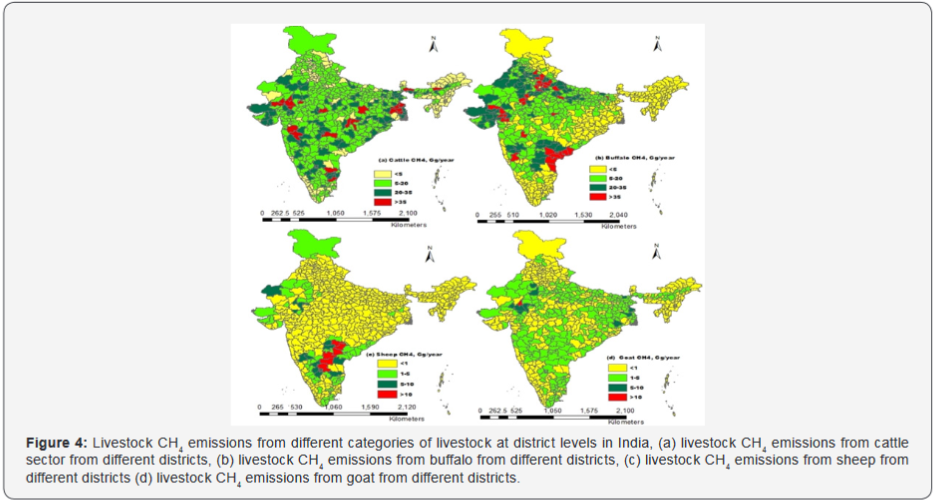
CH4 emission show significant variations among the districts of India as shown in Figure 4. The top 10 CH4 emitting districts are listed in Table 2 with other relevant information. The top 3 districts in terms of livestock-related CH4 emissions are Banas Kantha, Gujarat (112 Gg), Paschim Medinipur, West Bengal (103 Gg yr-1) and Jaipur, Rajasthan (102 Gg yr-1). Furthermore, out of the total 15.3Tg livestock CH4 emission in India, about 50% of the emission is contributed by 153 districts alone (out of total 649 districts). Within the 153 districts, out of the four livestock groups, maximum CH4 emission (more than 50%) is contributed by buffalo in 84 districts followed by cattle (55 districts).
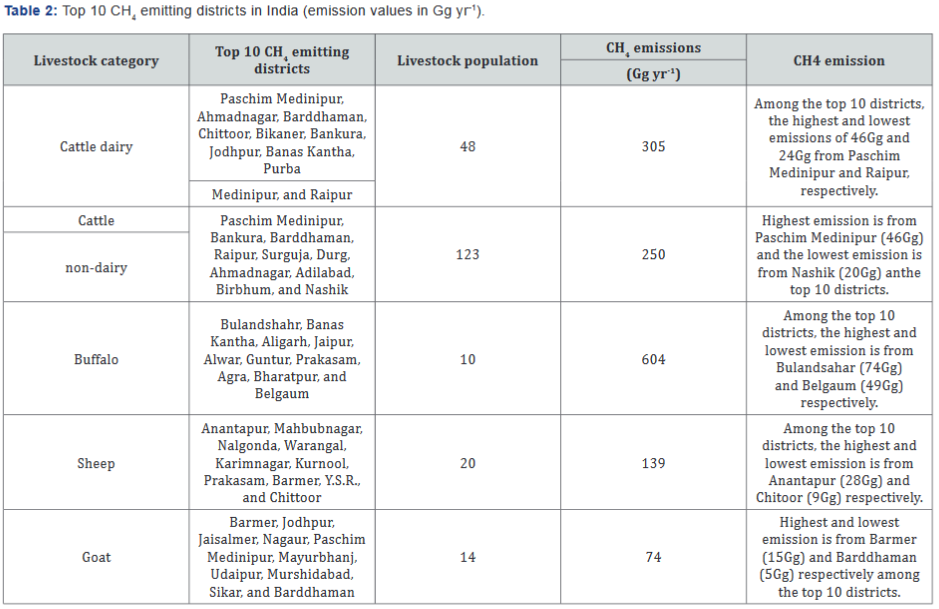
In case of cattle sector, Paschim Medinipur (West Bengal) shows the highest emission (91 Gg yr-1) among the districts in India. Similarly, at district level in buffalo, goat and sheep sectors, the highest CH4 emission are observed in Bulanshahar, Uttar Pradesh (73 Gg yr-1), Baran, Rajasthan (15 Gg yr-1) and Anantpur, Andhra Pradesh (27 Gg yr-1), respectively. Thus, this detail GIS-based representation of spatial distribution of livestock CH4 emission reveals that the highest emitting districts (emission > 50% of total CH4 emission) located in the states of Uttar Pradesh, Gujarat, West Bengal, Rajasthan, Andhra Pradesh, and Maharashtra (Table 2).
Spatial Distribution of Per Thousand and Per Unit Area Livestock CH4 Emission
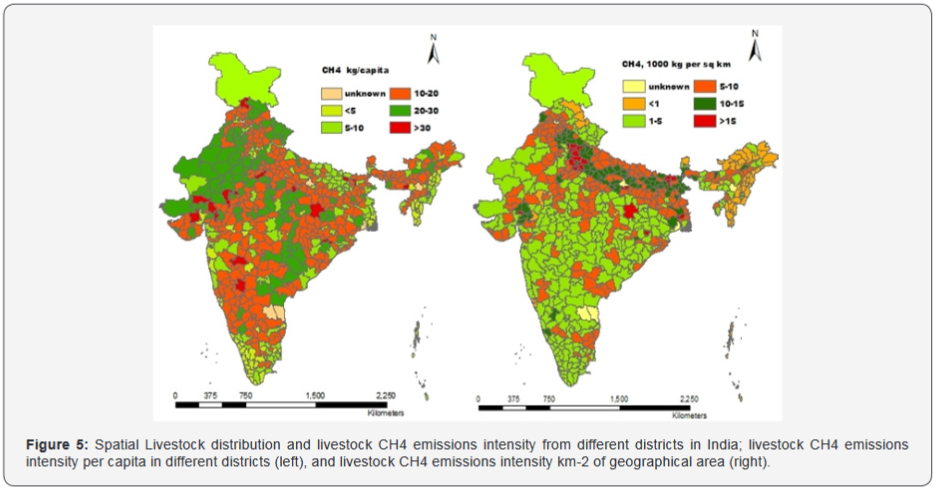
Results of district level spatial distribution of livestock and CH4 emission in terms of per geographical area and per thousand human populations is discussed below. At country average, CH4 emission per sq km of land area is 6.02ton km-2. At district level, the CH4 emission intensity ranges from the lowest of 1.8 × 10⁻³ton km-2 in Dibang Valley district of Arunachal Pradesh to highest of 42.35ton km-2 in Gandhinagar district of Gujarat (Figure 4). For nearly 38% of districts (more than 250 districts), the emissions intensity lies in the ranges of 1ton km-2 to 5 ton/ km-2 as shown in Figure 5. These districts are mainly located in Maharshtra, Madhya Pradesh, Orissa, Kerala, Rajasthan, and Tamilnadu and in some cases in Sikkim, Manipur, Assam. The maximum emission intensity (> 15ton km-2) is observed in 20 districts of India.
At country average, per capita CH4 emission in India is 12.71 kg capita-1. At district level, the intensity ranges between the lowest value of 2.4 × 10⁻² kg capita-1 in Delhi and highest of 119 kg capita-1 Surajguja district (Gujarat) (Figure 5). Maximum numbers of districts (250 districts) falls in the emission categories of 10-20 kg capita-1 (Figure 5). These districts are in the Madhya Pradesh, Maharashtra, Orissa, Tamil Nadu and some of the districts of Punjab, Rajasthan, Manipur, and Assam. On the other hand, the highest emission of > 20 kg capita-1 is observed for 16 districts.
It is observed that livestock farming is highly dynamic in India. The higher livestock CH4 emission regions are distributed along the middle gangetic plain, central plateau region, east coastal plains and western dry regions comprising some highly emission intensive districts and states (Uttar Pradesh, Bihar, Madhya Pradesh, Rajasthan, Andhra Pradesh and Tamilnadu). Livestock farming plays an important role in the economy of these states and districts. For example, in Rajasthan, more than 80% rural families linked with livestock farming and livestock farming contribute about 9.16% to the state GDP which is even greater than the national average GDP (~4%). Furthermore, about 35%-50% of the income to small and marginal farmers comes from the dairy and animal husbandry sectors. In Gujarat, about 5.19% state GDP is contributed by livestock. Considering the immense contribution of livestock farming to the rural economy of India, therefore, future livestock policies should deal CH4 emission reduction and sustainable livestock farming simultaneously and appropriately.
Conclusion
This study identifies that 50% of emission is contributed by 153 districts alone out of 15.3Tg. Major findings are
a. Cattle and buffalo are the major CH4 emitter (93%) than other livestock groups.
b. The top CH4 emitting states are Uttar Pradesh, Rajasthan and Madhya Pradesh.
c. The top emitting districts are Banas Kantha, Paschim Medinipur and Jaipur
d. CH4 emission intensity is 6.02ton km-2 and 12.71 kg capita-1.
Thus, livestock CH4 emission spatial distribution indicate the hotspots region of emission and these findings can be useful to develop districts or state level policy for sustainable livestock farming.
Acknowledgement
Shilpi Kumari is thankful to the University Grant Commission, Government of India for Senior Research Fellowship. Our special thanks to Dr. Moonmoon Hiloidhari for his help and support in manuscript preparation.
References
- IPCC (Intergovermental Panel on Climate Change) (2014) Climate change 2014. IPPC Fifth Assessment Report. Geneva, Switzerland, Europe.
- Carlsson Kanyama A, Alejandro D Gonzalez AD (2009) Potential contributions of food consumption patterns to climate change. Am J Clin Nutr 89(5): 1704 ̶ 1709.
- Havlikova M, Kroeze C, Huijbregts MAJ (2008) Environmental and health impact by dairy cattle livestock and manure management in the Czech Republic. Sci Total Environ 396(2-3):121-131.
- Bhatta R, Enishi O, Kurihara, M (2007) Measurement of methane production from ruminants. Asia-Aus J Anim Sci, 20(1): 1305–1318.
- Dhoubhadel SP, Taheripour F, Stockton MC (2016) Livestock demand, global land use changes, and induced greenhouse gas emissions. J Environ Protect7(7): 985-995.
- Steinfeld H, Gerber P (2010) Livestock production and the global environment: Consume less or produce better? Proc Natl Acad Sci 107(43):18237-18238.
- Kipling RP (2016) Modeling European ruminant production systems: facing the challenges of climate change. Agric Syst 147: 24–37.
- Golub AA, Henderson BB, Hertel TW, Gerber PJ, Rose SK, et al. (2013) Global climate policy impacts on livestock, land use, livelihoods and food security. Proc Natl Acad Sci 110(52): 20894–20899.
- Broucek J (2014) production of methane emissions from ruminant husbandry: A Review. J Environ Prot 5(15): 1482–1493.
- Sarkwa FO, Timpong Jones EC, Assuming-Bediako N, Aikins S Adogla- Bessa T (2016) The contribution of livestock production to climate change: a review. Livestock Research for Rural Development. 28: 3.
- Herrero M, Henderson B, Havlík P, Thornton PK, Conant RT, et al. (2016) Greenhouse gas mitigation potentials in the livestock sector. Nature Clim Change 6(5):451-461.
- Herrero M, Thornton Philip K (2013) Livestock and global change: Emerging issues for sustainable food systems. Proc Natl Acad Sci 110(52): 20878–20881.
- Thornton PK (2010) Livestock production: recent trends, prospects. Phil Trans R Soc B 365(1554):2853-2867.
- Massé DI, Jarret G, Hassanat F, Benchaar C, Saady NMC (2016) Effect of increasing levels of corn silage in an alfalfa-based dairy cow diet and of manure management practices on manure fugitive methane emissions. Agric Ecosyst Environ 221:109–114.
- Schulze ED, Valentini R, Sanz MJ (2002) The long way from Kyoto to Marrakesh: implications of the Kyoto Protocol negotiations for global ecology. Global Change Biol 8(6): 505-518.
- Franceschini G, Robinson TP, Morteo K, Dantale D, Wint W, et al. (2009) The global livestock impact mapping system (GLIMS) as a tool for animal health applications. Veterinaria Italiana 45(4):491-499.
- Pahuja N, Pandey N, Mandal K, Bandyopadhyay C (2014) GHG mitigation in India: an overview of the current policy landscape. Working Paper. Washington, USA.
- Waldhoff S, Anthoff D, Rose S, Tol RSJ (2011) The marginal damage costs of different, greenhouse gases: an application of FUND. Economics 2014: 31.
- Sharma SK, Choudhury A, Sarkar P, Biswas S, Singh A, et al. (2011) Greenhouse gas inventory estimates for India. Current Sci101:405 ̶ 415.
- Kumari S, Dahiya RP, Naik SN, Hiloidhari M, Thakur IS, et al (2016) Projection of methane emissions from livestock through enteric fermentation: A case study from India. Environ Dev 20: 31-44.
- Swamy M, Bhattacharya S (2006) Budgeting anthropogenic greenhouse gas emission from Indian livestock using country-specific emission coefficients. Curr Sci 91: 1340-1353.
- Pathak H, Upadhyay RC, Muralidhar M, Bhattacharyya P, Venkateswarlu B (2013) Measurement of greenhouse gas emission from crop, livestock and aquaculture. Indian Agricultural Research Institute, New Delhi, India, pp. 101.
- Conference of the Parties, 21 sessions, Paris, 30 November to 11 December 2015. United Nations FCCC/CP/2015/L.9/Rev.1.
- IPCC (2006) IPCC Guidelines for national greenhouse gas inventories, prepared by the National Greenhouse Gas Inventories Programme, Eggleston HS, Buendia L, Miwa K, Ngara T, and Tanabe K (Eds.), Published IGES, Japan.
- BAHS (2014) Ministry of Agriculture and Farmers Welfare Department of Animal Husbandry, Dairying and Fisheries. India.
- GoI (2012) Office of the Registrar General & Census Commissioner, India Ministry of Home Affairs, Government of India.


