


Abstract
Keywords:Hemodynamics; Therapeutic; Physiological; Inherently; Vasoconstriction; Hypoperfusion
Introduction
The management of the hemodynamically unstable-or potentially unstable-patient is no simple task, yet clinicians across many departments face this challenge daily. Despite considerable advances in monitoring technologies and physiological understanding, the vast majority of resuscitation efforts worldwide still rely primarily on simple metrics such as mean arterial pressure (MAP). While undeniably important, MAP represents a limited physiological endpoint; by itself, it neither captures the complexity of circulatory function nor provides reliable guidance when used in isolation. A more sophisticated approach incorporates dynamic assessments, most often centred on fluid responsiveness. Although this strategy improves upon targeting vital signs alone, it remains incomplete. Our group recently published a holistic framework for hemodynamic assessment that incorporates the four circulatory interfaces at which derangement may occur (Figure 1) [1]. This model re-orients the clinician toward evaluating tissue perfusion rather than focusing narrowly on vital signs or MAP, and emphasizes the need for integrated hemodynamic monitoring capable of identifying where along the circulatory continuum dysfunction resides-and thereby how to target therapy more precisely.
Discussion
All MAP’s Are Not Created Equal
Mean arterial pressure is generated by the interaction of three primary determinants: the volume of blood contained within the arterial tree, arterial elastance, and stroke volume. As such, MAP may rise or fall through changes in stroke volume, vascular tone, or both. Because tissue perfusion occurs distal to the arterial treeafter the arteriolar resistors-the relationship between MAP and tissue perfusion is inherently non-linear [2]. Within the framework of the interface model, Interface 2 (arteriolar–capillary) may be uncoupled through excessive vasoconstriction even when MAP appears normal or elevated [3]. Stroke volume reflects both preload and contractility, further highlighting that MAP alone gives an incomplete picture of circulatory sufficiency. Although MAP provides a necessary pressure head for organ blood flow, how MAP is generated carries significant clinical implications. For example, a patient with cold extremities, mottling, and poor peripheral perfusion, yet with an “acceptable” MAP, is highly unlikely to benefit from additional vasopressor therapy. In such cases, vasoconstriction is already excessive, and further increases may worsen tissue perfusion despite maintaining systemic pressure [4]. This underscores the importance of evaluating all four circulatory interfaces when selecting therapy. Similarly, whether in the intensive care unit or in the operating room, clinicians must monitor for deterioration along these physiological quadrants to appropriately manage haemodynamic instability [5].
Monitoring The Patient: Hemodynamic Trajectory
Beyond identifying the source of circulatory abnormality, clinicians must monitor a patient’s response to therapy within a framework centred on tissue perfusion. The four-quadrant diagram originally described by Forrester and later adapted by Kenny provides an elegant model (Figure 2).


On the X-axis, one plots stroke volume or cardiac output; on
the Y-axis, a measure of congestion.
Quadrant I – “Warm and dry”: optimal physiology.
Quadrant II – “Warm and wet”: adequate perfusion with
congestion.
Quadrant III – “Cold and dry”: hypoperfusion without overt
congestion.
Quadrant IV – “Cold and wet”: hypoperfusion with congestion.
Tracking patient movement across these quadrants provides a physiologically grounded representation of the clinical trajectory, integrating both flow and congestion-far more informative than MAP or heart rate alone.
Upgrading Existing Technology at The Bedside to Incorporate an Integrated Hemodynamic Approach
modern monitors contain an extraordinary wealth of information, yet clinicians typically use only a fraction of this data. Much can be extracted from the arterial waveform alone; additional insights arise when integrating central venous pressure, heart rate, and-for patients with pulmonary artery catheters-even more advanced variables. While certain commercial technologies offer partial integration of these variables, they rarely incorporate them within a truly holistic physiological framework and often involve significant financial cost.
We propose that the next stage in monitoring development
should be the creation of smart monitors capable of:
1) Plotting a patient’s clinical trajectory dynamically on a
physiological four-quadrant map (flow vs. congestion).
2) Helping identify which circulatory interface (1–4) is
deranged.
3) Providing decision support that aligns therapy with
restoring perfusion rather than simply normalizing MAP.
4) Being available for any patient connected to a bedside
monitor.
5) The capability to seamlessly integrate other information
provided by the clinician not available from the monitor itself,
such as point of care ultrasound metrics, capillary refill time, etc.
Such systems would enhance care quality, potentially improve survival, and reduce preventable instability while also prompting clinicians toward deeper diagnostic evaluation, often including point-of-care ultrasound and physical examination.
Current Research Protocol: Deriving a Bedside Coupling Trend from The Arterial Waveform
Our group (ResusCare AI, Bangalore, India) is developing a continuous hemodynamic index to trend ventricular–arterial coupling in critically ill patients using existing arterial line data. This coupling trend aims to reflect the evolving balance between ventricular contractility (Ees) and effective arterial load (Ea) without requiring volumetric measurements.
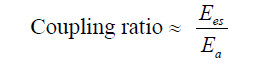
Mathematical Framework- The relationship between ventricular and arterial elastance can be expressed as:
Since true elastance measurements are impractical at the bedside, we approximate this ratio using arterial waveform– derived surrogates:
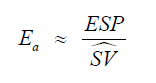
where ESP is the end-systolic pressure (approximated by the pressure at the dicrotic notch or 0.9 × SBP if the notch is indistinct) and ŜV is an estimated stroke volume surrogate obtained from the systolic area under the pressure curve (AUC_sys).
Substituting these surrogates, the dynamic coupling ratio becomes:
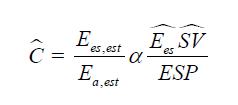
Because absolute Ees cannot be directly calculated from the pressure waveform, we normalize each patient to their baseline and focus on directional change (Δ) rather than absolute magnitude. Thus, the coupling index reported is a relative, dimensionless trend. Interpretation - A positive trend suggests improving ventricular–arterial interaction (higher Ees or reduced Ea), while a negative trend suggests mismatch due to either contractile failure or excessive afterload. The measure is intended as a within-patient, directional index rather than an absolute ratio and may provide early physiologic feedback on vasoactive or inotropic interventions.
Proposed Prospective Observational Cohort Study
We are undergoing a study in a setting of a tertiary ICU with invasive arterial waveform monitoring in adult patients with septic shock requiring vasopressors and arterial line monitoring. Sample Size Estimation of 100 patients for a 2-group comparison (hemodynamic responders vs. non-responders). Data Collection Timeline T0: Within 1 hour of vasopressor initiation, T1: 6 hours, T2: 12 hours, T3: 24 hours, T4: At vasopressor discontinuation or 48 hours Primary outcome measures of vasopressor-free days at day 7 and secondary outcomes of lactate clearance at 6 and 24 hours, ICU mortality, coupling ratio trend classification, ↑(Ees): Improving contractility, ↓(Ea): Reducing afterload, ↓(Ees): Worsening contractility, ↑(Ea): Increasing afterload. Clinical Relevance - this study aims to validate a bedside-friendly, waveform-derived coupling metric that integrates both pressurevolume analogs and timing physiology. If successful, it could enable real-time, non-invasive tracking of cardiovascular efficiency and guide titration of vasopressors and inotropes.
Conclusion
The Next stage in hemodynamic monitoring will be defined not by new sensors but by the intelligent integration of existing data into physiologically meaningful diagnostic and therapeutic tools. With relatively modest software enhancements, bedside monitors can evolve into dynamic platforms that track hemodynamic trajectories, identify the locus of circulatory failure, and guide clinicians toward perfusion-centered resuscitation. This shift holds the potential to transform both monitoring and therapy at the bedside. The authors also urge researchers to focus their time and efforts on trialing holistic and integrative hemodynamic approaches rather than continuing to rely on oversimplified metrics that correlate poorly with tissue perfusion. The next step in precision medicine is, in fact, precision dynamics and precision monitoring-an evolution that aligns therapeutic decision-making with the reality of how perfusion is generated, maintained, and sometimes fails in critically ill patients.
References
- Rola P, Kattan E, Siuba MT, Haycock K, Crager S, et al. (2025) Point of view: a holistic four-interface conceptual model for personalizing shock resuscitation. J Pers Med 15(5): 207.
- Beaubien-Souligny W, Benkreira A, Robillard P, Bouabdallaoui N, Chassé M, et al. (2020) Quantifying systemic congestion with point-of-care ultrasound: development of the venous excess ultrasound grading system (VExUS). Ultrasound J 12(1): 16.
- Rola P, Miralles-Aguiar F, Argaiz E, Haycock K, Spiegel R, et al. (2021) Clinical applications of the venous excess ultrasound (VExUS) score: conceptual review and case series. Ultrasound J 13(1): 32.
- Forrester JS, Diamond G, Swan HJC, Chatterjee K, Parmley WW, et al. (1976) Medical therapy of acute myocardial infarction by application of hemodynamic subsets. I. N Engl J Med 295(24): 1356-1362.
- Magder S (2018) The meaning of blood pressure. Crit Care 22(1): 257.


