



 IJESNR Home




Comprehensive Assessment of Heavy metal Contamination in Drinking Water of District Morena (Madhya Pradesh, India)
Alka Varshney1* and Dr. DK Sharma2
1Assistant Professor Zoology, SMS Govt. Model Science College Gwalior, India
2Professor of Zoology, SMS Govt. Model Science College Gwalior, India
Submission: October 02, 2026;Published: October 22, 2026
*Corresponding author: Alka Varshney, Assistant Professor Zoology, SMS Govt. Model Science College Gwalior, India
How to cite this article: Alka Varshney, Dr. DK Sharma. Comprehensive Assessment of Heavy metal Contamination in Drinking Water of District Morena (Madhya Pradesh, India). Int J Environ Sci Nat Res. 2026; 37(4): 556470. DOI: 10.19080/IJESNR.2026.37.556470
Abstract
Heavy metal contamination in drinking water is a global challenge as it is a matter of serious concern for environmental quality and human health. Human beings can be exposed to heavy metals primarily through water consumption. These heavy metals have a tendency of bio accumulation and can induce cancer and various health related issues. The general objective of the study was to analyze the heavy metals status in drinking water of urban areas in district Morena. The results revealed that Iron, manganese and zinc were commonly present in all drinking water samples, lead was detected in Morena city, Sabalgarh, Banomore, and in Kailaras. Cadmium was found in Sabalgarh and in Banmore, but arsenic was found below detectable limit in District Morena. According to the indices, the drinking water quality of District Morena was under limit in terms of heavy metals as per BIS standards but it can be increased in future, if necessary, measures are not taken. The results showed municipal tap water exhibited lower heavy metal levels in comparison to the ground water. This study revealed need for strengthening continuous monitoring, improved water treatment technologies, and integrated pollution-prevention strategies, especially disposal at point of origin to reduce heavy metal contamination in drinking water.
Keywords: Bioaccumulation; Cancer; Pollution-prevention strategies; Heavy metal contamination
Introduction
Heavy metal is a metallic chemical element that has a relatively high density (greater than 5 grams per cubic centimeter, about five times, than the density of water), high specific gravity or atomic weight and can be toxic even at low concentrations. They may be essential trace elements (toxic at high levels) like- zinc, copper, manganese and iron or they may be toxic elements with a biological role, like lead, mercury, cadmium and arsenic [1]. The groundwater is vulnerable to substantial metal contamination due to geogenic and anthropogenic exercises, like mining, agricultural run-off, poor wastewater supervision, from the eroded pipeline system [1]. Contamination of drinking water by heavy metals is a matter of serious concern because of their tendency to get assimilated (bioaccumulation) in different tissues of human body [2]. District Morena is a predominantly agrarian area, mainly dependent on groundwater resources and widespread use of fertilizers and pesticides heighten the vulnerability of groundwater to contamination, including heavy metals. As groundwater (hand pumps, tube wells, and bore wells) is the primary source of drinking water used often without adequate treatment. Limited municipal water supply infrastructure and irregular monitoring exacerbate the risk of contaminated water.
Material and Methods
Study area
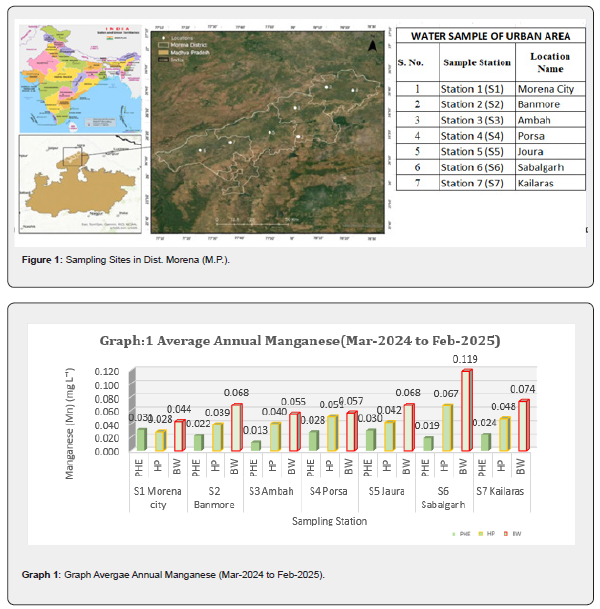
District Morena is in north Madhya Pradesh at 25o22’ to 26o52’ N latitude and 77o10’ to 78o42’°E longitude. The ground water table of Morena city has been from around 120-180ft. Climate is semi-arid. The total area of Morena is 4989.78Sq. km. According to 2011census [3] the population of Morena is 1965137. Morena experiences extreme weather conditions, the summer temperature ranges from 45°C to 48°C where in the winter temperature ranges from 4°C to 1°C. The average rainfall in Morena varies from 430mm to 753.7mm and the maximum rainfall is received during southwest monsoon period (June to September). The geology of the district consists mainly of alluvial deposits, sandstones, shales, and limestone formations which play a significant role in determining groundwater chemistry, including the mobilization of heavy metals. All 7 Tehsil places (of urban areas) in Dist. Morena were selected for this study. They were depicted as-Sampling Station 1(S1)-Morena city, Sampling Station2(S2)- Banmore, Sampling Station3(S3)-Ambah, Sampling Station 4(S4)-Porsa, Sampling Station 5(S5)-Joura, Sampling Station 6(S6)-Sabalgarh, Sampling Station 7(S7)-Kailaras. From every site sample of municipal tap water, hand pump water and bore well water were collected in triplicate. Average of which was mentioned in tables. Study period was from March 2024 to February 2025 (Figure 1).
Polyethylene Bottles were used which were properly labeled with sample number, cleaned with 5% nitric acid, rinsed with distilled water and allowed to dry before use. At sampling stations bottles were rinsed with sample water also. Hand pumps and tube wells were permitted to flow continuously for around 10 minutes before sample collection, and they were placed immediately in dark boxes for examination in the laboratory (within 4 hours of collection). In the laboratory they were filtered with Whatman filter paper No. 42 and acidified with 2ml of conc. Nitric acid per litre of filtrate water. This minimized precipitation and adsorption to the container walls. The samples were further preserved for digestion. After digestion the water samples were analyzed for specific heavy metal using the Atomic Absorption Spectrophotometric (GFAAS-Model- Perkin Elemer AAnalyst 700) method at specific wavelengths and quantified by the methods of American Public Health Association (APHA 2023) 24th Edition [4].
Result and Discussion
During study, it was observed that heavy metals were present in the water of Dist. Morena. The average of one year study of (all the three seasons) was given in the table and graphs (Table 1 & 2).
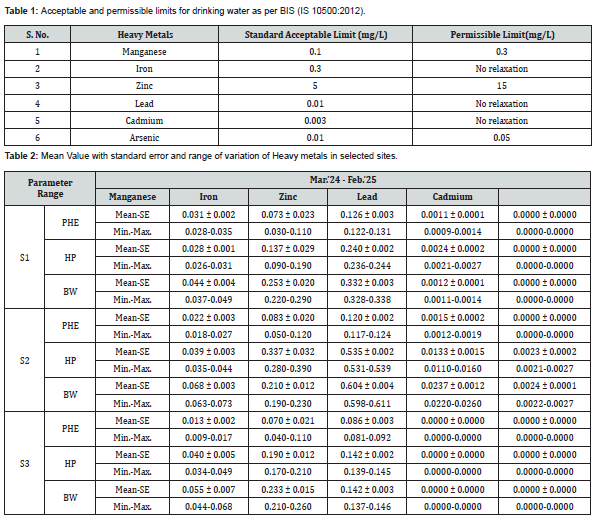
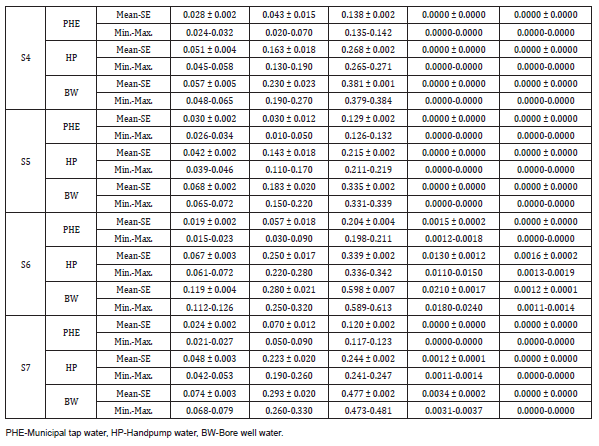
1) Manganese: It is vital trace element because deficiency can create skeletal deformities, issues with growth, and anemia. Its excess can cause neurological problems like impaired cognitive ability, but its excess intake may lead to neurotoxicity [5]. In tap water manganese was observed from 0.009 to 0.035mg/L (highest -Morena city, lowest –Ambah). Manganese was found from BDL to 0.234µg/L in Lebanon [6], which was low in comparison to the present study.In hand pump water it was observed from 0.026 to 0.072mg /L (highest –Sabalgarh, lowest -Morena city), for bore well water from 0.037 to 0.126m/L (highest-Sabalgarh, lowest -Morena city). Range and Mean values of manganese for all the sampling stations with standard error were given in Table no. 2 and in graph no.1. All the values were below the permissible limit of BIS. In ground waters in Dhaka, Bangladesh manganese was reported from 0.0030–0.4130mg/L [7], in Ramdhuni, Nepal from 0.09 to 1.49mg/L [8], in Bihar, from139.9 to 1232µg/L [9]. All these values were high in comparison to the present study. Values were observed in Pakistan from 0.0634 to 0.3199mg/L [10], from 50.0 to 2020µg/L in southeastern Bangladesh [11], from 6.35 to 2339.90µg/L in Yamuna River flood plain Delhi [12]. These values were almost like the present study (Graph 1).
2) Iron: Iron in water depends on geological weathering of iron-bearing minerals in aquifer, redox conditions, climatic characteristics, land use, and water supply infrastructure. Excess of it affects liver, cardiovascular system and kidneys [13]. In tap water it was observed from 0.01 to 0.12mg/L (highest-Banmore, lowest-Jaura). In Montevideo Uruguay values were found from 11.1 to 26.3µg/L [13], from1.130µg/L in Lebanon [6], almost similar to the present study. For hand pump water it was ranged from 0.09 to 0.39mg/L (highest –Banmore, lowest- Morena city), for bore well water from 0.15 to 0.33mg/L (highest -Kailaras, lowest – Jaura). All the values were in limit as comparison to the BIS. except hand pump water in Banmore where high iron level 0.39mg/L (in comparison to BIS) was observed, but it may be because of corrosion of old iron pipes. Range and Mean values of iron for all the sampling stations with standard error were given in table no.2 and in graph no.2. In Ramdhuni Municipality Nepal, iron values were observed from 0.05 to 1.4mg/L [8], almost similar to the present study, in Yamuna River flood plain Delhi from 112.61 to 15708.11µg/L [12], higher in comparison to the present study (Graph 2).
3) Zinc-Zinc is one of the important and mobile elements in the heavy metals which is present not only in dissolved forms but is also associated with suspended particles [14]. Many sources including geological mineral dissolution, corrosion of plumbing systems, industrial-municipal wastes, agricultural runoff can increase its level [15]. In the present study for tap water zinc was estimated from 0.081mg/L to 0.211mg/L (highest-Sabalgarh, lowest-Ambah). In tap water in Montevideo, Uruguay zinc was detected from 31.9–204.9µg/L [13] and in Lebanon from 50.00µg/L [6], almost like the present study. For hand pump water it was ranged from 0.139 to 0.539mg /L (lowest-Ambah, highest –Banmore), for bore well water from 0.137 to 0.613mg/L. (highest- Sabalgarh, lowest -Ambah). All the values are under acceptable limit of BIS. Range and Mean values of zinc for all the sampling stations with standard errors were given in table no.2 and in graph no.3. In Bihar, India values of zinc were observed from 2.8–108.20µg/L [9], low in comparison to the present study, in Pakistan from 0.05–0.65mg/L [10], in Yamuna Flood Plains New Delhi, India from BDL to 363.40µg/L [12]. All these studies showed almost similar results to the present study (Graph 3).
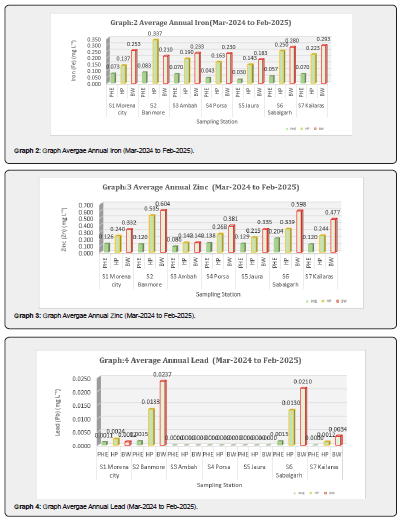
4) Lead: Lead is present in earth crust naturally, it can leach into tap water through the corrosion of plumbing materials, brass, galvanized pipes, and solder, mining, batteries, industrial, anthropogenic and agricultural activities [16]. Lead has ability to bioaccumulate in the human system, leading to Pb toxicity [17]. Lead was found below detectable limit in Ambah, Porsa and Jaura sampling stations (Limit of Detection was 0.06ppb or 0.06µg/L for GFAAS Perkin Elmer AAnalyst700). In tap water lead was observed in Morena city, Banmore, Sabalgarh and Kailaras from 0.0009 to 0.0019mg/L (highest –Banmore, lowest-Morena city). Lead was observed in tap water in Ethiopia from 0.360 to 146.1µg/L [16], from 0.013 to 53.80mg/L µg/L in Lebanon [6], higher in comparison to the present study. In hand pump water and in bore well water lead was observed in Morena city, Banmore, Sabalgarh and Kailaras from 0.0011 to 0.016mg/L (highest –Banmore, lowest –Kailaras) and from 0.0011 to 0.026mg/L (highest –Banmore, lowest- Morena city) respectively. Range and Mean values of lead for all the sampling stations with standard errors were given in table no.2 and in graph no.4Values of lead were slightly high in Banmore and Sabalgarh in comparison to BIS. Beelpura, Milavali, Tilangana, Niravali, Zinavali and Banmor gaon had shown variation from 0.022 to 0.056mg/l an average 0.038±0.01, 0.103 to 0.503mg/l an average 0.239±0.13, 0.162 to 0.185mg/l an average 0.174±0.007, 0.049 to 0.084mg/l an average 0.070±0.011, 0.041 to 0.061mg/l an average 0.051±0.006 and 0.009 to 0.012mg/l an average 0.010±0.001 respectively [18], in Bihar, India from 0.59 to 8.4µg/L [9], in Yamuna Flood plains New Delhi, India from BDL to 46.32µg/L [12] (Graph 4).
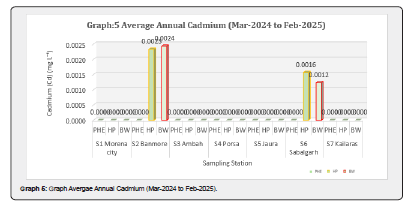
5) Cadmium-Cadmium has tendency of bio accumulation so prolonged exposure may result in renal damage, as it has detrimental effects on kidney function [19]. It can cause bone demineralization, resulting in osteoporosis. Cadmium is a carcinogen, which can elevate lung and prostate cancer [20]. Cadmium was found only in Banmore and Sabalgarh and in remaining all other sampling stations it was found below detection limit (BDL, Limit of Detection 0.003ppb or 0.003µg/L for GFAAS Perkin Elmer AAnalyst700) In hand pump water it was ranged from 0.0013 to 0.0027mg/L. (lowest-Sabalgarh, highest -Banmore). In bore well water it was ranged from 0.0011 to 0.0027mg/L (lowest- Sabalgarh, highest-Banmore). Range and Mean values of zinc for all the sampling stations with standard error were given in table no.2 and in graph no.5.Level of cadmium was observed in Banmor gaon from 0.028mg/L to 0.68mg/L with mean 0.046±0.012 from Tilangana, 0.023mg/L to 0.66mg/L with mean 0.047±0.013 from Niravali, 0.034mg/L to 0.064mg/L with mean 0.049±0.009 [18] high in comparison to the present study. In Bihar, India from 0.030 to 0.12µg/L [9], in Pakistan from 0.00023 to 0.0014mg/L [10], in Yamuna flood plains New Delhi, India from BDL to 0.20µg/L [12], in Narayanganj area Dhaka from (0.00030 ± 0.00013mg/L) [21]. All these values were almost similar to the present study (Graph 5).
6) Arsenic-Arsenic is a metalloid which is widely distributed in rocks, soil, water and air. It was classified in Group A -human carcinogen [20]. In more than 70 countries all over the world Arsenic was reported in groundwater above the WHO acceptable limits [22]. In the present study arsenic was found below detectable limit (Limit of Detection, LOD 0.20ppb or 0.20µg/L for GFAAS Perkin Elmer AAnalyst700) in all the samples. In Lebanon in tap arsenic was detected from BDL to 0.161mg/L [6]. In Bihar, India in ground water from 6.250 to 135.0µg/L [9] All these values were high in comparison to the WHO limits [23]. In Dhaka metropolitan city, Bangladesh from BDL to 0.69µg/L [7], in Ramdhuni Municipality Nepal from 0.005 to 0.1mg/L [8]. All these values were below WHO limits.
Conclusion
Findings in this study concluded that heavy metals (Iron, Zinc, and Manganese) were under permissible limit and Arsenic was found below detectable limit in all sampling stations of District Morena, while Cadmium and Lead were present only in few sampling stations (that too are also under limit of BIS). But the concentration may scale up due to pollution and leaching heavy metals in ground water, especially in industrial areas like Banmore and Sabalgarh that can cause adverse effects on the health of residents. So, measures should be taken to control the dispersion of heavy metals into the ground water. In tap water generally lower metal concentrations were observed in comparison to groundwater; however, lead, iron and manganese level can be exceeded due to inadequate monitoring of corrosion and aging pipelines. Groundwater was more protected but geological influences and geochemical processes, substantial anthropogenic pressures such as mining, industrial discharge, agricultural runoff, and improper waste disposal can elevate level of heavy metals resulting in serious health problems. So, the findings of the present study highlighted need to strengthen water safety measures, routine monitoring, improved treatment technologies and to address pollution at the source. Continuous surveillance, risk assessment studies and reconciliation of analytical approaches are imperative so that evidence-based policy decisions can be taken to safeguard public health.
Acknowledgement
The authors are thankful to Dr. Sarita Shrivastav, Principal, SMS. Govt. Model Science College, Gwalior (M.P.) to provide the necessary facility to do research work.
References
- Mirzaei N, Kalteh S, Zamani-Badi H, Moradpour H, Parmoozeh Z, et al. (2023) Estimating human health risks associated with heavy metal exposure from bottled water using Monte Carlo simulation. Heliyon 9(10): e20647.
- Zaimee MZA, Sarjadi MS, Rahman ML (2021) Heavy Metals Removal from Water by Efficient Adsorbents. Water 13(19): 2659.
- Census of India 2011 - Madhya Pradesh - Series 24 - Part XII B - District Census Handbook, Morena India, 2014, Reference ID DH_2011_2302_PART_B_DCHB_MORENA Producer(s) Directorate of Census Operations, Madhya Pradesh.
- APHA, AWWA, WEF (2023) Standard Methods for the Examination of Water and Wastewater (24th edn). American Public Health Association/American Water Works Association/Water Environment Federation. Lipps, W., Ellen Burton Braun-Howland, Terry E. Baxter.
- Baj J, Flieger W, Barbachowska A, Kowalska B, Flieger M, et al. (2023) Consequences of Disturbing Manganese Homeostasis. Int J Mol Sci 24(19): 14959.
- Eddine NN, Noisel N, Dieme D, Asmar MK, Issa ST, et al. (2022) Multi-matrix biomonitoring approach to assess exposure to metals and trace elements in the Lebanese population and associations with drinking water consumption. Environ Res 214(Pt 3): 113982.
- Sharmin S, Mia J, Miah MS, Zakir HM (2020) Hydrogeochemistry and heavy metal contamination in groundwaters of Dhaka metropolitan city, Bangladesh: Assessment of human health impact. Hydro Research 3: 106-117.
- Shrestha H, Maharjan J, Shah SK, Bhattarai A (2026) Assessment of drinking water quality in Government Schools of Ramdhuni municipality, Nepal. Journal of Institute of Science and Technology 31(1): 277-290.
- Kumar M, Rahman MM, Ramanathan AL, Naidu R (2016) Arsenic and other elements in drinking water and dietary components from the middle Gangetic plain of Bihar, India: Health risk index. Sci Total Environ 539: 125-134.
- Iqbal Z, Abbas F, Mahmood A, Ibrahim M, Gul M, et al. (2021) Human health risk of heavy metal contamination in groundwater and source apportionment. Environ Sci Technol (19): 7251-7260.
- Rahman A, Siddique AB, Khan R, Reza AHMS, Khan AHAN, et al. (2024) Mechanism of arsenic enrichment and mobilization in groundwater from southeastern Bangladesh: Water quality and preliminary health risks assessment. Chemosphere 294: 133556.
- Aithani D, Jyethi DS, Siddiqui Z, Yadav AK, Khillare PS (2020) Source apportionment, pollution assessment, and ecological and human health risk assessment due to trace metals contaminated groundwater along urban river floodplain. Groundw Sustain Dev 11: 100445.
- Ravenscroft J, Roy A, Queirolo EI, Mañay N, Martínez G, et al. (2018) Drinking water lead, iron and zinc concentrations as predictors of blood lead levels and urinary lead excretion in school children from Montevideo, Uruguay. Chemosphere 212: 694-704.
- Dubey, Sharma HK, Khare RK (2017) Removal of Zinc and Lead from Aqueous Solution using Low-Cost Bioadsorbent Pennisetum glaucum (Bajara Husk). Adv Biores 89(4): 188-196.
- Kantola M, Purkunen R, Kröger P, Tooming A, Juravskaja J, et al. (2000) Accumulation of cadmium, zinc, and copper in maternal blood and developmental placental tissue: differences between Finland, Estonia, and St. Petersburg. Envi Rese 83(1): 54-66.
- Endale YT, Ambelu A, Sahilu GG, Mees B, Laing GD (2021) Exposure and health risk assessment from consumption of Pb contaminated water in Addis Ababa, Ethiopia. Heliyon 7(9): e07946.
- Hong YC, Lee AH, Kim MG (2023) Chronic lead exposure and its health effects on adults: Evidence from epidemiological studies. Environ Res Public Health (20): 389.
- Sharma M, Bhardwaj S (2022) Water Quality Characterization of Some Village adjoin with Rairu Industrial Belt; District Gwalior (M.P.) With Reference to Heavy Metals. Int J Environ Sci Nat Res 31(3): 556313.
- Liu J, Yan LJ (2021) Cadmium-induced kidney injury: Oxidative damage as a unifying mechanism. Biomol 11(11): 1575.
- Environment Protection Agency.
- Firdaws SJ, Karim R, Begum F, Rabbi RH, Hossain KA, et al. (2026) Human health risk status of groundwater in slum areas located in Dhaka-Narayanganj city of Bangladesh. J of Bangla Acad of Sci 50(2): 283-298.
- Shaji E, Santosh M, Sarath KV, Prakash P, Deepchand V, et al. (2021) Arsenic contamination of groundwater: A global synopsis with focus on the Indian Peninsula. Geosci Front 12(3): 101079.
- World Health Organization (2022) Guidelines for Drinking-Water Quality: Fourth Edition Incorporating the First and Second Addenda; World Health Organisation: Geneva, Switzerland.