


Evaluation of Soil Heat Transfer in Relation to Climate Variability across Umudike, Abia State, Nigeria
Onwuka BM1*, Oguike PC2 and Nwagbara MO1
1Department of Water Resources Management and Agrometeorology, Michael Okpara University of Agriculture, Nigeria
2Department of Soil Science and Land Resources Management, Michael Okpara University of Agriculture, Nigeria
Submission: June 03, 2024; Published: June 21, 2024
*Corresponding author: Onwuka BM, Department of Water Resources Management and Agrometeorology, Michael Okpara University of Agriculture, Umudike, Abia State, Nigeria, Email: onwuka.brown@mouau.edu.ng
How to cite this article: Onwuka BM*, Oguike PC and Nwagbara MO. Evaluation of Soil Heat Transfer in Relation to Climate Variability across Umudike, Abia State, Nigeria. Int J Environ Sci Nat Res. 2024; 33(4): 556371. DOI: 10.19080/IJESNR.2024.33.556371
Abstract
The need to understand the trends, magnitudes, nature and rates of soil quality changes due to soil heat transfer and climate variability is important. Therefore, a study was conducted in Umudike, Ikwuano Local government area of Abia State to evaluate the relationship between soil heat transfer and climatic variables (temperature, relative humidity, sunshine duration, wind speed, rainfall and soil moisture content). From the study area, within an arable land, field measurements of soil temperatures at 0-20cm and 20-40cm depths were taken three times in a day. Soil core samples for moisture content were also collected at 0-20cm depth from the designated sampling points. Daily meteorological data used for this study were obtained from the National Oceanic and Atmospheric Administration/National Centre for Environmental Prediction (NOAA/NCEP) under the National Weather Service, United States of America. The data were transformed subjected to regression analysis which was used to compare the influence of climate variables on the measured soil heat transfer over a period of time. The results showed that the soil temperature had a strong direct relationship with atmospheric temperature (R2 = 0.9626), and a weak inverse relationship with rainfall (R2= 0.2445), relative humidity (R2= 0.1713) and soil moisture content (R2= 0.2161). The study showed that the soil thermal conductivity had a weak direct relationship with atmospheric temperature (R2 = 0.1356), and strong direct relationship with rainfall (R2= 0.6833), relative humidity (R2= 0.8713) and soil moisture content (R2= 0.8931). The relationship between soil heat flux and other climatic variables studied also showed that the soil heat flux had a weak relationship with atmospheric temperature (R2 = 0.0076), and strong direct relationship with rainfall (R2= 0.6396), relative humidity (R2= 0.6705) and soil moisture content (R2= 0.7309). Furthermore, the effects of climate on soil heat transfer should be studied for different crops to predict the temperature requirements of crops.
Keywords: Climate variability; Soil heat transfer; Soil temperature; Thermal conductivity; Soil moisture, rainfall
Introduction
There is increasing consent that the global climate is getting warmer in comparison to pre-industrialized times [1]. This is supported by some observations such as rising sea levels [2], changing weather patterns [3], melting of ice and snow in the arctic or subarctic regions [4,5] increasing temperatures [6,7], amidst other signals. The variations in climate are not restricted to air temperature alone but can also change precipitation patterns as well as soil heat properties. Thus, soil heat response to climate change could differ from that of air temperature depending on changes in the timing and duration of the weather condition [8]. Despite the importance of soil heat in controlling biogeochemical and hydrological processes, soil heat transfer data are generally less available than air temperature measurements. Soil heat controls biogeochemical processes such as rates of mineralization [9,10] or decomposition of soil organic matter [11]. It also affects the export of dissolved organic carbon [12], length of growing season [13,14], and nutrient assimilation by plants [4,15]. Weathering of basic cations [16] as well as forest productivity [14] are also affected by soil heat.
Soil heat is of great importance for organic matter decomposition, regulates various processes including the rate of plant growth, and as such is a very sensitive climate indicator [17]. In soils, carbon mineralization and sequestration can be severely affected by heat. Soil organic matter decomposition is controlled primarily by soil temperature during wet periods and by the combined effect of soil water and soil temperature during dry periods [3]. Heat transfer is a complex function of intensity, duration, and the rate of increase in air temperature. Also, air temperature is strongly correlated with topsoil temperatures and with coefficients decreasing rapidly with depth [7]. Moreover, the effect of an increase in soil temperature may be even stronger if accompanied by a decrease in soil water content. When soil temperatures are higher, soil water evaporation also increases [18]. When soils are moist, heat transport is rapid, but more energy is required to change temperature [9]. Therefore, soil heat with its influence on plant development is very important and should be monitored or analyzed if it is above a certain critical threshold [19]. Extreme air and soil heat can alter the water transport rate due to reduced plant stomatal conductance, which reduces transpiration rate and consequently, also yields [14]. In the tropical region, extreme events caused by climate change, such as prolonged and more intense temperature, have an impact on soils and their functions through changes in the biomass composition and activities of edaphic microbial communities [17]. Haei et al. [12] observed that soil heat showed a positive trend with air temperature in the period 1971-2015, with the strongest warming in summer.
In southeastern Nigeria, there is no plenty of information on the evaluation of soil heat transfer in relation to climate variability. As a consequence, the dynamics of soil heat transfer as affected by climate are still not well understood. In addition, climate variability and extremes need to be studied and there is a large gap in our knowledge of soil temperature during heat transfer. Studies are needed to understand the trends, magnitudes, nature and rates of soil quality changes in relation to soil heat transfer and climate variability. Therefore, the intent of this paper is to evaluate soil heat transfer in relation to climate variability.
Materials and Methods
Study area
This study was carried out in Umudike, Ikwuano Local government area of Abia State which lies between latitude latitudes 5020ʹ - 5026ʹN and longitudes 7035ʹ - 7037ʹE of the equator [20]. It lies at an altitude of 122m above sea level [20]. It is a semi urban settlement about 11km southeast of Umuahia the state capital. Umudike is the home to National Root Crops Research Institute and Micheal Okpara University of Agriculture, Umudike. The majority of the people are farmers. The climate of the study area is typically of humid tropics with fairly even and uniform temperature throughout the two seasons (dry and rainy) of the year [21].
The identifiable vegetation type is the tropical rainforest vegetation. Grasses and broadleaf that dominate the area are Panicum maximum, Elusine indica, Axonopus compressus, Pennisetum purpureum. Broadleaf weeds are Chromolena odorata, Calapogonium mucunoides. Major roots and tuber crops grown are cassava, sweet potato, Maize, pepper and vegetables such as fluted pumpkin, okra are also grown.
The area is composed of clay, sand, and sand rocks. The soils of Umudike are derived from semi consolidated sand and sandy clay deposits with occasional intercalation of shale and sandstone fragments at varying depths [22].
Climate data collection
Daily meteorological data used for this study were obtained from the National Oceanic and Atmospheric Administration/ National Centres for Environmental Prediction (NOAA/NCEP) under the National Weather Service, United States of America [23]. The data were collected using the nonhydrostatic mesoscale weather and multi-scale weather models for a period of one year (12 months). The period of data collection comprised the wet and dry seasons of the year. The period of collection was from September 1, 2019, to August 30, 2020. This was actualized using the geographic information system (GIS). The climate parameters measured include the following: temperature, relative humidity, sunshine radiation, sunshine duration, rainfall and soil moisture.
Field method
From the location, arable land was selected for the study. In the arable land, five sampling points were located randomly. At each of the five sampling points, field measurements of soil temperature at 0-20cm and 20-40cm depths were taken three times in a day. It was taken in the morning (6.00-7.00am), afternoon (2.00-3.00pm) and evening (5.30-6.30pm). This was done for comparison with the meteorological data obtained from the National Oceanic and Atmospheric Administration/National Centres for Environmental Prediction.
Determination and calculation of soil properties studied
Temperature (T): This was determined in the field at 0-20cm and 20-40cm depths using soil mercury-in-glass thermometer as described by Nwankwo & Ogagarue [24].
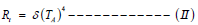
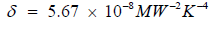
Thermal conductivity (K): This was determined using Stefan’s Boltzmann equation [25].
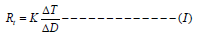
Where, Rt = rate of conduction of heat per unit area.
 (Stefan’s Boltzmann
equation)
(Stefan’s Boltzmann
equation)
ΔT = Difference between the temperature at 0-20cm depth (TA) and temperature at 20-40cm depth (TS)
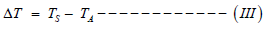
TA = Temperature of soil at 0-20cm depth
Ts = Temperature of soil at 20-40cm depth
= Depth of the soil
K = Thermal conductivity of the soil
Heat flux (Q): The soil heat flux was calculated from thermal conductivity (K) and temperature (T).
Moisture content (MC)
Moisture content (MC) was calculated using the gravimetric method where soil samples were placed into ceramic crucibles and weighed to get the fresh weight and then oven-dried at 105°C to constant weight for about 48hrs and the dry weight recorded. These values were then used to calculate the moisture contents of the soils using the formula:

where MC soil moisture content (%), fw fresh weight (g) of soil sample, dw dry weight (g) of soil sample.
This was done for comparison with the soil moisture data obtained from the National Oceanic and Atmospheric Administration/National Centres for Environmental Prediction.
Statistical analysis
The data generated were subjected to regression analysis which was used to compare the influence of climate variables on the measured soil heat transfer over a period of time.
Results and Discussion
Climate variables
The climate data of the location studied are shown in Table 1. From the table, it is shown that the mean temperature was highest (28.7℃) in the month of December 2019 whereas the month, July 2020 had the lowest (25.0℃). However, from October to December 2019 and February to May 2021, the mean temperature was fairly constant. The location under study had experienced more than 25.0℃ temperature per month. The mean temperature was fairly constant from October to December and from February to May, indicating a stable climatic condition in those periods.

The mean relative humidity was highest (79.6%) in the month of July 2020, while the month of January was observed to have the lowest (47.9%). However, from May to August 2020, the relative humidity of the study area was observed to be fairly constant. The mean relative humidity was fairly constant from May to August, indicating a high moisture content in the air during the wet season [11].
From the Table it was also observed that the month of July 2020 recorded the highest rainfall (346.70mm), while the lowest rainfall was observed in December (4.3mm). However, from September 2019 to October 2019 and from May to August, 2020, rainfall was fairly constant. This indicates a regular pattern of precipitation during those periods [26].
The month of December 2019 recorded the highest hours of sunshine (5.3 hours) than the other months. January 2020 had the second to the highest sunshine hours (5.0 hours), while the months July and August 2020 were observed to have the lowest (2.6 hours). The sunshine hours were fairly constant from the January to the month of April 2020, indicating a clear sky and low cloud cover during those months [1].
The mean soil temperature at 0-20cm was highest (29.800C) in the month of December 2019 while the month of July 2020 was observed to have the lowest (26.040C). However, from October 2019 to January 2020 and March 2020 to April 2020, the soil temperature at 0-20cm of the study area was observed to be fairly constant indicating a uniform heat distribution in the soil during those periods [19].
The month of October 2019 recorded the highest soil thermal conductivity (3.45W mk-1). September 2019 had the second highest soil thermal conductivity, while the month August was observed to have the lowest (2.05W mk-1). The soil thermal conductivities were fairly constant from September to December 2019 and from May to July, 2020.
The highest heat flux (50.82W.m-2) was observed in October 2019 while the lowest was observed in January 2020 (25.04W.m- 2). However, from September to October 2019 and from March to June, 2020, soil heat flux was fairly constant.
From the Table it was also observed that the highest soil moisture content (0.35m3m-3) was recorded in June 2020 while the lowest was observed in January 2020 (0.08m3m-3). From September 2019 to October 2019 and from May to August 2020, soil moisture content was fairly constant.
One possible explanation for the observed patterns is that soil thermal conductivity and soil heat flux are influenced by the temperature and moisture content of the soil [26].
Soil temperature at 0-20cm
Figure 1 is the plot of regression analysis of measured climatic variables with soil temperature at 0-20cm depth. From Figure 1A the relationship between mean monthly atmospheric temperature and soil temperature at 0-20cm shows that the coefficient of determination (R2) is 0.9626 which is an indication that the mean atmospheric temperature is important and has a strong positive influence (96.26%) on the variations of soil temperature using the model (ST = 0.989TEMP + 1.2447). From the results, the higher the mean monthly temperature, the higher the soil temperature. Mellander et al. [27] reported that atmospheric temperature can influence soil temperature through insulation. The atmosphere acts as an insulating layer, and its temperature can have a buffering effect on the temperature of the soil. Also, changes in atmospheric temperature due to the changing seasons directly impact soil temperature [28].

Figure 1B presented the regression analysis between rainfall and soil temperature at 0-20cm. From the result, the coefficient of determination is 0.2445. This shows that in the model (ST = -0.0043RF + 28.704) rainfall has about 24.45% control over the variations of soil temperature at 0-20cm depth. The results showed that there was a negative control of rainfall over the soil temperature. Rainfall was observed to reduce the temperature of the soil. Chukwuma [29] reported an inverse relationship between rainfall and soil temperature. The result obtained was similar to the findings [30]. When rain falls on the soil surface, it can cool the soil by direct evaporative cooling effect [31]. This is because the energy required to evaporate water comes from the soil, which results in a decrease in soil temperature. As raindrops fall on the soil, they absorb heat from the soil and the surrounding environment as they evaporate [30]. Rainfall can also reduce soil temperature by reducing the amount of solar radiation absorbed by the soil [14]. The moisture from rain can create a cooling effect on the soil surface, preventing extreme temperature fluctuations.
The regression analysis between mean relative humidity and soil temperature at 0-20cm is presented in Figure 1C. The results showed that relative humidity had a negative influence on the variation of soil temperature at 0-20cm depth. As the relative humidity increased, the soil temperature at 0-20cm reduced. From the result presented, the model (ST = -0.0446RH + 30.942) showed that about 17.13% of the variations of soil temperature at 0-20cm depth were controlled by relative humidity. Chen et al. [18] reported that relative humidity can influence soil temperature, the negative influence of relative humidity over soil temperature could be attributed to evaporation and cooling process [30]. When relative humidity is high, the air above the soil contains a significant amount of moisture. In such conditions, the rate of evaporation from the soil surface decreases because the air is already saturated with moisture. As a result, less energy is used for the phase change of water from liquid to vapor, which means less cooling of the soil surface as there is reduced or no evaporative cooling.
From Figure 1D, the relationship between soil moisture content and soil temperature at 0-20cm shows that the coefficient of determination (R2) is 0.2161 (21.61 %) which is an indication that the soil moisture is important and has a weak negative influence on the variations of soil temperature using the model (ST = -6.4732SMC + 29.553). An increase in soil moisture content was observed to reduce the temperature of the soil. It was found that there was an inverse proportional relationship between soil moisture and temperature and the results here were consistent with the studies by Zhang & Zuo [32] and Lu [10]. Soil moisture is closely related to evaporation and thus to the partitioning of the sensible and latent heat fluxes at the surface, it has a significant impact on the surface water and energy balance [33].
Soil temperature at 20-40cm
The regression analysis of measured climatic variables with soil temperature at 20-40cm is presented in Figure 2. From Figure 2A, the relationship between mean monthly temperature and soil temperature at 20 – 40 cm shows that the coefficient of determination (R2) is 0.9628 which is an indication that the mean temperature is important and has a strong positive influence (96.28%) in the variations of soil temperature using the model (ST = 0.9616TEMP + 2.2225). From the results, the higher the mean monthly temperature, the higher the soil temperature. The positive effect of atmospheric temperature on soil temperature could be attributed to conduction of heat from the atmosphere to the soil [1].
When the air temperature increases, the top layer of soil is directly exposed to this warmer air. Heat from the air is conducted into the soil, causing the soil temperature to rise. Similarly, when the atmospheric temperature decreases the soil loses heat to the cooler air [28]. Also, the increase in temperature could be as a result of convection [7]. When the air near the ground is heated, it becomes less dense and rises, allowing cooler air to move in and take its place [7]. This process can transfer heat to the soil as warm air moves over it, increasing the soil temperature.
Figure 2B presented the regression analysis between rainfall and soil temperature at 20-40cm. From the result, the coefficient of determination is 0.2174 indicating that in the model (ST = -0.0039RF + 28.875) rainfall has about 21.74% control over the variations of soil temperature at 20-40cm depth. The results showed that there was a negative control of rainfall over the soil temperature. Rainfall amount was observed to reduce the temperature of the soil. Rainfall can cool the soil by cooling both the atmosphere and soil and reducing air temperature. Cooler air temperatures can, in turn, influence soil temperatures. Cooler air can reduce the rate of heat transfer between the atmosphere and the soil, which can result in slightly lower soil temperatures [31]. Adequate rainfall can increase soil moisture content, which can have a moderating effect on soil temperature.
The regression analysis between mean relative humidity and soil temperature at 20-40cm is presented in Figure 2C. The results showed that relative humidity had a negative influence on the variation of soil temperature at 20-40cm depth. As the relative humidity increased, the soil temperature at 20-40cm reduced. From the result presented, the coefficient of the determination (R2 = 0.1078) in the regression model (ST = -0.0343RH + 30.481) showed that relative humidity had about 10.78% control over the variations of soil temperature at 20-40cm. Relative humidity influence soil temperature by affecting plant transpiration rates. High humidity can reduce the rate of transpiration (the release of water vapor from plant leaves), which, in turn, can influence the temperature of the soil in the root zone [7].
From Figure 2D, the relationship between soil moisture content and soil temperature at 20-40cm shows that the coefficient of determination (R2) is 0.1541 which is an indication that the soil moisture is important and has a weak negative influence of 15.41% on the variations of soil temperature using the model (ST = -5.3006SMC + 29.494). Soil moisture content was observed to reduce the temperature of the soil. Soil temperature variations also depend on the depth of the soil being considered. Deeper soil layers are less influenced by short-term atmospheric temperature changes and exhibit more stable temperatures that reflect longerterm climate patterns [27]. The inverse relationship of soil moisture with soil temperature could be as a result of thermal Inertia [11]. The effects of soil moisture on soil temperature may be as a result of the soil moisture acting as an insulator [7].

Soil thermal conductivity (K)
The regression analysis of climate variables with soil thermal conductivity is presented in Figure 3. From Figure 3A, the relationship between mean monthly temperature and soil thermal conductivity shows that the coefficient of determination (R2) is 0.1356 which is an indication that the mean temperature had a weak positive influence on the variations of soil thermal conductivity using the model (K = 0.1638TEMP - 1.6087). From the results, an increase in the mean monthly temperature causes a little increase to the soil thermal conductivity. The observations from the study showed that atmospheric temperature directly controlled the changes in soil thermal conductivity. This could be attributed to seasonal variation of temperature [16]. Seasonal temperature changes can impact soil thermal conductivity. Also, the thermal conductivity of soil can vary with depth. Near the surface, soil temperatures are influenced more directly by atmospheric temperature [12]. According to the Fourier’s law of heat conduction, the heat flux through the soil is proportional to the thermal conductivity and the temperature gradient. Therefore, if the atmospheric temperature changes, it can induce a change in the soil temperature gradient, which in turn can affect the heat flux and the thermal conductivity.

Figure 3B presented the regression analysis between rainfall and soil thermal conductivity. From the result, the coefficient of determination (R2) is 0.6833. This shows that in the model (K = 0.0051RF + 1.8159) rainfall has about 68.33 % control over the variations of soil thermal conductivity. The results showed that there was a positive control of rainfall over the soil thermal conductivity. Rainfall was observed to increase the thermal conductivity of the soil. Rainfall may affect soil thermal conductivity by changing the amount and distribution of water in the soil [34]. Edokpa [35] observed that rainfall adds moisture to the soil, which increases its moisture content. Water has a higher thermal conductivity than air or dry soil. Therefore, an increase in soil moisture content generally leads to an increase in soil thermal conductivity. This means that wetter soils conduct heat more effectively than drier soils. Egbinola & Amobichukwu [36] reported that the intensity of rainfall plays a significant role in how it affects soil thermal conductivity. Heavy rainfall events can rapidly increase soil moisture content, leading to a faster increase in thermal conductivity.
The regression analysis between mean relative humidity and soil thermal conductivity is presented in Figure 3C. The results showed that relative humidity had a strong positive influence on the variation of soil thermal conductivity. As the relative humidity increased, the soil thermal conductivity increased. From the result presented, the coefficient of determination (R2 = 0.8713) and the equation (K = 0.0713RH - 2.0936) showed that relative humidity had about 87.13% control over the variations of soil thermal conductivity. The strong positive influence of relative humidity on the variation of soil thermal conductivity may be attributed to change in the moisture content of the soil and change in the temperature gradient of the soil [34]. When relative humidity increases, more water vapor condenses on the soil particles, increasing the moisture content of the soil. If this moist air comes into contact with dry soil, some of the moisture may be absorbed by the soil. Increased soil moisture content can enhance soil thermal conductivity. As relative humidity increases and soil absorbs more moisture, the thermal conductivity of the soil generally increases.
From Figure 3D, the relationship between soil moisture content and soil thermal conductivity shows that the coefficient of determination (R2) is 0.8931 (89.31%) which is an indication that the soil moisture is important and has a very strong positive influence on the variations of soil thermal conductivity using the model (SMC = 0.0957K - 0.01). Soil moisture content was observed to increase the thermal conductivity of the soil. Soil thermal conductivity increased with increasing soil moisture. When soil moisture increases, the contact area between soil particles also increases, and the air-filled pores in the soil decrease [32]. Since water has a higher thermal conductivity than air, this means that more heat can be transferred through the soil. Therefore, soil thermal conductivity increases with increasing soil moisture.

Soil heat flux (Q)
Figure 4 presents the regression analysis of measured climatic variables with soil heat flux. From Figure 4A, the relationship between mean monthly temperature and soil heat flux shows that the coefficient of determination (R2) is 0.0076 (0.76%) which is an indication that the mean temperature had a very weak influence on the changes of soil heat flux using the model (Q = -0.6734TEMP + 55.756). From the results, an increase in the mean monthly temperature causes a little or no decrease in the soil heat flux. The influence of atmospheric temperature on the soil heat flux may be as a result of diurnal temperature variations (Zhang et al. 2016). During the day, when the atmospheric temperature increases, there is typically more heat energy transferred from the atmosphere to the soil. Seasonal variations in atmospheric temperature can also influence soil heat flux [2].
Figure 4B presented the regression analysis between rainfall and soil heat flux. From the result, the coefficient of determination (R2) is 0.6396. This shows that in the model (Q = 0.0536RF+ 27.701) rainfall has about 63.96% control over the variations of soil heat flux. The result showed that there was a positive control of rainfall over the soil heat flux. Rainfall was observed to enhance the increase of heat transfer in the soil. The influence of rainfall on soil heat flux could be attributed to increased soil moisture by the rainfall [19]. Wetter soil tends to transfer heat more efficiently from the surface to deeper layers, increasing soil heat flux [37]. The impact of rainfall on soil heat flux can vary seasonally [37]. However, in regions with consistent rainfall, the effect may be more balanced. The presence or absence of vegetation can also influence the impact of rainfall on soil heat flux [34].
The regression analysis between mean relative humidity and soil heat flux is presented in Figure 4C. The results showed that relative humidity had a strong positive effect and control on the variation of soil heat flux. As the relative humidity increased, the soil heat flux increased. From the result presented, the model (Q = 0.6777RH - 8.5491) and coefficient of determination (R2 = 0.6705) showed that relative humidity had about 67.05% control over the variations of soil heat flux. The effect of relative humidity on soil heat flux could be attributed to its influence on the evaporation and condensation of water from the soil surface [38]. When relative humidity is high, evaporation is low and condensation is high, which means that more heat is transferred from the atmosphere to the soil. Also, relative humidity affects the thermal conductivity and specific heat capacity of the soil. When relative humidity is high, the soil becomes wetter, which increases its thermal conductivity and specific heat capacity [19]. This means that the soil can conduct and store more heat, which reduces the soil heat flux. When relative humidity is low, the air becomes clearer, which increases the incoming solar radiation and decreases the outgoing long wave radiation from the atmosphere [38].
From Figure 4D, the relationship between soil moisture content and soil heat flux shows that the coefficient of determination (R2) is 0.7309 (73.09%) which is an indication that the soil moisture is important and has a strong positive influence on the variations of soil heat flux using the model (Q = 91.508SMC + 14.343). Soil moisture content was observed to have a significant control and increase the transfer of heat in the soil. The strong positive influence of soil moisture on the variations of soil heat flux could be as a result of the effect on thermal conductivity of the soil [9]. Therefore, as soil moisture increases, thermal conductivity also increases, allowing heat to move more easily through the soil. Soils with higher moisture content can store more heat energy, which can influence the rate at which soil temperature changes. Wet soils have a higher heat capacity and can absorb and release heat more slowly than dry soils [7]. Wet soil can experience evaporation and transpiration, which can cool the soil surface. When the soil is saturated, some of the energy from the sun is used to evaporate water from it which can reduce the heat flux near the surface [39-41].
Conclusion
The rate of soil heat transfer in relation to climate variability was carried out in Umudike, Abia state. The objective of the study was to evaluate the relationship between soil heat transfer and climatic parameters in Umudike. From the study it was observed that the relationship between the rate of soil heat transfer and climate has been established in Umudike area. The temperature of the soil had strong, direct, proportionality to mean monthly atmospheric temperature, while it was inversely proportional and weak with rainfall, relative humidity and soil moisture. The soil thermal conductivity had a strong, direct, proportionality to rainfall, relative humidity and soil moisture content, while it had weak proportionality with atmospheric temperature. The soil heat flux, which is the rate of soil heat transfer, had a strong, direct, proportionality to rainfall, relative humidity and soil moisture content, while it had weak proportionality with atmospheric temperature. The relationship between atmospheric temperature and soil heat transfer is very weak and positive in Umudike area. The relationship between individual climatic parameters and soil heat transfer shows that soil heat transfer has strong, direct, proportional relationship to rainfall, relative humidity and soil moisture content, but weakly related to atmospheric temperature. Based on the aforementioned result, further study can be carried out to predict the temperature requirements for some selected crops. The effects of climate and soil heat transfer can be studied for different crops.
References
- IPCC (2014) Impacts, Adaptation, and Vulnerability. Part A: Global and Sectoral Aspects. Contribution of Working Group II to the Fifth Assessment Report of the Intergovernmental Panel on Climate Change; Cambridge University Press: Cambridge, UK; New York, NY, USA.
- Cheng Z, Liu X, Fan G, Bai A (2010) Analysis of runoff variation in the yellow river source region of the Yangtze River in the 21st Resour Environ Yangtze River Basin 19: 1333-1339.
- Berg A, Sheffield J (2018) Climate change and drought: The soil moisture perspective. Curr Clim Change Rep 4: 180-191.
- Hu Y, Maskey S, Uhlenbrook S, Zhao H (2011) Streamflow trends and climate linkages in the source region of the Yellow River, China. Hydrol Process 25(22): 3399-3411.
- Xin L, Xiaoning S, Pei L, Long X (2019) Temporal and spatial changes of soil dry and wet conditions in the source region of the Yellow River based on MODIS data. J Univ Chin Acad Sci 36: 178-187.
- Wang H, Li D (2013) Research progress of runoff variation characteristics and its influencing factors in the source region of the yellow river. Plateau Mt Meteorol Res 33: 93-99.
- Oni SK, Futter MN, Bishop K, Kohler S, Ottosson-Lofvenius M (2013) Long-term patterns in dissolved organic carbon, major elements and trace metals in boreal headwater catchments: trends, mechanisms and heterogeneity. Biogeosciences 10: 2315-2330.
- Wei W, Mo C (2023) Study of spatiotemporal evolution characteristics of evapotranspiration in southeast coastal areas of china based on remote sensing data. Water Saving Irrig 20(4): 9-17.
- Haei M, Oquist, MG, Kreyling J, Ilstedt U, Laudon H (2013) Winter climate controls soil carbon dynamics during summer in boreal forests. Environmental Research Letters 8: 024017.
- Lu Y (2022) Evapotranspiration variations of the Minjiang River Basin in Southeastern China from 2000 to 2019. Atmosphere 13(4): 562.
- Marshall M, Funk C, Michaelsen J (2012) Examining evapotranspiration trends in Africa. Clim Dyn 38: 1849-1865.
- Haei M, Oquist, MG, Buffam I, Agren A, Blomkvist P, et al. (2010) Cold winter soils enhance dissolved organic carbon concentrations in soil and stream water. Geophysical Research Letters 37(8).
- Senevirante SI (2012) Swiss prealpine Rietholzbach research catchment and lysimeter: 32-year time series and 2003 drought event. Water Resour Res 48(6): 11749.
- Mitchell PJ, Benyon RG, Lane PNJ (2012) Responses of evapotranspiration at different topographic positions and catchment water balance following a pronounced drought in a mixed species eucalypt forest, Australia. J Hydrol (Amst) 440-441: 62-74.
- Nistor MM, Satyanaga A, Dezsi Ş, Haidu I (2022) European grid dataset of actual evapotranspiration, water availability and effective precipitation. Atmosphere 13(5): 772.
- Jiang J (2022) Southeast China extreme drought event in august 2019: Context of coupling of midlatitude and tropical systems. J Climate 35(22): 7299-7313.
- Onwuka BM (2016) Effects of soil temperature on some soil properties and plant growth. Scholarly Journal of Agricultural Science 6(3): 89-93.
- Chen J, Wen J, Liu R, Li D, Wang X, et al. (2016) Analysis of soil temperature and humidity change and related climatic factors in source region of Yellow River. J Desert Res 12: 235-246.
- Sviličić P, Fra G, Mandića D, Smolić Ante (2016) Soil temperature regime and vulnerability due to extreme soil temperatures in Croatia. Theor Appl Climatol 126: 247-263.
- Nwosu TV, Ekpe II, Ojimgba O (2016) Effects of Selected Land Use on Soil Reaction and Heavy Metal Concentration in an Ultisol in Umudike, Abia State Southeast Nigeria. FUTO Journal Series 2(2): 324-334.
- Nigerian Meteorological Agency (2015) Seasonal rainfall prediction for 2015. Nigeria Meteorological Publications. Maitama, FCT Abuja.
- Chukwu GO, Ajuamiwe CF (2013) Investigation of mechanical/physico-chemical properties of kaolinite ore (clay) from Umuariaga-Umudike, Abia State of Nigeria. International Research Journal of Geology and Mining (IRJGM) 3(5): 195-205.
- NOAA/NCEP (2020) National Oceanic and Atmospheric Administration/National Centers for Environmental Prediction (NCEP) Global weather Forecast System (GFS) Atmospheric Model. Climate data distributed by the Pacific Islands Ocean Observing System (PacIOOS). National Weather Service, USA.
- Nwankwo C, Ogagarue D (2012) An investigation of temperature variation at soil depths in parts of Southern Nigeria. American Journal of Environmental Engineering 2(5): 142-147.
- Gwani M, Abubakar GA, Utah GU (2013) Determination of soil thermal conductivity using solar energy and soil temperature in Sokoto. International Journal of Environmental Sciences 3(5): 1330-1338.
- IPCC (2019) Assessment report: Climate change 2019: Climate change impacts, adaptation and vulnerability. Summary for policy makers.
- Mellander PE, Lofvenius MO, Laudon H (2017) Climate change impact on snow and soil temperature in boreal Scots pine stands. Climatic Change 85: 179-193.
- Tierney GL, Fahey TJ, Groffman PM, Hardy JP, Fitzhugh RD (2011) Soil freezing alters fine root dynamics in a northern hardwood forest. Biogeochemistry 56: 175-190.
- Chukwuma OM (2014) Review of studies on global warming and climate change in Nigeria. Int Organ Sci Res 4(10): 19-27.
- Zhao A, Zhu X, Liu X, Pan Y, Zuo D (2016) Impacts of land use change and climate variability on green and blue water resources in the Weihe River Basin of northwest China. Catena 137: 318-327.
- López-Moreno JI, Zabalza J, Vicente-Serrano SM, Revuelto J, Gilaberte M, et al. (2014) Impact of climate and land use change on water availability and reservoir management: Scenarios in the Upper Aragón River, Spanish Pyrenees. Sci Total Environ 493: 1222-1231.
- Zhang R, Zuo Z (2011) Impact of Spring Soil Moisture on Surface Energy Balance and Summer Monsoon Circulation over East Asia and Precipitation in East China. J Clim 24(13): 3309-3322.
- Hu C, Wang J, Chai X, Guan X (2013) Research progress on climate change on runoff change and its possible influence in the Yellow River basin. Meteorol Environ Sci 36: 57-65.
- Moran MS, Peters-Lidard CD, Watts JM, McElroy S (2014) Estimating soil moisture at the watershed scale with satellite-based radar and land surface models. Canadian Journal of Remote Sensing 30(5): 805-826.
- Edokpa DA (2020) Variability in the long-term trends of rainfall and temperature over southern Nigeria. Journal of Geography Meteorology and Environment 3(1): 15-41.
- Egbinola CN, Amobichukwu AC (2013) Climate variation assessment based on rainfall and temperature in Ibadan, South-Western, Nigeria. Journal of Environmental and Earth Science 3(11): 32-45.
- Evett SR, Agam A, Kustas WP, Colaizzi PD, Schwartz RC (2012) Soil profile method for soil thermal diffusivity, conductivity and heat flux: Comparison to soil heat flux plates. Advances in Water Resources 50: 41-54.
- Purswani E, Pathak B (2018) Assessment of soil characteristics in different land-use systems in Gandhinagar, Gujarat. Proceedings of the International Academy of Ecology and Environmental Sciences 8(3): 162-171.
- Chen L (2017) Study on the response of water resources to climate change in the yellow river basin; Xi’an University of Technology: Xi’an, China.
- Deng H, Chen Y, Chen X (2022) Driving factors and changes in components of terrestrial water storage in the endorheic Tibetan Plateau. J Hydrol 612: 128225.
- Li L, Shen H, Dai S, Xiao J, Shi X (2011) Response of runoff in the yellow river source region to climate change and future trend prediction. Acta Geogr Sin 66: 1261-1269.


