


Traffic Density and Measurement of Traffic-Induced Air Pollution in Apapa Seaport’s Environment
Ruth Ada Okpara, Okechukwu Julius Anyanwu*, Anyanwu Amarachukwu Abigail, Okorefe Charles Odeyovwi and Chijioke Chioma Maryjane
Nigeria Maritime University Okerenkoko, Nigeria
Submission: September 11, 2023; Published: October 05, 2023
*Corresponding author: Okechukwu Julius Anyanwu, Nigeria Maritime University Okerenkoko, Warri South LGA, Delta State, Nigeria
How to cite this article: Okpara Ruth A, Anyanwu Okechukwu J, Anyanwu Amarachukwu A, Okorefe Charles O, Chijioke Chioma M. Traffic Density and Measurement of Traffic-Induced Air Pollution in Apapa Seaport’s Environment. Int J Environ Sci Nat Res. 2023; 32(5): 556349. DOI 10.19080/IJESNR.2023.32.556349
Abstract
The International Maritime Organisation (IMO) on 26th October 2018 adopted an amendment to the Annex of the protocol of 1997 to amend the international convention for the prevention of pollution from ships. Annex VI regulations provides regulations for the prevention of air pollutions from ships, to comply with this requirement in Nigerian seaports, this research estimated the substances which constitutes ambient air in Apapa seaport’s area in Lagos. Pollutants such as CO, NO2, CO2, HC and SO2 were critically monitored with air sample analyzer monitors, at source, receptor and the control. We found that mean concentrations of the following pollutants: In wet season was CO (21.3±0.80ppm), NO2 (0.033±0.002ppm), SO2 (0.035±0.002ppm), CO2 (354.33±21.00ppm) and HC (0.029±0.012ppm) while the values of the concentration during the dry season was CO(30.23±2.23ppm), NO2 (0.039±0.007ppm), SO2 (0.038±0.002ppm), CO2(380.00±25.00ppm) and HC (0.027±0.093ppm) were significantly high. There is a significant difference between the observed values of the two seasons and higher than those recorded in the control group across the seasons as well exceeds the safe acceptable limit when compared with both the Nigerian and international standards of World Health Organization’s (WHO) for gaseous pollutants.
Keywords: Traffic; Apapa; Seaport; Emissions; Air pollution
Introduction
During port operation, several quantities of diesel emission take place when transport and cargo handling equipment’s use diesel fuel. For the period of the burning process in diesel engines, these fuels are capable of producing major quantities of particulate matter (PM), nitrogen oxides (NOX), black smoke, sulfur oxides (SOX), carbon monoxide (CO), carbon dioxide (CO2), unburned hydrocarbons (UHC) and many others, (IPCC 2013; Stevens et al. 2015) and (Sys et al. 2015).
Emissions from Oxides of Nitrogen and Sulphur are contributions from global ships. Statistically, NOx contributes 13% while SOx twelve percent worldwide, (IPCC 2013; Stevens, Sys, Vanelslander, Van 2015). 2.2% greenhouse gas (GHG) emissions of anthropogenic carbon dioxide (CO2) gas emitted from global ship trade were estimated by IMO in 2012. The pollutants are capable of depleting the ozone layer, add to the green-house effect as well as producing acid rain which could be a source of detriment to human health as well as other living being (IMO 2019), (Zaglinskis, Rapalis & Lazareva 2018) and (Ozdemir, Yılmaz & Basar 2015).
Under the support of IMO, appropriate regulations have received considerations, this includes the 2011 acceptance of the technical in addition to operational actions to emission reduction from global seaborne trade, (UNCTAD 2011; UNCTAD 2012). IMO in April 2018, made an adoption of an initial approach to cut yearly emissions from vessels at a minimum of 50% by 2050, comparing it with 2008 which is significant progress.
Literature Review
Globally, with regard to air pollution, about 0.5% limit on Sulphur content in marine fuel oil used on board ships is expected to come to force on 1st of January 2020 (UNCTAD 2019). The implication is that there is now an estimated level of global pollution of sulphur Oxide (SOx) and Nitrogen Oxide (NOx), also inside Emission Control Areas (ECA’s) has its limit, (IMO 2011; McGill, Remley, Winther, 2013).
UNCTAD (2019), effective 1st January 2020 the global limit of air pollution from ship is 0.5% of Sulphur in fuel, following this, the two seas are the Baltic Sea that took effect in 2006 and the North Sea which took effect in 2007 and were established in Europe and were the first two Sulphur Oxide ECA’s. In 2012, the North American ECA Sea was established and was the third to be established, while the fourth was enforced from 2014 and was recognized in the United States Caribbean Sea (UNCTAD 2019).
Concerned these requirements and in a bid to reduce the environmental effect of the fossil fuel effusion on climate change as well as on human health, organisms and our biodiversity. The measures such as technological based which can be achieved through new ship built, application of scrubbers, cold ironing application, etc., as well as operational and market-based strategies such as have heed advocated by many authors and researchers as well as industry experts to reduce the emissions from these fossil fuels.
Remarkable studies on emissions from vessels in Nigerian ports has in recent times drawn the attention some researchers. For instance, Jimoda et al. [1] studied emission inventory of criteria air pollutants from tin-can island seaport in southwestern Nigeria. Their study showed highest percentage (79%) of NOx seconded by SO2 (10%,), PM (6%) and CO 5%. Nwachukwu et al. [2] studied “effect of air pollution diseases on persons living in Rivers State using epidemiological data from Rivers’ State Ministry of Health”, outcome of the research indicated that pollutants from air impacts on residents’ health. Also, Onwuegbuchunam et al. [3] looked measure the ambient air in Onne port area and found that mean concentrations (μg∙m3) of the following pollutants: O3 (71.776 ± 0.726), CO (19.145 ± 0.275) NO2 (28.145 ± 0.965) and SO2 (36.91 ±0.378) were considerably high, while particulates (PM10, PM2.5) also with values of 48.400 ± 0.197 and 29.676 ± 0.352 correspondingly. Olayinka et al. [4] in Abeokuta metropolis empirically researched on air pollutants CO2, NO2, CO, NO2, H2S as well as suspended Particulate Matter from vehicular emissions, while Anyanwu [5] researched on “cost benefit of espousing liquefied Natural Gas as fuel oil for meeting the Annex IV of IMO 2020 necessity. This study therefore has noted the gaps in these studies such as inability of the studies to examine or investigate emissions arising from shipping activities in Nigeria’s busiest Apapa seaport. The researchers therefore examine the pollutants present in Apapa port environment. The study will estimate the level of concentration of SOX, NOX, CO, COX and Particulate Matters in the Apapa port and compare same with the concentration of the control environment.
Materials and Methods
Area of study
The Apapa seaport is located at the Western coast of the Nigeria in Lagos State which is on Latitude 6.6080o N, Longitude 3.6218o E. It is the busiest port in Nigeria as well as the West African region (Figure 1).

Equipment and Field Materials
The equipments or air analyser that was used to obtain data for this study was sourced by the researchers are as follows:
1) Air samplers (CROWNCON GASMAN TO MODEL CE89/336/EEC) for CO, NO2, SO2 and HC measurement: this instrument is an automatic ambient air measuring instrument which uses infrared sensing technology.
2) CO2 meter (MODEL EE80): This instrument works on the principle of infrared sensing technology. The instrument was used for temperature and relative humidity measurements in the course of the survey. It has the capacity of measuring carbon dioxide within the range of 0 - 4000ppm, with resolution boast of 1ppm and an accuracy of +/- 40ppm. It can measure temperature in the range of -20oC to 60oC and relative humidity range of 10- 95% RH.
3) Global Positioning System (GPS) Receiver (Garmin model 60 CSx): This was used to determine the exact coordinates of the sampling sites in the seaports. The elevation of the sites above sea level was determined with the aid of this GPS receiver.
4) Cell phone with in-built GPRS for monitoring the speed of the wind at the seaport site.
Domain of inquiry and definitions
In this research work, the variables studied are SO2, NO2, CO, HC and CO2 at the ground level relative to traffic in the port. In this research work, ground level was defined as five (5) feet above the ground at intersections within the port. The height of five feet has been used as it characterizes the height for breathing of human beings, for situations of seating or standing.
High traffic spots” in this work are connections in the port with more movement of vehicles. The “background” (about 100 metres away from traffic), estimation of air quality at “background” was determined and at a “control site” was carried out. Control site(s) is the area without much or high traffic emission in the port area.
Spatial and temporal coverage and determination of traffic levels
The areas covered include vessels habour areas, trucks movement areas, cargo handling equipments working areas of the specific port of Apapa. “Background” measurement was carried out. A Residential Area was selected as “control site”. The number and types of vehicles or vessels in the port were determined. The motive power category was counted and recorded which includes the vessels, CHE, Off-site trucks, locomotives based on their traffic movement. Traffic density determination was carried out by 800am – 900am, 12.00noon – 1.00pm and by 4.00pm – 5.00pm daily in the sites in Apapa, 100m away and control location.
Correlation between traffic levels and air quality
To establish a relationship between air pollution and traffic emissions, measured data was analysed using traffic level information. By establishing a connection between traffic counts and air pollution, the relationship between high traffic and pollutants concentration was explored.
Establishing the relationship between Concentration of Emission at Source (CS), the Receptor (CR), as well as the Distance (D) from the point of Emission or the Source.
Hence, this is due to the reality that pollutant concentration decreases with increase in distance from the point of release of the pollutant. Therefore, more concentration of pollutant emission at a receptor location is in direct proportion to the concentration emitted at source with inverse proportion to the distance from the source with the mathematical relationship below;
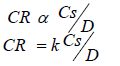
CR = pollutant’s concentration at reception location in ppm.
CS = pollutant’s concentration t the source in ppm.
D = reception distance from the emission source in metres.
K = constant.
Logarithm of both sides shows:
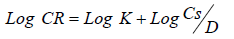
Where Log K is the gradient of the graph when plotted on a straight line and the antilog will give the value of K as the constant of proportionality.
Results and Discussion
Comparative analysis of air quality data at Apapa, Nigerian National Ambient Air Quality (NAAQ) standards and USEPA
Table 1 shows a comparison of the variation of traffic emission of CO at traffic points, a distance of 100 meters away from the traffic point and a control location almost entirely free of traffic. It is obvious from the representation shown in Figure 2-4, that indeed, traffic pollutant concentrations are highest at traffic points, but reduces with distance away from traffic. Results from comparison of the pollutants concentration at the three classified locations i.e., at traffic points, 100m away from traffic points and at a control location during the dry season as presented in Figure 2 indicated that CO concentration was reduced by 62.16% with a distance of about 100m away from traffic source.
Comparing the value with Nigerian National Ambient Air Quality (NAAQ) Standards and USEPA, it is obvious that emission of CO at traffic point is hazardous while moderate at 100m away from the traffic site. Correspondingly, NO2, SO2 and CO2 concentrations were reduced by 2.6%, 31.2% and 7.2% respectively a distance of 100m all with reference to Apapa port (Table 2-4).
Also, for the wet season, when the pollutants concentrations from the traffic point, a distance of 100 metres and at the control location were considered for comparison, it was obvious that the pollutants concentrations recorded at the traffic points were highest, those at a distance of 100 metres away from the traffic point were lower while those recorded from the control location were way less compared to the first two locations. A graphical representation of the comparative result is shown in Figure 5-7.


Source: researchers’ field work


Nwachukwu et al. [2].

USEPA (2003).
In the wet season, however, reduction of CO a distance of 100m with reference was by 50.4%; NO2 a distance of 100m away was reduced by 42.4; SO2 experienced a reduction of 28.6% and HC a reduction of 34.5%. The fact that emission concentrations tend to decrease with increase in distance from the emission source, can pave the way for the representation of the air dispersion model developed to show the interaction/relationship between emission concentration at a source location and what the concentration will be at a receptor location.
Discussion of Results
Comparison of the air quality for both wet and dry seasons showed that the air quality during the wet season was relatively better when compared to that of the dry season. This was so because during the wet season, the atmosphere is bound to be humid and saturated with water vapour for this reason, a significant quantity of the pollutants would have been absorbed in the atmosphere unlike in the dry season
Above all, the excess in all these pollutants against the National and USEPA international standards could signify ecological hazards to residents, Flora and Fauna as elevated levels of these gaseous pollutants have been associated with chronic obstructive pulmonary diseases, asthma, tuberculosis [6], increased risk of liver failure, respiratory problems, skin disorders, neonatal deformities and other health risks [7]. The observed high concentration of the pollutants can be attributed to the presence of several transport modes and equipments. Ships, cargo trucks, cranes, cargo handling equipment, and all rail locomotives contribute to maritime related emission of air pollutants [8]. Emissions from maritime shipping have increased considerably, causing depletion of the ozone layer and most importantly posing a threat to lives and coastal environment through air pollution [3]. These pollutants are majorly from the conventional fuel and can be reduced by adopting liquefied natural gas as marine fuel, use other less pollutant content marine fuels or application of scrubbers for air pollution mitigation [5,9].
Conclusion
Findings from this study had shown that the air quality for both wet and dry seasons showed that the air quality during the wet season was relatively better when compared to that of the dry season.
When compared the concentrations of these pollutants in Apapa port with National Ambient Air Quality Standards, and the World Health Organization’s critical values as well as the USEPA, CO pollutant concentration exceeded both the 1-hour limit of 10ppm and the 8 hours limit of 20ppm during dry. In wet season the site exceeded the 10ppm limit, for Sulphur dioxide (SO2), both seasons experienced concentrations beyond the 1-hour standard of 0.01ppm, Hydrocarbon concentrations in both seasons were within the 0.6ppm limits. Carbon dioxide (CO2) in both seasons was above the 314ppm obtainable in pure air. These values were quite different from the values at the control site and 100m away from the source, this could be linked to marine transport operations from Harbour Vessels, Ocean going vessels as well as operations of locomotives in the port environments the locomotives, trains and cargo handling equipment’s that contributes to air pollutants. From the outcome of this research however, it is pertinent to note that Nigeria is yet to fully comply with the 2020 Sulphur Cap as well as the implementation of the International Maritime Organization’s Marine Pollution 1973/78 convention. This study therefore recommends that port operators and ship operators should yearly reexamine the available air pollution mitigation technologies in Nigerian seaports with respect to global standard and IMO regulation.
a) The best operational air pollution mitigation strategies for ocean going vessels, harbour vessel, locomotives and cargo handling equipment’s so as to meet the global emission limit and IMO regulation should be adopted by seaports.
b) There is absolute need for Nigerian Ports to give incentives to ‘green’ ships to encourage them to invest in other effective port-based emission reduction techniques.
c) Nigerian seaports with good hinterland connections that serve as a key import/export centre for goods transported in the region could exploit their advantageous position in discussing with shipping companies the implementation of CI.
Acknowledgement
We thank and appreciate the Tertiary Education Trust Fund for sponsoring and supporting this research work. We also appreciate the management of Nigerian maritime University, Okerenkoko for the support.
References
- Jimoda LA, Odediran ET, Adebanjo SA, Ojetunji OE, Lawal OL (2017) Emission Inventory of Criteria of Air Pollutants from Tin-Can Island Seaport in Southern Nigeria. Nigerian Journal of Scientific Research 16: 21-27.
- Nwachukwu AN, Chukwuocha EO, Igbudu O (2012) A Survey on the Effects of Air Pollution on Diseases of the People of Rivers Sate, Nigeria. African Journal of Environmental Science & Technology 6(10): 371-379.
- Onwuegbuchunam DE, Egelu F, Aponjolosun MO, Okeke KO (2021) Measuring Traffic Induced Air Pollution in Onne Port’s Environment. Open Journal of Air Pollution 10: 63-75.
- Olayimka OO, Adedeji OH, Ajibola FO (2015) Monitoring Gaseous and Particulate Air Pollutants Near Major Highways in Abeokuta, Nigeria. Journal of Applied Sciences and Environmental Management 19(4): 751-758.
- Anyanwu JO (2017) Espousing Liquefied Natural Gas as Marine Propulsion Fuel: LAP LAMBERT Academic Publishing (2017-07-25) ISBN-13: 978-3-659-63957-9, ISBN-10: 3659639575 EAN: EAN:9783659639579.
- Ezzati M, Kammen DM (2002) Household Energy, Indoor Air Pollution and Health in Developing Countries: Knowledge Base for Effective Interventions. Annual Reviews of Energy and the Environment 27: 233-270.
- Odedrai A, Burley A, Lewis A, Hardmanand M, Haynes P (2005) Oil Spill and Gas Flaring. Petroleum Geology Conference Series 6: 577-587.
- Merico E, Cesari D, Gregoris E, Gambaro A, Cordella M, et al. (2021) Shipping and Air Quality in Italian Port Cities: State-of-the-Art Analysis of Available Results of Estimated Impacts. Atmosphere 12(5): 536.
- World Health Organizations (WHO) (2021) Global Guidelines for Air Quality; Particulate Matter Ozone, Nitrogen Oxide, Sulphur Dioxide and Carbon Monoxide.


