Flash Floods: The Big Impact of Local and Frequent Disasters in Brazil
Viviana Aguilar-Muñoz* and Lucia Calderón-Pacheco
Cemaden –National Center for Monitoring and Early Warning of Natural Disasters, Brazil
Submission: March 24, 2023; Published: April 10, 2023
*Corresponding author: Viviana Aguilar-Muñoz, Cemaden –National Center for Monitoring and Early Warning of Natural Disasters, Brazil, Email: viviana.cemaden@gmail.com
How to cite this article: Aguilar-Muñoz V, Calderón-Pacheco L. Flash Floods: The Big Impact of Local and Frequent Disasters in Brazil. Int J Environ Sci Nat Res. 2023; 32(1): 556328. DOI 10.19080/IJESNR.2023.32.556329
Abstract
Flash floods are the type of natural hazard that causes more deaths and material damage in Brazil. In this paper, we show that existing disaster databases do not reflect the damages and annual losses caused by flash floods. In addition, the national official disaster database (S2iD) and global disaster database (EM-DAT) are contrasting regarding informed economic losses. For instance, for Brazil, from 1991 to 2022 S2iD reports an impact of $16,840,496,970, while in EM-DAT the impact is $386,784,000 (only 2.23% ). To understand this contrast between local and global databases on a more detailed scale, we carry out an analysis of the impact costs of flash flood episodes in Santa Catarina state. Due to the catastrophic effects of extreme episodes, these are more evident in contrast to other minor ones that go unnoticed; however, the data shows us that the economic effect of local and frequent disasters can exceed the amount of those considered extreme. Local data show that the cumulative effect of damages and losses can contribute to increased vulnerability. These are the two main reasons that lead us to highlight the importance of countries having national, historical, reliable, homogeneous, consolidated, and highly disaggregated disaster databases.
Keywords: Hydrological hazards; Disaster damages and losses; Disaster databases; Population and environment
Brazilian Flash Floods in Global and National Disaster Databases
Flash floods are frequent hazardous events associated with intense precipitation in small hydrographic basins of accidental relief, whose rapid development makes early warning difficult. These types of hydrological phenomena can be very destructive and their cumulative impact, in the short and long-term, on economic, social, and environmental systems, can be devastating and exceed the communities’ capacities for preparedness, response, and recovery [1].
From the EM-DAT database, we could not identify the exact size of the local losses due to flash floods, for two reasons, firstly because they are registered under the flash flood and also riverine floods categories (this second category of classification does not exist in Brazil), making it difficult to recognize the real cause of the disaster, and secondly because each record includes the name of different places, making it difficult to recognize the real location of the disaster. The values noted in Table 1 reflect the losses associated with these two integrated categories at the national level; for comparison with the detailed data from the national database, we only use values from the Flash Flood category.
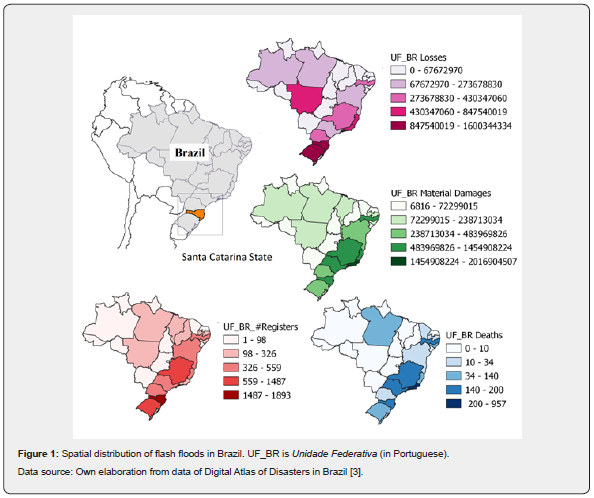
In contrast with EM-DAT, data from the national official disaster database (S2iD) reflect higher values. In Brazil, from 1991 to 2022 there were 9407 flash floods (locally known as “enxurradas”), causing 40% of deaths (1872) and 36.7% of material damage ($9,174,417,818)2. In Figure 1 we can see that Santa Catarina stands out among the Brazilian States most intensely affected by flash floods, it occupies the first place in terms of damages and losses, which include effects on public and private sectors (Table 2).
Our interpretation of the data in Tables 1 & 2 coincides with the results of previous studies: the provision of detailed information on the impacts of hazardous events is more common on national databases with the local resolution, while global databases like EM-DAT only include disasters with more than 10 deaths. As a result, the impact may be undervalued and to make additional analysis it is required to complement the data with other sources of information. Therefore, these data are insufficient for the implementation of public policies, since their creation requires even more detailed data on the location and frequency of disasters [4], as well as more precise information on the hazards and their impacts [5].
1All monetary values are updated to the US dollar of December 2022.
2The numerical values presented here are calculated from official data available in the Digital Atlas of Disasters in Brazil, prepared in turn from official data of the Secretary of Civil Protection and Defense of the S2iD bank (Integrated System of Information on Disasters).

Data source: Own elaboration from data of The International Disaster Database, EM-DAT [2].

Data source: Own elaboration from data of Digital Atlas of Disasters in Brazil [3].

Flash floods occur practically throughout the entire Brazilian coastal region, due to the coexistence of topographic, climatic, and geological conditions that make this region susceptible to this type of phenomenon. Discussing these conditions is beyond the scope of this article. However, it is observed in the maps of Figure 1 that this region concentrates most of the occurrences and their most intense effects. It should also be noted that this is the most densely populated region in Brazil, therefore highly exposed and vulnerable.
Analysis of the Impacts of Flash Floods on the Santa Catarina State
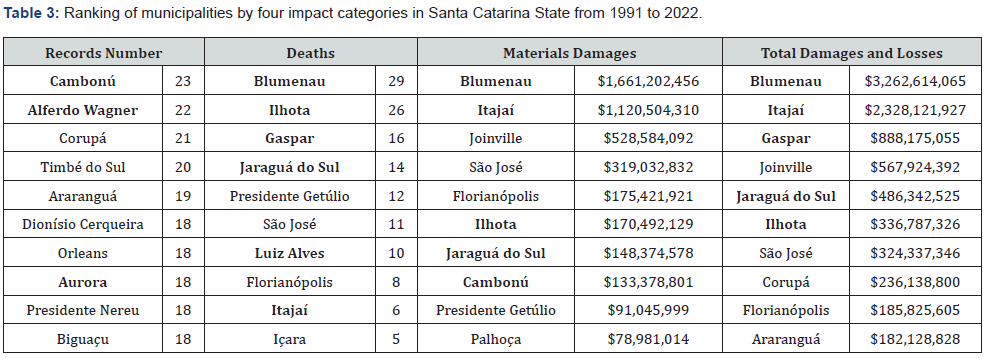
The Itajaí region, in the state of Santa Catarina, stands out for the number of flash floods and the intensity of their effects registered between 1991 and 2022. Table 3 shows that in each category of impacts there are at least three cities that belong totally or partially to this region (bold type), even occupying the first positions in the ranking.

Data source: Own elaboration from data of Digital Atlas of Disasters in Brazil (Brazil, 2022) [3]
Population projections for the Itajaí River Basin indicate a total of 1,253,845 people for 2021, with a density of 125.3 inhabitants/ km2 [6]. This region was colonized by European immigrants who settled in the so-called “lowlands”, consolidating a culture of logging, industrial, agricultural and livestock development, which led to a historical process of environmental degradation and urbanization of floodplains that aggravates the conditions of exposure to flash floods.
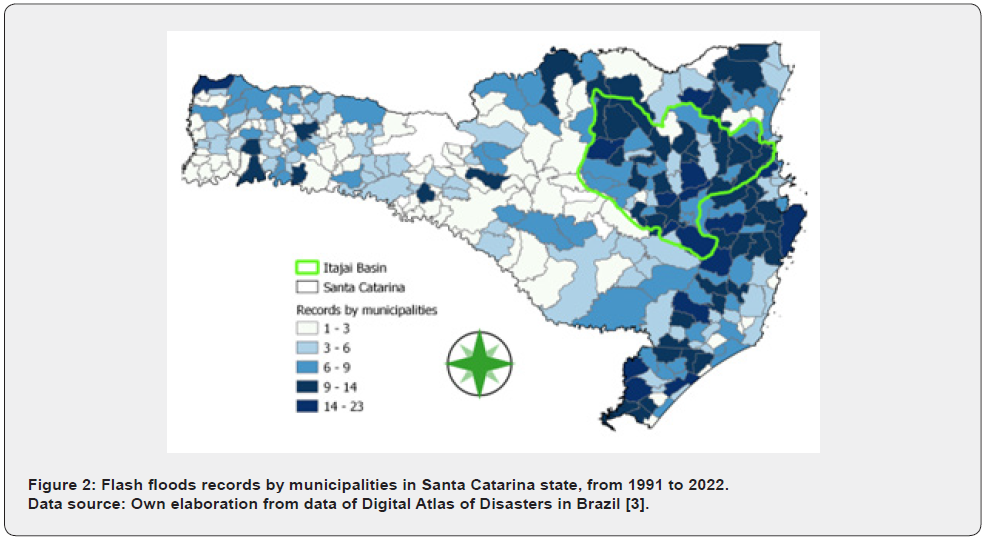
a) Record numbers. The 1,893 flash floods that occurred in Santa Catarina between 1991 and 2022 affected 285 municipalities in the state, out of a total of 295. This means that 97% of the municipalities in Santa Catarina were affected at least once by flash floods in that period (Figure 2). In Table 3 we observe that the frequency of occurrences is very similar among the top ten cities in the ranking. This frequency is not necessarily related to the intensity of the impact, since the highest values of damage and losses were registered in cities that do not appear in this category.
b) Deaths. The 197 deaths by flash floods registered in Santa Catarina occurred in 47 municipalities. The first ten municipalities in the ranking concentrated 69.5% of the deaths, among which there are six municipalities that are totally or partially located in the Itajaí region. At the national level, the events occurred in Blumenau and Ilhota, are in fifth and sixth place, preceded by four municipalities in Rio de Janeiro affected by the January 2011 event (Nova Friburgo, Teresópolis, Petrópolis and Sumidouro), considered up to the date, the most lethal in the country.
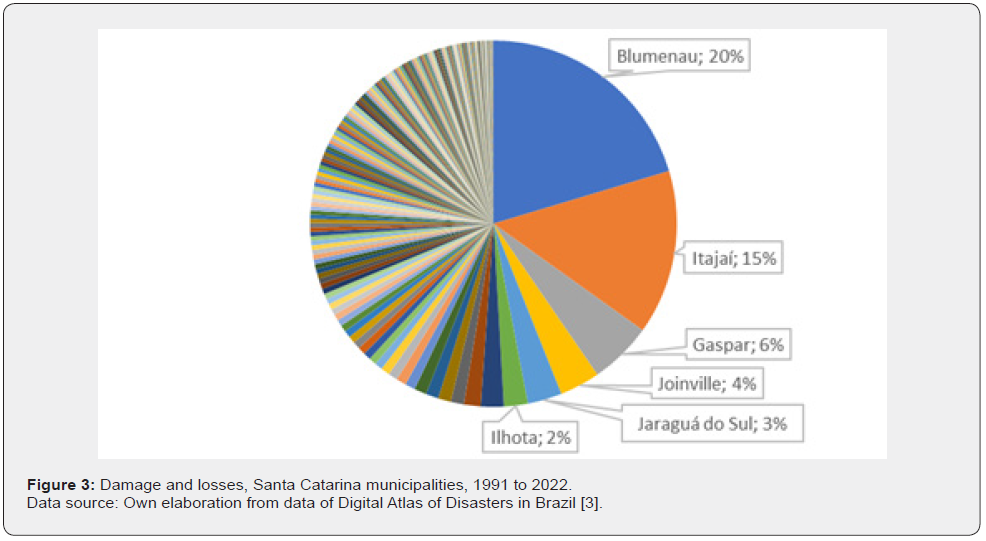
c) Damages and losses. Flash floods in Brazil were concentrated in municipalities in the states of Santa Catarina and Rio de Janeiro, especially as a consequence of major disasters such as those that occurred in 2008 in Santa Catarina and 2011 in Rio de Janeiro (7). We find that the damages and losses in Blumenau and Itajaí municipalities in 2008 represent 35% of the total costs for Santa Catarina state, in the period analyzed (Figure 3), which are concentrated in material damages and in the sector services.
Fifty percent of the losses and damages occurred in 279 municipalities over 30 years, only one catastrophic event caused the other fifty percent of the losses and damages in only six municipalities, as Figure 3 shows. Material damage includes damage to more than 170,000 homes in 227 municipalities, and more than 9,000 homes destroyed in 130 municipalities, highlighting those affected by the 2008 event. As for the affected infrastructure, this includes road and port infrastructure. The economic sectors severely affected were industry and services, it is worth noticing that the services sector represented more than 70% of the added value of the GDP of Blumenau and Itajaí, which have the third and fourth highest GDP values in the state, and after the 2008 event, it had a reduction in the aggregate value of the service sector [8,9].


Fifty percent of the losses and damages occurred in 279 municipalities over 30 years, but the attention is driven away by the reality of the only one catastrophic event that has occurred in the other six, as Figure 3 shows. Material damage includes damage to more than 170,000 homes in 227 municipalities, and more than 9,000 homes destroyed in 130 municipalities, highlighting those affected by the 2008 event. As for the affected infrastructure, this includes road and port infrastructure. The economic sectors severely affected were industry and services, it is worth noticing that the services sector represented more than 70% of the added value of the GDP of Blumenau and Itajaí, which have the third and fourth highest GDP values in the state, and after the 2008 event, it had a reduction in the aggregate value of the service sector [12,13].
Final Considerations
Disaggregated data are suitable to identify the frequency of hazardous events and their effects like deaths (and other human damages), material damages, and private and public losses, in addition to the degree of affectation in each of these variables. This information is essential to assist the development and implementation of public policies for disaster risk management. Due to their characteristics and objectives, local databases meet the demand for this type of data and can be used at the municipal, national, and regional levels. Compared to global databases, these have an advantage, which provide aggregated data that only allow generic analysis and do not reflect the reality of impacts at detailed scales. As noted throughout the paper, incomplete global or national databases underestimate the impacts of flash floods.
Disaster occurrence databases make it possible to get an approximate idea of the direct costs of disasters, whether those considered “major” disasters, such as those included in EM-DAT, that consider over 10 deaths, those registered by insurance companies, such as Swiss-Re, for instance, in the Disaster Information Management System (DesInventar) [10,11], or in the Brazilian’s Disaster Information Database (S2iD) (BRASIL, 2022). The existence of various databases with different characteristics is an opportunity to expand research on the economic impact of disasters, taking advantage of the potential of each one. Despite the existence of these databases, scientific studies that analyze them to estimate the impacts of disasters on the public and private sectors in the South Hemisphere are still scarce [12], especially on a local scale [13].
As episodes like flash floods occur frequently, their underreporting may result in the invisibility of the accumulated vulnerability of the exposed communities by public managers. As observed in Santa Catarina, between 1991 and 2022 most of the municipalities of this state suffered the impact of flash floods at least once in the period, of which only six are noteworthy due to the large numbers of their negative effects. However, those other municipalities that were also affected and that need to record their damages and losses in the occurrence databases cannot be lost sight of. This conclusion is valid for the entire Brazilian territory, especially for municipalities located in regions more susceptible to flash floods, such as the coastal region.
Acknowledgment
The authors of this article thank Dr. Osvaldo Luiz Leal de Moraes and Dr. Andrea Lampis for their valuable comments on the text. This research was made possible thanks to the support from CEMADEN through DTI (Technological and Industrial Development) Research Grants No. 380017/2020-2 and PCI (Institutional Training Program) No. 302384/2021-9, provided by the National Council for Scientific and Technological Development (CNPq). Finally, we extend our gratitude to the São Paulo Research Foundation, FAPESP, through the INCT-II project, subcomponent Natural Disasters, urban areas, infrastructure, and urban development.
References
- Peterson M (2001) Impacts of Flash Floods. In: Coping with Flash Floods. In: Gruntfest E, Handmer J (Eds.), NATO Science Series, Serie 2 - Environmental Security 77: 11-13.
- CRED, UC Louvain (2023) Emergency Events Database EM-DAT, Brussels, Belgium.
- BRASIL (2022) Ministério do Desenvolvimento Regional. Secretaria de Proteção e Defesa Civil. Universidade Federal de Santa Catarina. Centro de Estudos e Pesquisas em Engenharia e Defesa Civil. Atlas Digital de Desastres no Brasil. Brasília: MDR.
- Gall M, Cutter S (2016) Understanding Disaster Risk Through Loss Data. In: International Bank for Reconstruction and Development. (org.). Solving the Puzzle. The World Bank, pp. 70-73.
- Gall M, Kreft S (2013) Measuring what matters? A suitability analysis of Loss and Damage databases for the climate change convention process.
- IBGE (2022) Cidades e Estados do Brasil.
- Marulanda MC, Cardona OD, Barbat AH (2010) Revealing the socioeconomic impact of small disasters in Colombia using the DesInventar database. Disasters 34(2): 552-570.
- Panwar V, Sen S (2020) Disaster Damage Records of EM-DAT and Des Inventar: A Systematic Comparison. Econ Dis Cli Cha 4: 295-317.
- Dolman DI, Brown IF, Anderson LO, Warner JF, Marchezini V, et al. (2018) Re-thinking socio-economic impact assessments of disasters: The 2015 flood in Rio Branco, Brazilian Amazon. International Journal of Disaster Risk Reduction 31: 212-219.
- Wallemacq P, House R (2018) Economic Losses, Poverty & Disasters.
- World Bank (2009) Avaliação de Perdas e Danos. Inundações Bruscas em Santa Catarina. Documents and reports.
- CEPED, UFSC (2013) Atlas Brasileiro de Desastres Naturais, 1991 a 2012. Centro Universitário de Estudos e Pesquisas Sobre Desastres, Universidade Federal de Santa Catalina.
- CEPED, UFSC (2020) Relatório de danos materiais e prejuízos decorrentes de desastres naturais no Brasil (1995-2019).Brasil.


