


Nitrogen Management Strategies for Enhancing its use Efficiency and Environmental Performance of Indian Agriculture
K Sammi Reddy1*, B M K Raju1, V K Singh1, M Prabhakar1, M. Eshwar1, P S Basavaraj2, and S K Chaudhari3
1Central Research Institute for Dryland Agriculture, India
2National Institute of Abiotic Stress Management (NIASM), India
3Natural Resource Management Division, Indian Council of Agricultural Research, India
Submission: January 27, 2023; Published: February 15, 2023
*Corresponding author: K Sammi Reddy, Director, National Institute of Abiotic Stress Management (NIASM), Malegaon, Baramati, Pune district, Maharashtra – 413115, India
How to cite this article: K Sammi Reddy, B M K Raju, V K Singh, M Prabhakar, M. Eshwar, P S Basavaraj, and S K Chaudhari. Nitrogen Management Strategies for Enhancing its use Efficiency and Environmental Performance of Indian Agriculture. Int J Environ Sci Nat Res. 2023; 31(5): 556321. DOI 10.19080/IJESNR.2023.31.556321
Abstract
Although, the food grain production showed remarkable increase with increase in fertilizer N use over the time, the average global N use efficiency (NUE) is quite low (0.460). Thus, the rest of the N input (54%) into cropland contributes towards environmental air and water pollution. Over the 60% of N pollution is estimated to originate from crop production. United General Assembly has proposed the NUE as an indicator for assessing the progress made in achieving Sustainable Development Goals. Sustainable N Management Index (SNMI) approach can be used to assess the environmental performance of agriculture at country and global level. Global NUE should be raised to 0.70 by 2050 while achieving the crop production targets to reduce the N waste to desired level. India is the 3rd largest fertilizer consumer after USA and China. It is necessary to increase the average NUE of Indian agriculture to 0.70 to achieve the global NUE target by 2050. Therefore, the current status of NUE and SNMI was assessed at country level as well as in different states of India during the last 10 years (2010-11 to 2019-20) in the present study to identify crop production constraints of low NUE and to suggest crop-specific and state-specific N management strategies. The mean NUE at country level was very low which varied from 0.451 in 2015-16 to 0.527 in 2017-18. The low NUE resulted in huge N surplus (Nsur) which actually contributes to environmental pollution varied from 13.45Tg in 2017-18 to 15.8Tg in 2015-16. The lower NUE and higher Nsur led to the relatively higher SNMI during the last 10 years which is directly proportional to the environmental pollution. Mean NUE of the last 10 years of 32 states and union territories showed the highest NUE of 0.878 in Nagaland and the lowest in Puducherry (0.196). The NUE and environmental performance of Indian agriculture increases at international level only when the environmental performance of agriculture and NUE of different states and UTs would improve. The 32 states and UTs under assessment were divided into 5 groups based on the NUE and fixed the target increase in NUE by 2050 for each group to achieve overall NUE of 0.70 at country level. In each group the major constraints responsible for low NUE were identified and suggested the measures to improve NUE to target level.
Keywords: Nitrogen use efficiency; N surplus; Sustainable nitrogen management index; Environmental performance
Highlights:
a) The current status of nitrogen use efficiency (NUE) and Sustainable N management index (SNMI) of Indian Agriculture was assessed at country level as well as in different states of India during the last 10 years (2010-11 to 2019-20) to identify crop production constraints of low NUE and to suggest crop-specific & state-specific N management strategies.
b) The 10-year mean NUE of Indian agriculture was very low (0.487) with a mean SNMI of 0.542. The poor NUE left about 51.3% of total N applied to croplands as N surplus in soils which leads to environmental pollution. The normalized SNMI value varied from 56.55 in 2015-16 to 64.28 in 2017-18 with a mean of 60.29. There is a need to enhance the NUE of Indian agriculture to the projected global NUE of 0.700 by the year 2050 to raise the environmental performance of Indian agriculture to global level.
c) Mean NUE of the last 10 years of 32 states and union territories of India showed the highest NUE of 0.878 in Nagaland and the lowest in Puducherry (0.196). The states were categorized into 5 groups based on the NUE. The crop production constraints responsible for low NUE were identified in each group and the crop specific & state specific measures were suggested to raise NUE to desired level so that the country level goal could be achieved by 2050.
Introduction
To feed the expected 10 billion people by 2050, the world food production needs to increase by 56% comparing to the base year of 2010. The food production should increase without expanding the agricultural land as there exists a 593 million-hectare land gap between global agricultural land area in 2010 and expected agricultural expansion by 2050. Among the plant nutrients, nitrogen (N) is a critical element for crop growth and consequently an important determinant of food supply. About 48% of world’s population depending on food produced arising from the use of N inputs [1]. Thus, the N inputs for crop production have increased rapidly accounting for about 85% of total anthropogenic N inputs to the global N cycle in 2010. Agriculture thereby became the major driver of the global N cycle. Although, the food grain production showed remarkable increase with increase in fertilizer use particularly N over the time, the N use efficiency (NUE) is quite low (46% global average NUE) depending upon the crop /cropping system, crop variety, soil type, climate, extent of irrigation, agronomic management, weather aberrations etc.Thus, the rest of the N input (about 54%) contributes towards environmental air and water pollution [2]. Over the 60% of N pollution is estimated to originate from crop production. In monetary terms, reactive N (Nr) pollution is estimated to cause damages in the magnitude of 0.3-3% of global gross domestic product (GDP) [3].
NUE is the fraction of all N inputs [fertilizers, organic manures, biological N fixation (BNF), N deposition] that is harvested as crop products [1]. Improving NUE is one of the most effective means of increasing crop productivity while decreasing environmental pollution. United General Assembly has proposed the NUE as an indicator for assessing the progress made in achieving Sustainable Development Goals. NUE measures the efficiency of N use in agricultural production and it is usually considered to be positively related to the environmental performance of agricultural production. However, using only NUE to rank country’s performance under the Sustainable Development Goal 2 (SDG2) could be problematic due to two reasons: (i) Generally NUE should be between 0 to 1, with values between 0.5 and 0.9 indicating efficient N use and low N losses. But NUE may become greater than 1 when the crop system is mining the soil N which degrades soil fertility and lowers crop yield in the long-term, and (ii) NUE is usually high when both N inputs and crop yields are low which is not compatible with achieving the first part of SDG2 of reducing hunger [4] Therefore, they have proposed the sustainable nitrogen management index (SNMI) to provide a more comprehensive measurement of the environmental performance of the agricultural production. SNMI considers both the types of efficiencies in crop production i.e., NUE and land use efficiency (Crop yield, N yield) in a one-dimensional ranking score.
Currently, after China and United States, India rank third for fertilizer N consumption in the world and first in the South Asia. In India, the fertilizer consumption increased from 0.74 million tonnes (Tg) N, 0.25Tg P2O5 and 0.11Tg K2O (total 1.1Tg) in 1966-67 to 18.9Tg N, 7.4Tg P2O5 and 2.6Tg K2O (total 28.9Tg) in 2019-20, respectively with the corresponding increase in food grain production from 74.2Tg in 1966-67 to 296.6Tg in 2019-20 [5]. Soil fertility maps of India showed that about 95% soils in 1976, 90% soils in 2002 and 93% in 2011 were low to medium in available N [6]. So N fertilizers have been playing key role along with other deficient major, secondary and micronutrients in increasing food grain production. Although, the food grain production showed remarkable increase with increase in fertilizer use particularly N over the time, the N use efficiency (NUE) is quite low (30-50%) depending upon the crop/cropping system, crop variety, soil type, climate, extent of irrigation etc. [7]. Thus, the rest of the N input (about 50-70%) contributes towards environmental air and water pollution, climate change, biodiversity loss and ozone depletion making India a hot spot for the deposition of N species. Overall, N management is closely related to at least nine Sustainable Development Goals, including those focusing on food supply and pollution. Environmental Performance Index 2020 (EPI2020) has ranked India at 108 with normalized SNMI score of 34.7 in agriculture out of 180 countries [8].
Meeting 2050 food demand of 107Tg N yr-1 projected by the FAO [9] while reducing N surplus from the current 100Tg N yr-1 to a global limit of 50Tg N yr-1 requires the broad increase in NUE. There is a need to increase the global average NUE from the current 0.46 to 0.70 while increasing the N yield from 74Tg N yr-1 to 107Tg N yr-1 to achieve the global surplus target [1]. The average increase in global NUE could be achieved if average NUE rose to 0.75 in EU and USA, to 0.6 in China and rest of Asia and to 0.70 in other countries including sub-Saharan Africa. Since India is the third largest fertilizer N consumer and hot spot of N deposition, enhancing the NUE in agriculture to 0.7 by 2050 not only helps India to raise its environmental performance of agriculture, crop productivity and profitability but also leads to achieve global and regional N surplus targets.
Nitrogen lost to the environment could be mitigated by 41% if it’s allocation is optimized among the regions [10]. Even greater mitigation is possible if N resources can be efficiently reallocated on sub-regional basis. The combined effect of all mitigation actions can lower global Nr losses to 95Tg Nr in 2050. Therefore, there is a need to assess the environmental performance of agriculture at country level as well as at state or regional level within each country to understand the current environmental performance of country and state considering the global targets of food production, NUE and N Surplus and to implement crop specific and location specific N management strategies to reduce N pollution while achieving food grain production targets. In the current study, the environmental performance of Indian agriculture in terms of N yield, NUE and SNMI at country level during the last 10 years was assessed for global comparison. The environmental performance of agriculture of different states of India were also assessed to understand the current position of each state and to identify major constraints and to suggest state-specific and crop specific N management strategies for achieving NUE targets.
Materials and Methods
Computation of Nyield and nitrogen use efficiency (NUE)
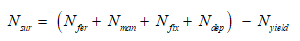
Major nitrogen (N) inputs into the agriculture include fertilizer N application (Nfer), Manure N application (Nman), biological N fixation (Nfix), and atmospheric deposition (Ndep). Total N input is the sum of fertilizer N consumed in India/year, contribution from BNF/year, Manure N/year, and atmospheric deposition of N (both dry and wet deposition)/year. In case of atmospheric N deposition, N deposited over net sown area (139.22-141.34m ha) in each year was computed at the rate of 14.15kg N ha-1 which include both wet and dry deposition in India [11]. The N input into the gross cropped area (182.57-191.32m ha) through the biological N fixation in each year was computed at the rate of 27.54kg N ha-1 [12]. The N input into the gross area of cropland in each year through manure application was computed at the rate of 22.89kg N/ha [13]. After these computations, total N input was expressed in terms of Tg N yr-1 as well as kg N ha-1 yr-1. Fertilizer N input into crop lands each year for different states and whole country was obtained from Fertilizer Statistics (2010-11 to 2019-20) [14].
Major N outputs from agricultural soils are total N removed by crops (N yield) including any part of the crop that is removed from the field. Total N removed (N yield) by different crops from soils was computed on the basis of total N removal (grain + straw) per specified economic yield (Table 1). For this purpose, year-wise production data of different crops in different states and India was collected from a publication of Agricultural Statistics at a Glance [15]. The difference between the N inputs and outputs is lost to the environment or remains in soil (Nsur). The major assumption is that the long-term (e.g., over a decade) the average change of N in soil is negligible and is small relative to the annual N input, then we can assume that N surplus is a reasonable index of N lost to the environment over the long term [1].

Nitrogen Use Efficiency (NUE) also called the N recovery ratio is the ratio of N yield to N input (NUE= N yield/N input).
The N input, N yield, SNMI and Normalized score of SNMI were computed for whole India as well as different states of India for the last 10 years (2010-11 to 2019-20) to evaluate the environmental performance of Indian Agriculture using SNMI as an indicator.
Computation of sustainable nitrogen management index (SNMI)
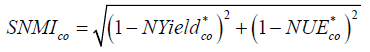
The agricultural Sustainable Nitrogen Management Index (SNMI) is defined to make a more comprehensive measurement of the environmental performance of the agricultural production. Here, the SNMI is defined based on two important efficiency terms in crop production, namely Nitrogen Use Efficiency (NUE) and Land Use Efficiency (N Yield) [4].
NUE is defined as the fraction of all nitrogen inputs (fertilizers, manures, N fixation, N deposition) that is harvested as crop products [4]. Usually, NUE should be between 0~1. NUE measures the efficiency of nitrogen (N) use in agricultural production, and it is usually considered to be positively related to the environmental performance of agricultural production. However, directly using only NUE to rank country’s performance under the Sustainable Development Goal 2 (SDG2) could be problematic. Therefore, SNMI was defined considering both types of efficiencies in crop production, namely NUE and land use efficiency (crop yield, 𝑁 𝑌𝑖𝑒𝑙𝑑).
SNMI of a country is derived as
Where,
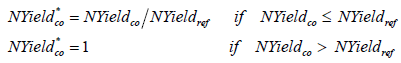
 is Nitrogen yield of a country on 0-1 scale computed as Nitrogen yield of the country
  in kg ha-1 yr-1 divided by global reference
  of 90kg ha-1 yr-1 [1,2].
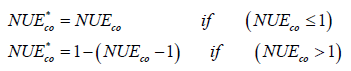
 is Nitrogen Use Efficiency of a country on 0-1 scale
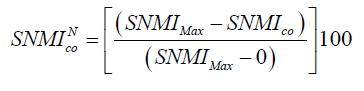
After computing SNMI for all countries based on NUE and N yield, relative score of a country on a scale of 0-100 is calculated using the following normalization method.
Where,
 is normalized SNMI of a country.
 is maximum SNMI among the countries under evaluation.
Zero is the lowest possible SNMI which is ideal and set as target.
SNMI is inversely related to sustainability or environmental performance whereas normalized SNMI is directly proportional to sustainability or environmental performance. High normalized SNMI score indicate relatively high sustainability or better environmental performance.
After computing SNMI based on NUE and N yield, Normalized SNMI Score for India on a scale of 0-100 was calculated using the following normalization method.
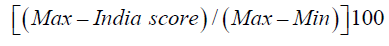
The Environmental Performance Index 2020 (EPI2020) provides a data-driven summary of the state of sustainability around the world [8]. EPI2020 ranked 180 countries on environmental health and ecosystem vitality using 32 performance indicators across 11 issue categories. Max was the SNMI of 180th rank country in EPI2020. As it is not available from the documents, worst SNMI (99th percentile) of 1.3641 was used in place of Max and zero was taken as Min (best SNMI) while computing normalized SNMI score at country level [8].
States of India was also be evaluated for SNMI in a similar fashion by replacing country (co) with state (s) in the formula. While computing normalized SNMI of a state, maximum SNMI score among the states in each year under evaluation was used for  .
.
Limitations
a) The variation in the contribution from the BNF and organic manure to the N input from year to year might be due to the slight variation in the gross cropped area from year to year. The gross cropped area varied from 182.86m ha in 2012-13 to 189.44m ha in 2016-17.
b) Reference N Yield Target (90kg N ha-1): India has achieved self-sufficiency in food grains production. Food grains demand projections [16] made for 2020 were achieved by 2019-20 [17]. Nutritional security should follow the food security. In view of this a modest target of 90kg N ha-1 yr-1 is considered a reasonable reference yield for computing SNMI. Food grains demand projected for India (assuming 7% growth in GDP) for 2050 is 375-380Tg which calls for an N yield of about 105kg N ha-1 yr-1 [18]. The N yield target of 90kg N ha-1 yr-1 would be incrementally enhanced at the rate 1 per two years so that the target for 2050 becomes 105kg N ha-1 yr-1. Thus, the global reference N yield of 90kg N ha-1 yr-1 is also relevant to Indian agriculture [1,4].
c) Major N outputs from agricultural soils are total N removed by crops (N yield) including any part of the crop that is removed from the field. Total N removed (N yield) by different crops from soils has been computed on the basis of total N removal (grain + straw) per specified economic yield [14,19]. The N removed from soil per specified economic yield target were computed by Swarup et al. [19] from 3-year or more old field experiments and are being used widely in Indian research papers.
Results
NUE and SNMI at country level during the last 10 years
Total N input into Indian cropland during the last 10 years (2010-11 to 2019-20) increased from 28.03Tg to 30.5Tg with a steep in the input by 3.5% in 2018-19 and 8.8% in 2019-20 over that of 2010-11 (Table 2). The N input fluctuated around the 28Tg during 2010-11 to 2017-18. Majority of the contribution to total N input was from the fertilizer N which varied from 59% in 2010-11 to 61% in 2019-20. The contribution of biological nitrogen fixation (BNF) of total input varied from 17.27% in 2019-20 to 18.53% in 2012-13. Organic manures application contribution to total N input varied from 14.36% to 15.34% during the last 10 years. The atmospheric deposition of N on the net sown area varied from 1.97Tg yr-1 to 2.00Tg yr-1. This variation was observed due to the slight variation in the net sown area from 139.9m ha in 2010-11 to 141m ha in 2019-20.

The N yield (Total N removal by crops) varied from 12.95Tg in 2015-16 to 15.42Tg in 2019-20. The NUE was very low which varied from 0.451 in 2015-16 to 0.527 in 2017-18. The low NUE resulted in huge N surplus (Nsur) which actually contributes to environmental pollution. The Nsur varied from 13.45Tg in 2017-18 to 15.8Tg in 2015-16 which may be due to variation in the crop production. The lower NUE and higher Nsur led to the relatively higher SNMI during the last 10 years which varied from 0.487 in 2017-18 to 0.593 in 2015-16 which is directly proportional to the environmental pollution. Higher the SNMI higher will be the environmental pollution. The normalized SNMI is directly proportional to NUE and inversely proportional to the SNMI. The highest normalized SNMI was observed in 2017-18 and the lowest in 2010-11 which indicates that the environmental performance of Indian agriculture in terms of SNMI is increasing over the last 10 years.
NUE and SNMI in different states of India during the last 10 years
In India, improved technologies are being demonstrated and promoted in villages by state governments through Krishi Vigyan Kendras (KVK) (Farmers’ Science Centres), State department of agriculture, State Agricultural Universities (SAUs) etc. So, it is essential to assess the current status of NUE and constraints in each state to identify regional and crop-specific technologies for implementation on farmers’ fields. At present, India has 28 states and 8 union territories (UTs) out of which the environmental performance in terms of SNMI was assessed for all 28 states and 4 union territories during the last 10 years (2010-11 to 2019-20) (Table 3, Figure 1). The remaining 4 union territories (Chandigarh, Dadra Nagar Haveli and Daman Diu, Ladakh and Lakshadweep) were not considered as there was no consistency in data availability and further their contribution to the agriculture production is also very minimal. Year-wise data on N input, N yield, N surplus, NUE, SNMI, normalized SNMI, gross and net sown area for all 32 states is furnished in supplementary information. The 10-year average total N input into agriculture was the highest in Uttar Pradesh followed by Madhya Pradesh, Rajasthan, Maharashtra, Gujarat, Punjab and the lowest in Goa depending upon the gross cropped area (Table 3). The N input per unit area showed that the highest N input was in Puducherry (541.64kg ha-1 yr-1) followed by Punjab, Haryana, Telangana etc. and was lowest in Sikkim (59.58kg N ha-1 yr-1). The average N yield varied from 2.354Tg yr-1 in Uttar Pradesh to 0.0006Tg N yr-1 in Andaman & Nicobar Islands (A&N Islands). The N yield per hectare varied from 148.8kg N ha-1 yr-1 in Punjab to 33.09kg N ha-1 yr-1 in Mizoram depending upon the productivity of different crops. The Nsur which depends on N input and N yield showed that it varied from 2.31Tg N yr-1 in Uttar Pradesh to 0.0009Tg N yr-1 in A & N Islands. But when Nsur expressed per unit area, it varied from 446.61kg N ha-1 yr-1 in Puducherry to 7.77kg N ha-1 yr-1 in Nagaland. As expected, contrary to the trend of Nsur, the highest NUE of 0.878 was observed in Nagaland and the lowest was in Puducherry (0.196). Generally north-east Indian states such as Arunachal Pradesh, Assam, Meghalaya, Nagaland, Tripura recorded higher NUE of more than 0.700. The SNMI which is inverse proportion to the trend of NUE, varied from 0.234 in Assam to 0.869 in Mizoram. But the contribution of north-east states to Indian agriculture production is very less and out of 32 states and UTs, 14 states contribute almost 91% of the Indian agricultural production. Among these 14 major agriculture states, the SNMI was the lowest in Punjab and highest in Maharashtra state (Figure 2). In Punjab, the highest N yield (148.8kg N ha-1 yr-1) and moderate NUE (0.604) resulted in the lowest SNMI (0.395) with normalized SNMI score of 54.52 with the 3rd rank among the 32 states and UTs studied. The normalized SNMI score varied from 73.11 in Assam with 1st Rank to 7.21 in Puducherry with 31st rank and further worst to 0 in Mizoram indicating the poorest environmental performance of Puducherry and Mizoram agriculture due to the highest N input and lowest NUE. Among the 14 major agriculture states, as expected Punjab has got the best rank of 4th with normalized SNMI value of 54.52 followed by West Bengal (5th Rank), Madhya Pradesh (6th Rank), Tamil Nadu (7th Rank) and the poorest rank (30th) in Maharashtra. The status of NUE vis-a-vis the environmental performance of these major states needs to be improved during next few decades by 2050 as per the FAO suggestions [5].


The evidence for environmental Kuznets curve (EKC) pattern of declining N pollution with improving NUE in agriculture was observed [1]. Indian agriculture should meet the NUE goal of 0.7 by 2050 to restrict the N pollution within the set target [1]. The environmental performance of Indian agriculture and NUE increases at international level only when the environmental performance of agriculture and NUE of different states and UTs would improve. Thirty-two states and UTs under assessment were divided into 5 groups based on the NUE (Table 4). First group of six states namely Arunachal Pradesh, Assam, Meghalaya, Nagaland, Tripura (North-East states) and Delhi have NUE more than 0.70. Except Delhi, in the remaining 5 states, NUE was very high as both N inputs and crop yields were low which is not compatible with achieving the first part of SDG2 of reducing hunger. There is a need to improve the NUE by 0.1 in these six states by improving the crop and N yields. The second group of Jharkhand, Manipur, Sikkim, Himachal Pradesh, Punjab, and Madhya Pradesh have NUE of 0.6 - 0.7 which should be improved by 0.15 during next 3 decades. Third group of 7 states had NUE of 0.5 - 0.6 (West Bengal, Haryana, Uttar Pradesh, Tamil Nadu, Rajasthan, A&N Islands, Goa). The NUE of this group of states should be improved to 0.70 - 0.80 by 2050. The fourth group of 5 states (Mizoram, Odisha, Jammu & Kashmir, Uttarakhand, Gujarat) had NUE of 0.4 - 0.5 which would be improved by 0.25 by 2050. The last and the 5th group of 8 states (Bihar, Andhra Pradesh, Telangana, Karnataka, Kerala, Puducherry, Chhattisgarh, Maharashtra) had NUE below the world average NUE (0.46) [2]. These states are very important to achieve the SDG2 goal of food production as well as the NUE as they contribute to food grain production of India significantly. There are plenty of chances to improve the NUE by 0.30 and food grain production in 5th group of states as these states have lot of potential.

Discussion
NUE and SNMI at country level during the last 10 years
There was a steep increase in the N input by 3.5% in 2018-19 and 8.8% in 2019-20 over that of 2010-11. Higher N input including fertilizer N during the recent 2 years resulted in record food grain production in India. During 2019, the South-West monsoons were favorable and reported at 110% of its long period average rainfall. In the year 2020, the reservoir levels in certain key areas were higher than levels in 2019 and vis-à-vis the 10-year average levels. Moreover, the rainfall in the monsoon season of 2020 was predicted to be normal. As a result, 2020 monsoon sowing was early and higher than previous years which resulted in steep increase in fertilizer N consumption and food grain production [20]. The food grain production was 285.3Tg in 2018-19 and 296.5Tg in 2019-20 [14]. Higher food grain production also resulted in higher N yield (79.8-82.8kg N /ha-1 yr-1) during the last two years. Similarly, the variation in atmospheric N deposition was observed due to the variation in the net sown area from 139.9 m ha in 2010-11 to 141m ha in 2019-20. Country level NUE was low i.e., below 0.5 during the period from 2010-11 to 2015-16 (Table 2). But it was increased to above 0.5 during the last 4 years with the highest NUE in 2017-18 (0.527) which may be due to introduction of neem coated urea in place of normal urea. There was a major policy change in India with respect to urea. In order to increase the NUE of urea the Indian Government has made it mandatory for urea manufacturers to produce entire urea as neem coated urea including imported urea from June 2015 onwards. As a result entire urea utilized in India was replaced by neem coated urea from monsoon season of 2016. Application of neem coated urea (NCU) at recommended rates improved the yield of paddy, sugarcane, maize, soybean and pigeon pea to an extent of 5.8, 17.5, 7.1, 7.4, and 16.9%, respectively and also improved the NUE by 5-10% over the normal urea (NU) [21]. Lower NUE in crop production leads to higher Nsur, higher SNMI and higher environmental pollution. The NUE of India is very low as compared to USA and Canada (0.68). The last 10-year average NUE of India was 0.487 and the latest 4-year average NUE was 0.502. Zhang et al. [2] quantified global and national N budgets for crop production of 115 countries over 1961-2015. With respect to India, they considered N input of 25Tg N yr-1 whereas in the present study it is 28.03Tg N yr-1 for the year 2010-11. The N yield was 8Tg yr-1 in Zhang et al. [1,2] whereas N yield here is 13.03Tg yr-1 so NUE is 0.465 against 0.30, respectively. It seems the N yield was underestimated in their computations. Globally about 161Tg of N were applied to crop lands but only 73Tg of N made it to the harvested crops which means a total of 86Tg of N was ending up in the air, water and soil [2]. The average global NUE in agriculture needs to improve from 0.46 to 0.7 to meet dual goals of food security and environmental stewardship in 2050 [1]. Keeping in view global concerns, The EU nitrogen expert panel recommended a NUE of about 0.900 as an upper limit for crop production. To achieve global targets of NUE, India would be the most urgent place to improve the NUE as it is one of top fertilizers users in the world after USA, China. Enhancing crop production and NUE depends upon several factors including climate, soil type, irrigation potential, crop varieties, socio-economic condition of farmers, Government policies etc. About 52% of net sown area in India is under rainfed condition with 84% of marginal and small farmers having < 2 ha land holding. Even then India can’t be left out to fix NUE targets with the available resources. Since India has already achieved the NUE of above 0.50 in the recent past, it can easily target the NUE to improve to 0.7 by 2050. There is a need to assess the status of crop productivity and NUE at state level as India is a sub-continent with wide variation in climate, rainfall, soil type, crop type, irrigation, food habits, crop management practices etc. to develop regional and crop specific action plans for achieving the set NUE target of 0.70. Therefore, in this study an assessment of NUE has also been made at state level using the state-wise crop production data and fertilizer N input during the last 10 years.
NUE and SNMI in different states of India during the last 10 years
The NUE of different states determines the crop productivity, profitability and environmental performance of agriculture. The critical analysis of current status of NUE and constraints in various states is essential to develop a strategy for enhancing NUE in different states by fixing targets. The 10-year average total N input into agriculture may not give correct trend as the total N input depends on the gross cropped area. The gross cropped area was highest in Uttar Pradesh and so the N input was also highest in this state (Table 3). The N input per unit area was highest in Puducherry state (541.6kg N ha-1 yr-1). A study needs to be undertaken in Puducherry to understand whether the fertilizer N purchased by it is consumed in Puducherry itself or transported to neighboring states. After Puducherry, the N input was higher in Punjab followed by Haryana but the N yield was also higher in Punjab and Haryana due to higher crop productivity (3981 - 4658 kg food grains ha-1) with highest percent irrigated area (92-98% of net sown area) [14]. Therefore, reasonably less Nsur in these states. The results clearly showed that the crop productivity determines the Nyield, Nsur, and NUE. The SNMI, an indicator of environmental pollution is inversely related to NUE. The status of NUE vis-a-vis the environmental performance of all major states needs to be improved to enhance average NUE of India to 0.70 during next three decades by 2050 to achieve the global targeted N surplus (50Tg N yr-1) [5].
North-east Indian states (Arunachal Pradesh, Assam, Meghalaya, Nagaland, Tripura) and Delhi recorded higher NUE of more than 0.700. The SNMI which was in inverse proportion to the trend of NUE, varied from 0.234 in Assam to 0.869 in Mizoram. The contribution of north-east states to Indian agriculture production was very less. Out of 32 states and UTs, 14 states contributed almost 91% of the Indian food grain production (Figure 2). Among these 14 major agriculture states, the SNMI was the lowest in Punjab and highest in Maharashtra state. In Punjab, the highest N yield (148.8kg N ha-1 yr-1) and moderate NUE (0.604) resulted in the lowest SNMI (0.395) with normalized SNMI score of 54.52 with the 3rd rank among the 32 states and UTs studied. The normalized SNMI score varied from 73.11 in Assam with 1st Rank to 7.21 in Puducherry with 31st rank indicating the poorest environmental performance of Puducherry agriculture due to the highest N input and lowest NUE.
Zhang & Davidson [1] has suggested the reference yield level which is defined to measure a country's progress in achieving a certain yield target which addresses land use efficiency and food security. In this study the reference N yield would be targeted at 90kg N ha-1 yr-1 which is approximately the desired global average N yield to meet food production targets of 2050 without expanding the current agriculture area [5]. The N yield at country level varied from 69.64kg ha-1 yr-1 in 2010-11 to 82.84kg N ha-1 yr-1 in 2019-20 which was below the FAO targeted N yield of 90kg N ha-1 yr-1. Among the 32 states and UTs, only 6 states (Haryana, Punjab, Uttar Pradesh, Delhi, Tamil Nadu and Puducherry) had the N yield more than the reference N yield (Figure 2). Punjab, Haryana, Uttar Pradesh and Tamil Nadu contribute significantly to the food grain production. Therefore, there is a plenty of scope to improve the N yield thereby NUE and crop production. Historical trends of Nyield, NUE and Nsur for India was presented earlier for the period of 5 decades (1961-2011) using the projected data [1]. This data showed a smoothen trend line for India for the said period, but when actual crop production data was used for computing Nyield, there were ups and downs in the Nyield due to variation in the crop production mainly depending upon the rainfall and other weather aberrations during the last 10 years (Figure 2). During the last 10 years, one or other parts of India suffered from weather aberrations such as prolonged dry spells/droughts/floods/excessive rainfall etc. [22].
A strategy has been suggested to enhance NUE of India to 0.700 by 2050 from the existing mean NUE of 0.510 by fixing the NUE targets to different states based on the present status of NUE. The 32 states and UTs under assessment were divided into 5 groups based on the NUE (Table 4). Six states namely Arunachal Pradesh, Assam, Meghalaya, Nagaland, Tripura (North-East states) and Delhi had NUE more than 0.700. The NUE was very high in north east states as both N input (82.6kg N ha-1 yr-1) and crop productivity were low which is not compatible with achieving the first goal of SDG2 of reducing hunger. There is a potential to improve the NUE by 0.1 in these states by improving the crop productivity and N yield. In north-east India, land is almost virgin and the crops were grown virtually organic with low inputs under subsistence farming. Major niche crops grown in north-east states are lemon, medicinal rice, passion fruit, pineapple, orange, cardamom, and ginger. Therefore, Indian Government is developing organic farming hub in north-east India to meet the demand for organic products. This region has a potential of about 47Tg of organic manures including 37Tg from animal excreta and 9Tg from crop residues. Crop productivity and NUE can be improved through integrated farming system models which comprise ex-situ/in-situ rainwater harvesting, livestock particularly piggery and poultry, legume crops along with niche crops, composting, cover crops, biofertilizers etc. [23]. These studies also suggested to occupy at least 30% of cropped area under legumes for higher productivity and N use efficiency. In Delhi, the crop productivity was better than north east states but needs improvement in NUE.
The second group of Jharkhand, Manipur, Sikkim, Himachal Pradesh, Punjab, and Madhya Pradesh have NUE of 0.6 - 0.7 which should be improved to 0.75-0.85 during next 3 decades. In India, the highest crop productivity (4.7t ha-1) was attained in Punjab with 84% irrigated area. The popular perception is that the crop yield plateau was attained in Punjab and may not possible to further improve the crop productivity. But contrary to this perception, the average wheat yield of Punjab increased by 2.4 times from 2.73t ha-1 in 1980-81 to 6.5t ha-1 in 2017-18 due to two factors i.e., (i) improved variety of wheat (HD 2967) and (ii) incorporating the uncut paddy straw back into soil instead of burning in rice - wheat cropping system. It shows an opportunity to further improve the NUE in Punjab with integration of crop variety with best agronomic practices. Another important state in this group is Madhya Pradesh (MP) which contributed about 11.3% (32.3Tg) to total India's food grain production (285.3Tg) in the year 2018-19. The average productivity of food grains in Madhya Pradesh (MP) was very low (2t ha-1) as compared to that of national average (2.3t ha-1). Soybean (5.4m ha) and rice (2.4m ha) in monsoon season and wheat (5.5m ha) and gram (3.1m ha) in winter season were major crops in MP. There is a lot of potential to improve NUE in MP with crop specific strategies as it is bestowed with black soils (80%) and higher average annual rainfall (>1000mm). Addressing water logging, nodulation, micro-nutrients (Zn, Mo) and sulphur management with pest tolerant variety in soybean improved the average productivity (1.2 to 2.5t ha-1) [24]. Similarly, improved variety, irrigation, S and Zn management in wheat improved the grain yield and NUE. Seed treatment with bio-fertilizers, 1 or 2 supplemental irrigations, Zn, Mo and P management, new variety in gram improved the yield from 1.3t ha-1 to 2.0t ha-1. Major crop production constraints in Jharkhand, Manipur, Sikkim and Himachal Pradesh was the soil acidity and emerging micro and secondary nutrient deficiencies [25]. About 28m ha land in north east India (Manipur, Sikkim, Assam, Arunachal Pradesh, Meghalaya, Nagaland, Tripura, and Mizoram), 4m ha in Jharkhand and 0.75m ha in Himachal Pradesh are having soil acidity (pH < 5.5). In India, farmers are reluctant to apply large quantities of liming materials for reclamation due to economic reasons. Hence, it was suggested ameliorating the acid soil with minimum quantities of lime with application of all deficient macro- and micronutrients at recommended rates in a balanced way so that farmers can achieve reasonably good yields of soybean on acid soils [26]. In studies conducted in seven states of India, the application of lime at 200-300kg ha-1 with balanced fertilization improved crop yields by 16-48%. Application of half of the recommended rate of N, P and K with lime produced crop yields at par with or superior to the full dose of NPK without lime [25]. Other strategies discussed above for 6 north east states are also applicable to Manipur and Sikkim.
The current NUE (0.5 - 0.6) should be targeted to increase to 0.70 - 0.80% by 2050 in third group of states (West Bengal, Haryana, Uttar Pradesh, Tamil Nadu, Rajasthan, A&N Islands, Goa). Rice is the major crop in West Bengal and Tamil Nadu states. The average NUE was very poor in rice and rice based cropping systems which varied from 0.3-0.4 due to denitrification losses. Efficient N use rice varieties viz., Nagina-22, Himdhan, Taipe and MTU 1010 need to be promoted on farmers' fields by making availability of sufficient seed [27]. Matching N fertilizer application and rates to the actual requirements of rice crop using leaf colour charts (LCC), PAU-Urea Guide, soil test based N doses etc would reduce N losses and thereby enhance NUE. Demonstrations on LCC on farmers' fields produced higher yields of transplanted rice, maize, wheat, basmati rice, direct seeded rice, and cotton in Bassian village, Punjab [28]. NUE in rice can also be improved by inoculation of seeds with endophytes and rhizobia at sowing and subsequent assimilation of fixed N by rice plants [27]. Rice and wheat occupied major areas to the extent of 1.5m ha and 2.6m ha in Haryana and 5.8m ha and 9.5m ha in Uttar Pradesh, respectively. The strategies discussed above for enhancing NUE in rice are also suitable for Haryana and Uttar Pradesh. Precision N management tools such as green seeker optical sensor recorded 26% higher NUE in wheat as compared to soil test-based fertilizer application [29]. Integrated use of farmyard manure (FYM) at 10-15t ha-1 with recommended dose of NPK produced NUE of 0.72, 0.75, and 0.78 in Maize-wheat in Punjab, Delhi, and Himachal Pradesh states, respectively and NUE of 0.82 in rice-wheat system in Chhattisgarh states [7]. Both central and state governments are promoting integrated farming system (IFS) models involving livestock, field crops, vegetables etc. in Goa which would help in generation of sufficient quantity of dung manure for recycling to enhance crop productivity and NUE. Rice based IFS model (rice-brinjal-mushroom-poultry) produced higher rice equivalent yield, input use efficiency and net income to farmers as compared to only rice crop [30].
The NUE of fourth group of states (Mizoram, Odisha, Jammu & Kashmir, Uttarakhand, Gujarat) should be targeted to increase to 0.65-0.75 from existing NUE of 0.4 - 0.5 by 2050. Cotton and groundnut are the major crops in Gujarat grown in an area of 2.7 and 1.6m ha, respectively. In Gujarat, farmers grow desi cotton in areas where salinity is high and canal irrigation is not available. Improved varieties of desi cotton with short duration need to be made available to the farmers for better yields and higher NUE [31]. Other constraints in cotton production in Gujarat were continuous cropping with only cotton and wider spacing. These could be overcome by promoting crop rotation and encouraging farmers to grow intercrop in wider spaced cotton [32]. Inadequate availability of quality seeds of high-yielding varieties, terminal drought due to early cessation of monsoon and susceptibility to stem and collar rot are the major constraints limiting the productivity gains of groundnut in Gujarat. Sowing of early maturing varieties like GG2, GG5, GG7 etc., protective irrigation, in-situ soil moisture conservation and seed treatment with rhizobium sp can help in increasing groundnut yields thereby NUE. In Odisha, rice is the major crop occupied about 3.9m ha out of 5.8m ha gross cultivable area and grown in both irrigated and rainfed conditions. The productivity of rice in Odisha was very low (2t ha-1) which needs to be improved to enhance NUE by alleviating major constraints such as drought and floods, moderate Fe toxicity in low lands, Zn deficiency and coastal salinity. The strategies discussed for Uttar Pradesh for enhancing NUE in rice and wheat are also applicable to Uttarakhand and Jammu & Kashmir due to same climate and soil type.
The NUE was less than 0.40 in 5th group of states (Bihar, Andhra Pradesh, Telangana, Karnataka, Kerala, Puducherry, Chhattisgarh, Maharashtra). This group is the most important group from agriculture point of view which contributed 23 % of food grain production. The NUE was very less as about 63.6% of net sown area is under rainfed conditions. The net rainfed area is about 81.3% in Maharashtra, 80.8% in Kerala, 68.1% in Karnataka, 67.6% in Chhattisgarh, 54.3% in Maharashtra, 52.1% in Telangana and 40.8% in Bihar. Therefore, increasing the NUE to 0.70 in this group is a major challenge. But there were several success stories in which crop productivity enhanced with integration of rainwater harvesting for supplemental irrigation during prolonged dry spells/droughts with growing diverse crops and best management practices. Pigeon pea, chickpea, soybean, etc. are the major rainfed crops. Farm pond based integrated farming system approach with 2 supplemental irrigations from harvested rainwater during prolonged dry spells increased the pigeon pea seed yield to 20q ha-1 from 10q ha-1 in Farmers' practice. The preparedness with implementation of ex-situ rainwater harvesting in different rainwater harvesting structures and/or in-situ rainwater conservation to overcome weather aberrations would help in enhancing productivity of rainfed crops and NUE. Micro-dosing of fertilizer N application in synchronization with soil moisture under rainfed conditions saved 15-20% of fertilizer N without affecting the crop yields [33]. In maize-horse gram sequence grown on semi-arid Alfisol soil, NUE increased from 0.51 to 0.68 with zero tillage and balanced fertilizer application [33].
Andhra Pradesh and Maharashtra are also major fruit producing states and contribute about 30% of total fruit production in India. The global average NUE in horticultural crops was very low (0.15) [1]. This may also be the reason for low NUE in these states. India has fixed its goal to produce about 500Tg of fruits and vegetables by 2050 to meet its rising domestic and export demands. This may lead to enhanced fertilizer N requirements for horticulture crops in future. Therefore, special attention should be given to enhance NUE in horticulture crops particularly vegetable and fruit crops which constitute about 90% of horticulture crops. Studies with 15N showed that the NUE in banana was only 22.3% when applied through split application [34]. But placement of N fertilizer at 30cm below the soil surface increased NUE to 60% in banana from 6.8% with broadcasted fertilizer N [35]. Excess irrigation was one of the root causes of N loss in horticulture systems. Fertigation through drip irrigation saved 30-70% of irrigation water and increased the yields by 25-80%. Government of India set a target to bring about 0.5m ha under micro-irrigation every year particularly in horticulture crops. The crop combination of capsicum-onion-watermelon-okra increased the NUE to 10.85 to 37.2% compared to solo crops (6.44-19.2%) [34]. Microbial interventions such as Arbuscular Mycorrhizal Fungi (AMF) and Azotobacter were found to increase the NUE through both N fixation and enhancing the N retention time [34].
In India, BNF by pigeon pea was low, 69kg ha-1 and amounted to only 50% of plant N uptake (Rao and Dart 1987). Since most of the pigeon pea grown under rainfed and drought prone stress conditions in India, improvement of N fixation depends upon host crop, rhizobial inoculation selection, improving soil organic matter and repeated seed treatment with biofertilizers. The most probable number (MPN) of rhizobia in pigeon pea were found to range from very low to low (102 cells/g). Pigeon pea has a large potential to enhance NUE. It is suggested to double or even triple current mean yield (850kg ha-1) of pigeon pea by 2030 [27]. There is a need to select rhizobia that are superior symbiotically under moisture stress conditions and seed treatment with such rhizobia in all legumes before sowing should be made compulsory for enhancing NUE [36].
Conclusion
The environmental performance of Indian agriculture in terms of NUE and SNMI at country level and in different states/union territories was assessed using the crop production data of the last 10 years (2010-11 to 2019-20). The NUE of Indian agriculture varied from 0.465 in the year 2010-11 to 0.527 in 2017-18 with a mean of 0.487. There was a corresponding decrease in the SNMI from 0. 0.593 in 2015-16 to 0.501 in 2019-20 with a mean of 0.542. The normalized SNMI value varied from 56.55 in 2015-16 to 64.28 in 2017-18 with a mean of 60.29. There was a wide variation in the mean NUE of different states and union territories. The NUE at state level varied from 0.196 in Puducherry to 0.870 in Nagaland. States/union territories were divided into 5 groups based on the current status of NUE and the target NUE to be achieved by the year 2050 for each group has been suggested. Crop production constraints responsible for low NUE in different states and measures for enhancing NUE in different crops/cropping systems were identified. If all available crop-specific and state-specific technologies or measures are implemented on farmers fields, the crop productivity and NUE targets to the global level could be achieved by 2050. Major recommendations which need immediate focus for enhancing NUE in different crops/cropping systems are;
a) Biological N fixation lead to lower levels of N surplus in soil as it provides a gradual input of fixed N to the soils. Therefore, the fraction of N inputs that are lost to air and water pollution will be less than in fertilizer input system. The goal set for 2030 is to increase biological NUE by at least 20-30% [27]. This target could be achieved by supplying good quality biofetilizers in sufficient quantity to the farmers for seed treatment at the time of sowing of legume crops particularly in pigeon pea, groundnut, chickpea and soybean.
b) Millets need relatively low levels of N input to fix carbon due to their physiological characteristics [37] compared to cereals and are also healthier due to increasing cases of diabetics. Government of India has already initiated several schemes to establish supply chains to promote value added processed foods of millets to increase the area under millets particularly in rainfed areas. There is a need to increase the area under millets in rainfed areas.
c) To achieve the target of NUE of 0.70 by 2050, the neem coated urea should be combined with natural urease inhibitors such as neem plus, vanillin and protocatechuic aldehyde derivatives etc. which are cost effective, socially acceptable and suitable for both tropical and temperate production systems. This option is expected to offer a 5% N saving over neem coated urea which has already achieved 5-10% savings above uncoated plain urea [27]. The immediate goal should be the mass production of plant-based urease inhibitors and supply to farmers.
d) There is a need to reduce losses of N through organic wastes to improve the agronomic NUE across the whole farm. Composting of organic wastes using a closed method instead of traditional unlined pit or open manure heap increased the dry matter recovery to 70% of organic materials from 50-55% with traditional method in Mumtajpur village, Haryana. Such improved composting methods should be promoted among the farmers throughout the country. Adoption of soil test based Integrated Nutrient Management (INM) with adequate use of organic manures and bio-fertilizers would substitute 25-50% of inorganic N fertilizers depending upon crops/cropping systems and also produce higher NUE.
e) More significant gains in NUE could be achieved from the adoption of 5R approach strictly (i.e., right source, right rate, right time, right place and right method of application) customized to local conditions rather than only from the genetic enhancement of NUE. A technique developed by the International Fertilizer Development Centre (IFDC) achieved an NUE as high as 80% in field studies around the world using urea deep placement [38]. Such methods should be promoted among the Indian farmers as a part of package of best practices.
f) Soil test based site specific balanced fertilization of all deficient nutrients to different crops instead of blanket fertilizer recommendations should be promoted among the farmers to achieve target yield potential for higher NUE. The NUE across studies in China, India and North America was increased to 54% for balanced fertilization from 21% for conventional treatment [39].
g) The NUE in fruits and vegetables is very low (0.15 – 0.22). India has fixed its goal to produce about 500Tg of fruits and vegetables by 2050 to meet its rising domestic and export demands. Implementation of improved technologies such as efficient horticulture crop combinations, micro-irrigation, inter crops in orchards, integrated nutrient management, placement of N fertilizer etc. should help in enhancing NUE.
h) Nano-N fertilizers are gaining importance in agriculture for increasing crop yields, enhancing NUE and reducing excessive use of N fertilizers. Results of 730 field demonstrations conducted in different districts of Uttar Pradesh on farmers fields with 12 crops proved that with the 2 sprays of nano-N, the quantity of urea being applied by the farmers to supply nitrogen to their crops can be successfully reduced to 50-75% of recommended dose [40]. Already the nano-N or nano-urea fertilizer was approved by the Government of India and thereby included in the Fertilizer Control Order and consequently respective fertilizer company has already started mass production of nano-N. Once nano-N readily available to farmers in the market for application in major crops such as rice, wheat, maize etc. all over country, the NUE is believed to increase further.
Acknowledgement
The authors are thankful to Dr. Xin Zhang, Appalachian Laboratory, University of Maryland Centre for Environmental Science, Frosbirg, MD, USA for providing methodology and for improving the overall presentation of paper and discussion.
Funding
The authors are highly thankful to the authorities of the Indian Council of Agricultural Research, New Delhi, India, for funding this research work under National Innovations in Climate Resilient Agriculture (NICRA) project.
References
- Zhang X, Davidson EA, Mauzerall DL, Searchinger TD, Dumas P, et al. (2015) Managing nitrogen for sustainable development. Nature 528(7580): 51-59.
- Zhang X, Zou T, Lassaletta L, Mueller N, Tubiello FN, et al. (2021) Quantification of global and national nitrogen budgets for crop production. Nature Food 2: 529-540.
- Bodirsky BL, Popp A, Lotze-Campen H, Dietrich JP, Rolinski S, et al. (2014) Reactive nitrogen requirements to feed the world in 2050 and potential to mitigate nitrogen pollution. Nat Commun 5: 3858.
- Zhang X, Davidson E (2019) Sustainable Nitrogen Management Index (SNMI). Personal Communication.
- FAO (2012) World Agriculture towards 2030/2050: the 2012 Revision. In: Alexandratos N, Bruinsma J (Eds.), Agricultural Development Economics Division of the Economic and Social Development Department Working Paper No. 12-03, Food and Agriculture Organization of the United Nations, Rome.
- Muralidharudu Y, Reddy KS, Mandal BN, Rao AS, Singh KN, et al. (2011) GIS based Soil Fertility Maps of Different States of India. All India Coordinated Research Project on Soil Test Crop Correlation Studies, Indian Institute of Soil Science, Bhopal, pp. 1-224.
- Dwivedi BS, Singh VK, Meena MC, Dey A, Datta SP (2016) Integrated nutrient management for enhancing nitrogen use efficiency. Indian J Fert 12: 62-71.
- Wendling ZA, Emerson JW, de Sherbinin A, Esty DC, et al. (2020) Environmental Performance Index. New Haven, CT: Yale Center for Environmental Law & Policy.
- Newell Price J, et al. (2011) An inventory of mitigation methods and guide to their effects on diffuse water pollution., Greenhouse gas emissions and ammonia emissions from agriculture. (Defra project WQ0106, ADAS and Rothamsted Research), North Wyke.
- Zhang X (2017) A plan for efficient use of nitrogen fertilizers. Nature 543: 322-323.
- Naseem M, Kulshrestha UC (2019) An overview of atmospheric reactive nitrogen research: south Asian perspective. Curr World Environ 14(1): 10-26.
- Rao DLN, Balachandar D (2017) Nitrogen inputs from biological nitrogen fixation in Indian agriculture. In: The Indian Nitrogen Assessment: Sources of Reactive Nitrogen, Environmental and Climate Effects, Management Options, and Policies, Elsevier, pp. 117-132.
- Reddy KS, Kundu S, Arunakumari H, Sharma KL (2021) Potential nutrient stock and emission of greenhouse gases from soil due to application of organic amendments in India. Agric Res J 58(2): 169-182.
- FAI (2020) Fertilizer Statistics - 2019-20, Fertilizer Association of India (FAI), New Delhi, India.
- Anon (2020) Agricultural Statistics at a Glance - 2020. Directorate of Economics and Statistics, Department of Agriculture, Cooperation & Farmers Welfare, Ministry of Agriculture & Farmers Welfare, Government of India, New Delhi.
- ICAR (2019) Vision 2050. Indian Council of Agricultural Research, Krishi Bhavan, New Delhi.
- GoI (2020) Agricultural statistics at a glance 2020. Directorate of Economics and Statistics, Department of Agriculture, Cooperation & Farmers Welfare, Ministry of Agriculture & Farmers Welfare, Government of India, New Delhi, India.
- ICAR (2015) Vision 2050. Indian Council of Agricultural Research, Krishi Bhavan, New Delhi.
- Swarup A, Reddy KS, Tripathi AK (2001) Nutrient mining in Agro-climatic zones of Madhya Pradesh. Fert News 46(4): 33-38 & 41-45.
- Casey, Jessica. (2020) India's fertilizer under pressure. World Fertilizer, 24 September 2020.
- Ramappa KB, Jadhav V, Manjunatha AV (2020) Comparative economics of neem coated area vis-a-vis normal urea: evidence from a field-based study in the Indian context. Economic Affairs 65(2): 275-284.
- Reddy KS (2019) Soil management strategies for climate resilient agriculture in Rainfed areas. J Indian Soc Soil Sci 67 (Supplement): S122-S134.
- Babu S, Singh R, Avasthe PK, Yadav GS (2015) Organic Farming: Problems and Prospects in North East India. In: Eds M Datta, Gulab Singh Yadav, Chandan Debnath, H Lembisana Devi, Vinay Singh, et al. (Eds.), Integrated farming system approaches for sustainable hill agriculture under changing climatic scenario. ICAR Research Complex for NEH Region, Tripura Centre, Lembucherra, West Tripura, India.
- Reddy KS, Mohanty M, Rao DLN, Subba Rao A, Pandey M, et al. (2015) Farmer involvement in the development and adoption of improved nutrient management technologies using the Mother- Baby Trial Approach in Vertisols. Proc Natl Acad Sci India Sec B: Biol Sci 85(1): 51-62.
- Sharma PD, Sarkar AK (2005) Managing acid soils for enhancing productivity. Technical Bulletin, Natural Resources Management Division, Indian Council of Agricultural Research, New Delhi, India.
- Rattan RK (2007) Proceedings of and recommendations from the symposium on nutrient management in acid soils. Bulletin of the Indian Society of Soil Science No. 25, Indian Society of Soil Science, New Delhi, India, pp. 1-3.
- Moring A, Hooda S, Raghuram N, Adhya TK, Ahmad A, et al. (2021) Nitrogen challenges and opportunities for agricultural and environmental science in India. Frontiers in Sustainable Food Systems 5: 1-16.
- Bhatia A, Pathak H, Jain N, Singh PK, Tomer R (2012) Greenhouse gas mitigation in rice-wheat system with leaf color chart -based urea application. Environ Monit Assess 184: 3095-3107.
- Singh V, Kunal, SK Gosal, Choudhary R, Singh R, et al. (2021) Improving nitrogen use efficiency using precision nitrogen management in wheat (Triticum aestivum). J Plant Nutr Soil Sci 184(3): 371-377.
- Korikanthimath VS, Manjunath BL (2009) Integrated farming systems for sustainability in agricultural production. Indian J Agron 54(2): 144-148.
- Ramasundaram P, Gajbhiye H (2001) Constraints to cotton production in India. CICR Technical Bulletin 19, Central Institute for Cotton Research, Nagpur, India, pp. 1-19.
- Nikam V, Chinchmalatpure AR, Rao GG, Kad S, Sharma DK (2018) Farmers perception, economic viability and constraints in Desi cotton cultivation in dryland salinity of Gujarat. J Soil Salin Water Qual 10(1): 118-125.
- Kundu S, Srinivasarao Ch, Mallick RB, Satyanarayana T, Prakash Naik R, et al. (2013) Conservation agriculture in maize (Zea mays )-horsegram (Macrotyloma uniflorum L.) system in rainfed Alfisols for carbon sequestration and climate change mitigation. J Agromet 15 (Special issue I): 144-149.
- Ganeshamurthy AN, Rupa TR, Kalaivanan D, Radha TK (2017) Nitrogen management paradigm in horticulture systems in India. In: The Indian Nitrogen Assessment: Sources of Reactive Nitrogen, Environmental and Climate Effects, Management Options, and Policies. pp. 133-147.
- Murthy SVK, Kotur SC (1998) Effect of ammonium sulphate and super phosphate on the comparative efficiency of N and P absorption and N utilization in Robusta banana (Musa paradisiaca) using labelled fertilizers. Indian J Fert 68: 765-768.
- Rao DLN (2014) Recent advances in biological nitrogen fixation in agricultural systems. Proc India Natl Sci Acad 80: 359-378.
- Wang J, Vanga KS, Saxena R, Orsat V, Raghavan V (2018) Effect of climate change on the yield of cereal crops: a review. Climate 6(2): 41.
- Duncombe J (2021) Index suggests that half of nitrogen applied to crops is lost. Eos, 102.
- Fixen PE, Jin J, Tiwari KN, Stauffer MD (2005) Capitalizing on multi-element interactions through balanced nutrition – a pathway to improve nitrogen use efficiency in China, India and North America. Science of China 48 Suppl 2: 780-790.
- Kumar Y, Tiwari KN, Nayak RK, Rai A, Singh SP, et al. (2020) Nanofertilizers for increasing nutrient use efficiency, yield and economic returns in important winter season crops of Uttar Pradesh. Indian J Fert 16(8): 772-786.


