Water Quality Characterization of Some Village adjoin with Rairu Industrial Belt; District Gwalior (M.P.) With Reference to Heavy Metals
Madhuri Sharma1* and Shakti Bhardwaj2*
1Research Scholar, SMS Govt Model Science College, India
2Professor of Zoology, SMS Govt Model Science College, India
Submission: September 20, 2022; Published: November 07, 2022
*Corresponding author: Madhuri Sharma, Research Scholar, SMS. Govt. Model Science College, Gwalior (M.P.), India
Shakti Bhardwaj, Professor of Zoology, SMS. Govt. Model Science College, Gwalior (M.P.), India
How to cite this article: Madhuri S, Shakti B. Water Quality Characterization of Some Village adjoin with Rairu Industrial Belt; District Gwalior (M.P.) With Reference to Heavy Metals. Int J Environ Sci Nat Res. 2022; 31(3): 556313. DOI 10.19080/IJESNR.2022.31.556313
Abstract
In the present study was carried out to find out the ground water quality at 6 different adjoin villages with Industrial area Rairu, Gwalior M.P. Various physico-chemical parameters, such as pH, Colour, Turbidity, TDS, COD, BOD, Pb and Cd were studied through the water analysis. The results were compared with the standard values prescribed by the Bureau of Indian Standards (BIS) and World Health Organization (WHO). The results indicate that the water of tube wells and hand pumps of nearby industrial areas has higher concentrations of all parameters. Ground water of present is not safe for drinking purpose. Therefore, we suggested that the proper disposal of slurry after treatment, recycling of wastewater along with periodical monitoring of surface water, discharge of effluent with proper treatment are very significant as a part of administration strategies for the Rairu area.
Keywords: Groundwater; Physico-chemical; Heavy metals; Rairu Industrial area
Introduction
Water is one of the most important resources which influenced human life. Generally, it is obtained from two types of natural sources i.e., 1-Surface water (lakes, ponds, rivers, streams etc.) 2-Ground water (bore holes and well water). Water play an important role in various filed like domestic, irrigation, industrial consumption, aquaculture, navigation, sports and tourism etc. all over the world. Water is used in many industrial processes which come in contact with harmful chemicals such as organic compounds, metals, dye, organic and inorganic pesticides, nutrients or radioactive material etc. Several industries discharge trade effluent directly on the surface, canal, river etc. Heavy metals are the one of the environmental pollutants and toxicity of theirs is major problem for ecological, evolutionary, nutritional and environmental balances [1-3]. Day by day, ground water quality is being decrease due to the mining, discharging industrial effluents containing metals without giving any treatment from industries like steel plants, battery, thermal power plants and over usage of fertilizers containing heavy metals in agriculture are the main reasons to contaminate the ground water [4,5]. Generally heavy metals such as Cadmium, Arsenic, Chromium, Lead, Copper, Zinc and Nickel, all of these are causing risks to human health and the environmental balance by entering the surroundings via natural means and through the human activities [6]. The As, Cd, Pb and Hg can be tolerated at very low levels, and are highly toxic to human beings as well as animals and is interact with numbers of minerals mainly Zn, Fe, Cu and Se due to chemical similarities and competition for binding stage. Present scenario, the pollution has become a serious threat, and has brought hazards impact to the growing population as well as the earth/environment. In the present paper deals with the study of open well and borehole water quality of some adjoin village in Rairu industrial area, Gwalior.
Study Area
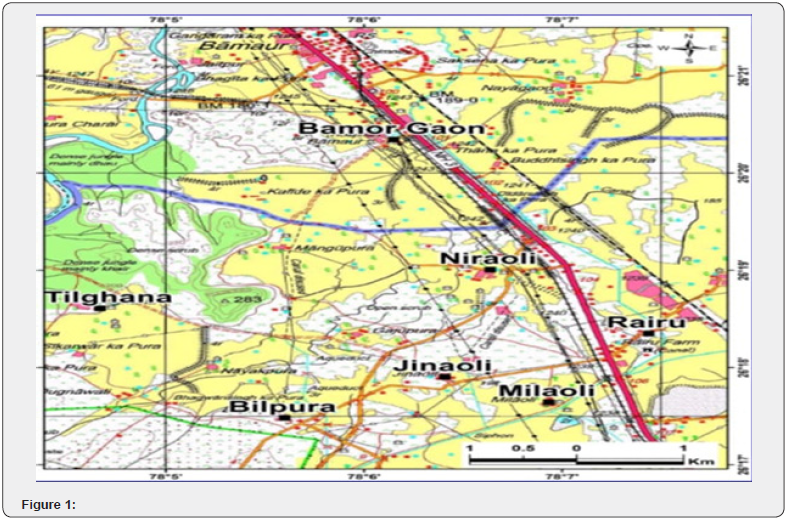
The Rairu Industrial area are situated between 78033’01.70” E longitude and 26022’79.90” north latitude of Gwalior district (M.P.) and about 20km from Gwalior city on Agra-Bombay highway NH3. The location is shown in Figure 1. Study area includes villages adjoining Rairu distillery near Banmore industrial area of district Gwalior.
Source of water sampling:
i. Zinavali
ii. Niravali
iii. Tilagana
iv. Beelpura
v. Milavalee
vi. Banmore village
Methodology
The ground water samples were collected from the 6 villages during Aril 2017 to March 2018 and stored in 1-liter clean plastic bottles. Before collection of samples, the bottles were properly washed with distilled water. Prior to collection of samples, the containers were rinsed by the water to be sampled. Some parameters were analyzed on site and others were analyzed in research center SMS. Govt. Model Science College, Gwalior (M.P.). Water samples have been analyzed as per standard methods [7]. Heavy metals like Cd, Pb were analyzed using atomic absorption spectrophotometer (AAS Model No Perkin Elemer-700).
Results and Discussion
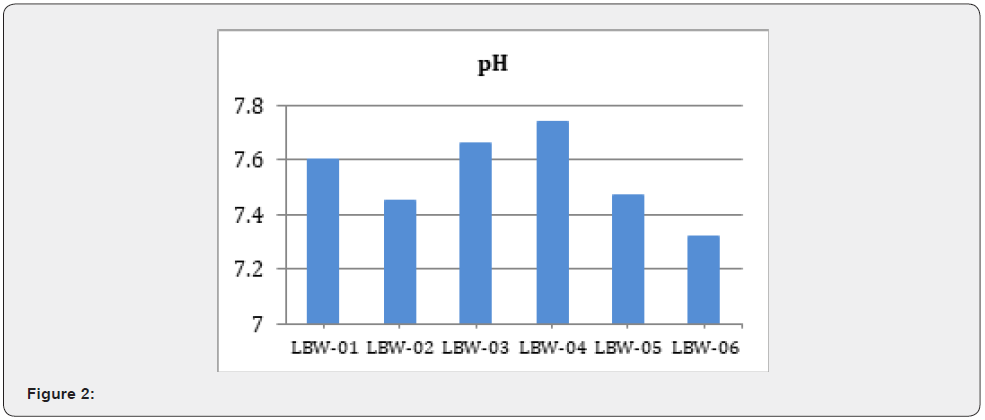
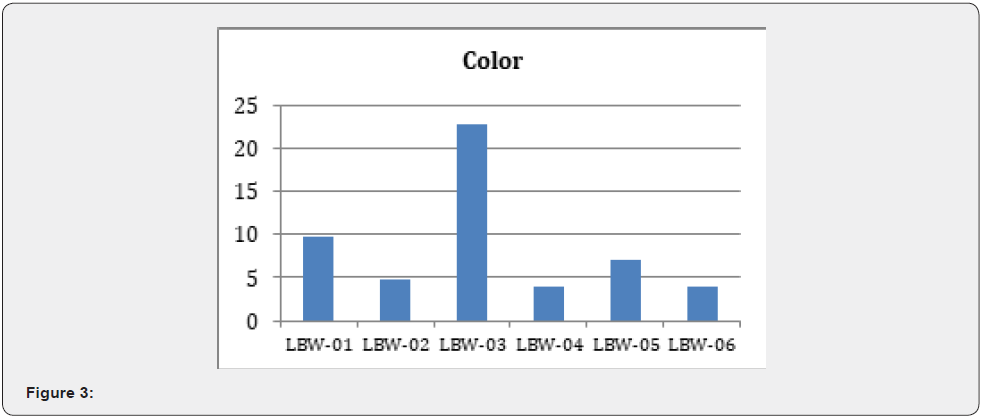
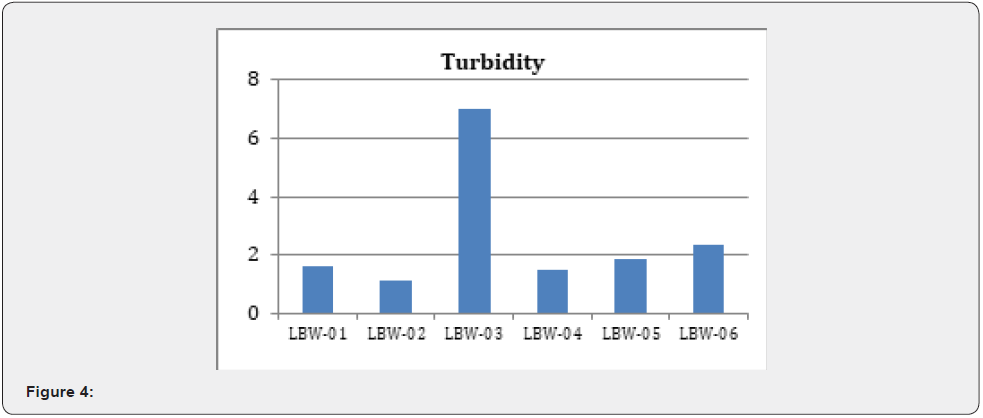
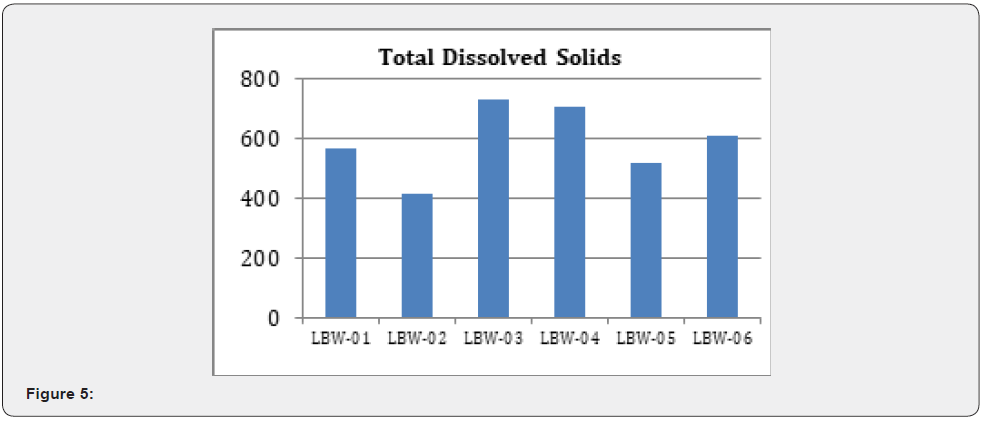
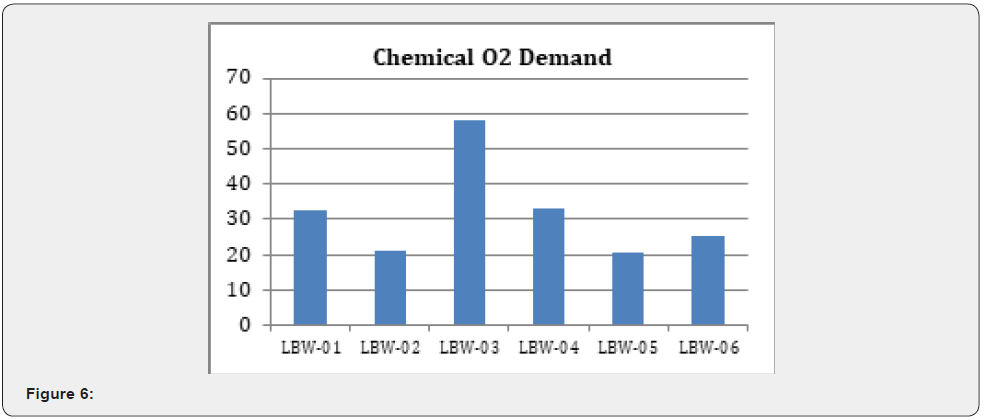
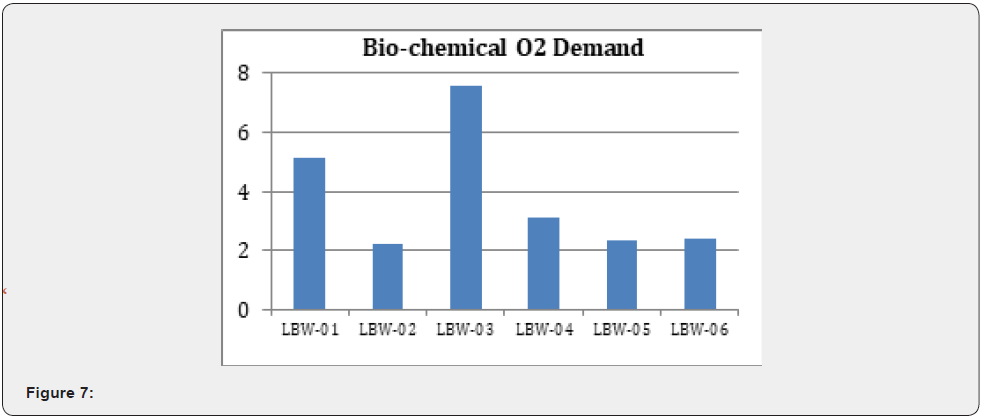
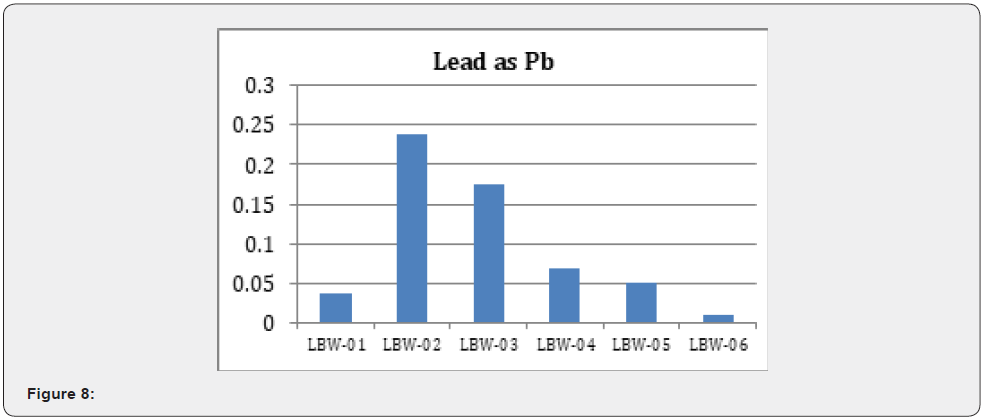
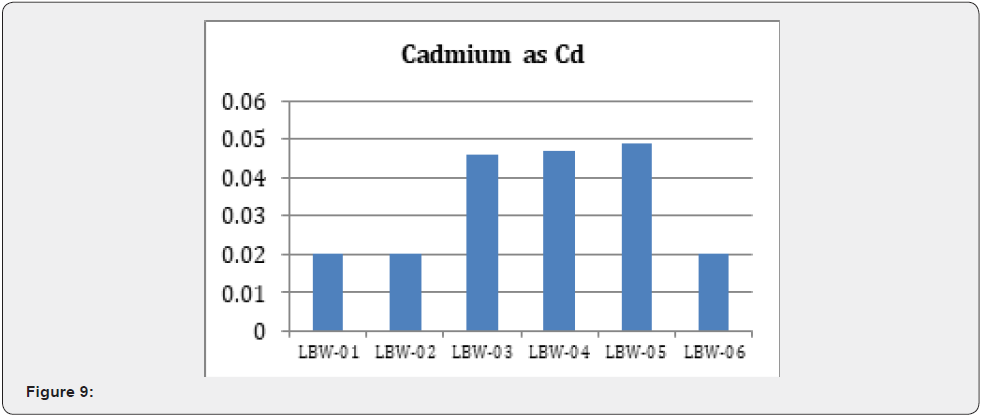
The water quality characteristics of surface water (pond) and borehole water at six villages have been analyzed including pH, colour, turbidity, total dissolved solids, biochemical oxygen demand, chemical oxygen demand, lead and cadmium. The average values of various physico-chemical characteristics borehole sample have been given in Table 1 & 2 and have been shown in Figure 2-9. The range of variations and mean values along with standard error of physico-chemical characteristics of water are given in Table 3. The pH of ground water depends on the composition of journey of recharge water infiltrating to the groundwater [8]. Seepage of influent and waste of industries downward through soil strata and joins the groundwater table. In present study, pH value was varied from 7.33 to7.78 with average of 7.60±0.139 at Beelpura, from 7.16 to 7.66 with an average of 7.45±0.15 at Milavali, from 7.21 to 7.93 with mean of 7.66±0.23 at Tilangana, from 7.68 to 7.82 with mean of 7.74±0.04 at Niravali, from 7.36 to 7.59 with mean of 7.47±0.07 at Zinawali, from 7.13 to 7.47 with an average of 7.32±0.10 at Banmore gaon. During the study, all ground water samples were found slightly alkaline. Manjare et al. [9] and Saravanakumar & Kumar [10] have been reported the same observation in various pond, ground water and open well water near the industrial area and found the range of pH between 5.5 to 8.5. Colour in drinking water is caused by the presences of coloured organic substances, usually humic, which originate from the decaying of vegetation in surface water. Iron and manganese also give water a red and blue colour respectively by the action of bacteria, which oxidize them to their ferric and manganic oxides respectively. Adekulne [11] was reported the colour from 211 to 2519 hazen in well water within Asa Dam industrial estate of Nigeria. In the present study, intensity of colour in ground water sample at Beelpura were varying from 8.2 to 12.3 with an average of 9.70±1.31, 4.3 to 5.6 with average of 4.87±0.38 at Milavali, 15.2 to 28.6 with average of 22.8±3.98 at Tilangana, 3.18 to 4.99 with average 4.02±0.53 at Niravali, 4.33 to 8.64 with mean of 7.03±1.36 at Zinawali and at Banmore gaon colour was varied from 2.6 to 5.8 with average 4.0±0.95. WHO [12] & BIS [13] are recommend the acceptable limit of colour in drinking water is 5 hazen and permissible limit as 15 hazen. In present study were compared with the standard 60% samples were found within the acceptable limit. Turbidity of water affects other water quality parameters such as colour, odour, and taste when it is imparted by colloidal particles. It also affects the chemical quality of drinking water through the formation of complexes between the turbidity causing humic matter and heavy metals [14]. Turbidity of ground water at Beelpura were fluctuated between 1.5 NTU and 1.8 NTU with mean value of 1.63±0.09, at Milavali were between 0.4 NTU and 1.8 NTU with average of 1.10±0.41, at Tilanaga from 1.5 NTU to 10.6 NTU with mean of 7.0±2.79, at Niravali turbidity were ranged from 1.2 NTU to 1.8 NTU with mean of 1.50±0.17, at Zinawali, the turbidity were found from 1.1 NTU to 2.23 NTU with mean 1.84±0.37 and at Banmore gaon, it were fluctuated between 1.1 NTU to 3.5 NTU win an average of 2.37±0.6. Total dissolved solid is a measure of the combined content of all inorganic and organic substances contained in a liquid in molecular, ionized or micro granular suspended form [10], TDS indicate fully dissolved minerals, such as calcium, chlorides, carbonates, bicarbonates, magnesium, silica, and sodium (15). TDS are a useful parameter for deciding safe and sound drinking water quality with a acceptable range of 500mg/l to and higher permissible limit of 2,000mg/l [13]. Drinking water containing high TDS may lead to some prospective gastrointestinal problems [16]. Concentration of total dissolved solids during course of study were ranged from 510mg/l to 672mg/l with mean of 567.3±52.41 at Beelpura, 386mg/l to 470mg/l with mean of 414.7±27.7 at Milavali, 630mg/l to 836mg/l with mean of 732.3±59.5 at Tilangana, 642mg/l to 790mg/l with mean of 706.7±43.7 at Niravali, 478mg/l to 586mg/l with mean of 520.0±33.4 at Zinavali and 568mg/l to 674 with mean of 607.3±33.5. Suspended solids were fluctuated from 12mg/l to 28mg/l with mean 20.6±4.67, 18mg/l to 28mg/l with mean 22.6±2.91, 48mg/l to 72mg/l with mean 59.3±6.96, 120mg/l to 138mg/l with mean 126.0±6.0, 16mg/l to 32mg/l with mean 22.67±4.81, 10mg/l to 22mg/l with mean 16.6±3.53 from Beelpura, Milavali, Tilangana, Niravali, Zinavali and Banmore gaon respectively. Similar findings have been observed by [17-19]. In the present finding were compared with drinking water standard, all the water samples were positioned between acceptable and permissible. Chemical oxygen demand is another measure of pollution contamination in water and is the amount of dissolved oxygen required to cause chemical oxidation of the organic material in water [20]. Therefore, Chemical oxygen demand of water increases with increasing organic matter concentration [21]. High level of chemical oxygen demand are usually due to chemically oxidisable organic matter of natural as well as in the water resources and which have indicated incidence of pollution [22]. COD in corresponding sampling periods, found from 28.2 to 36.9mg/l with mean 32.4±2.51, 16.5 to 28.1 an average 20.9±3.60, 36.2 to 72.7 an average 57.8±11.07, 22.5 to 48.5 an average 33.1±7.9, 16.3 to 28.3 an average 20.9±3.7, 20.1 to 21.1 an average 25.5±3.52 from Beelpura, Milavali, Tilangana, Niravali, Zinavali and Banmore gaon respectively. Biochemical oxygen demand is the amount of oxygen required by the living organisms engaged in the utilization and ultimate destruction or stabilization of organic water [23]. It also indicates the presence of microbial activities and dead organic matter on which microbes can feed. BOD is indicating of organic material contamination present in water. Biochemical Oxygen demand Beelpura were observed between 4.12mg/l and 5.78mg/l with mean 5.14±0.52, Milavali between 1.89mg/l and 2.83mg/l with mean 2.24±0.295, Tilangana between 3.45mg/l and 10.187 with mean of 7.58±2.08, Nirawali between 2.55mg/l to 4.05mg/l with mean of 3.10±0.48, Zinavali between 1.83mg/l and 3.11 with mean 2.32±0.40 and in Banmore gaon between 1.91mg/l and 3.16mg/l with mean 2.38±0.39. The main source of Lead in air has been the Petrol, however over the years with the use of unleaded Petrol this contamination has been checked upto an extent. The other sources are use from plumbing pipes where Lead is used as a sealant. The untreated effluents from metallurgical units are also a major source of such contamination. Little amounts of lead it causes many health nuisances, particularly in the case children below 16-year-old are most risk and high concentration of lead in the body cause death or permanent injury to the central CNS and brain that the results might also be the loss of memory. During the present investigation the trace metal lead at different location i.e. Beelpura, Milavali, Tilangana, Niravali, Zinavali and Banmor gaon had shown variation from 0.022 to 0.056mg/l an average 0.038±0.01, 0.103 to 0.503mg/l an average 0.239±0.13, 0.162 to 0.185mg/l an average 0.174±0.007, 0.049 to 0.084mg/l an average 0.070±0.011, 0.041 to 0.061mg/l an average 0.051±0.006 and 0.009 to 0.012mg/l an average 0.010±0.001 respectively. The concentration levels of all the studied heavy metals in groundwater were found to be higher than the maximum acceptable limits of WHO for drinking water [24-26]. In our present study were compared with the standard given by [12,13] all the samples were found exceeds of the limit. The Cadmium may occur in groundwater naturally or as a pollutant from sewage sludge, fertilizers, polluted groundwater or mining and industrial effluents [27]. It is also occur as a consequence in the refining of other metals. It enters into ground water by different sources one source is ingestion of foodstuffs, grain and leafy vegetables, which readily absorb Cadmium where it is accumulate and another is seepage. Cadmium is carcinogenic and it enters in body by both breathing in and parenteral ways of subjection [28]. The maximum permissible limit for Cadmium in Drinking water is 0.005mg/l (recommended by Bureau of Indian standard, IS:10500:2012). In the present study, Cadmium were found BDL from Beelpura, Milavali and Banmor gaon and it found 0.028mg/l to 0.68mg/l with mean 0.046±0.012 from Tilangana, 0.023mg/l to 0.66mg/l with mean 0.047±0.013 from Niravali, 0.034mg/l to 0.064mg/l with mean 0.049±0.009. In our study 50% samples are exceeding the WHO and BIS standards.


Where Beelpura (LBW-01), Milavali (LBW-02), Tilangana (LBW-03), Niravali (LBW-04), Zinavali (LBW-05), and Banmor gaon (LBW-06).

Where Beelpura (LBW-01), Milavali (LBW-02), Tilangana (LBW-03), Niravali (LBW-04), Zinavali (LBW-05), and Banmor gaon (LBW-06).
Conclusion
On the basis of above discussion, it may be concluded that the water quality of village adjoined with industrial area of Rairu district Gwalior M.P. is found in alkaline in nature. Lead and Cadmium are found beyond the acceptable limit. The TDS, Colour, Turbidity, COD and BOD in all ground water samples were found to be slightly high. Pollutant enters into water via drainage, atmosphere, soil erosion and all human activities by different ways. Industrial sewage is the main source of pollution of ground water and that grows along with sewage-contaminated water containing heavy metals leads to increase in concentration of metals, and it is mixed directly it the ground water through the seepage. The present study is required to draw a attention toward these villages for taking necessary steps to minimize the adverse impacts of polluted water.
Acknowledgment
The author thanks to Dr. Shakti Bhardwaj, Professor of Zoology SMS. Govt. Model Science College, Gwalior (M.P.) for her support and providing the necessary facility to do research work.
References
- Goyer RA (2001) Toxic effects of metals. In: Klaassen CD (Ed.), Cassarett and Doull’s Toxicology: The Basic Science of Poisons. McGraw-Hill Publisher, New York, USA, pp. 811-867.
- Wang YXJ, Hussain SM and Krestin, GP (2001) Superparamagnetic iron oxide contrast agents: physicochemical characteristics and applications in MR imaging. Eur Radiol11(11): 2319-2331.
- Vodela JK, Rendenja, Mchel Henney WH, Kemppainen BW (2001) Drinking water contaminants. Poult Sci 76(11): 1474-1492.
- Marcovecchio JE, Botté SE, Freije RH (2007) Dissolved heavy metal (Cd, Pb, Cr, Ni) concentrations in surface water and borewater from Bahía Blanca Estuary Tidal Flats. Bull Environ Contam Toxicol 79(4): 415-421.
- Ullah R, Malik RN, Qadir A (2009) Assessment of groundwater contamination in an industrial city Sialkot, Pakistan. African J Environ Sci Tech 3(12): 429-446.
- Beyersmann J, Martin Wolkewitz, Martin Schumacher (2008) The impact of time-dependent bias in proportional hazards modelling.Stat Med 27(30): 6439-6454.
- APHA (2022) Standard methods for examination of water and wastewater. (23th edn), American Public Health Association, Washington D.C.
- American Ground Water Trust (2003) Acid Rain and Ground Water pH, Number-3, Centre Street Concord, New Hampshire.
- Manjare SA, Vhanalaka SA, Muley DV (2010) Analysis of water quality using physic-chemical parameters Tamdalke tank in Kolhapur, district Maharashtra. Int J Adv Biotech Rese 1(2): 115-119.
- Sarvanakumar K, Kumar RR (2011) Analysis of water quality parameters of groundwater near Ambattur Industrial area, Tamil Nadu. Indian J Sci Techno 4(5): 1732-1736.
- Adekunle AS (2009) Effect of industrial effluent on quality of well water within Asha dam industrial estate Iiorin Nigeria. Natu Sci 7(2): 39-43709-713.
- WHO (2011). Guidelines for drinking water quality. (2nd edn), Recommendation. World Health organization Geneva, 1, pp. 30.7-113.7
- BIS (2012) Indian Standard Drinking Water -Specification IS 10500: 2012. New Delhi: Bureau of Indian Standards.
- WHO (1984) Guidelines for drinking-water quality: Volume 1 World Health organization Geneva, p. 148.
- Anbazhagan S, Nair AM (2004) Geographic information system and groundwater quality mapping in Panvel Basin, Maharashtra, India. Environ Geo 45: 753-761.
- Mukate S, Wagh V, Panaskar D, Jacobs JA, Sawant A (2019) Development of new integrated water quality index (IWQI) model to evaluate the drinking suitability of water. Ecological Indicators 101: 348-354.
- Ramya SS, Deshmukh VU, Khandekar VJ, Padmakar C, Surinaidu L, et al. (2012) Assessment of impact of ash ponds on groundwater quality: a case study from Koradi in Central India. Environ Earth Sci 69: 2437-2450.
- Gagan, M Chauhan, A, Kumar A, Kumar A (2016) Impact of industrial effluent on ground water and surface water quality A case study of Dhampur region (U.P.). India J Chem Pharma Sci 9(2): 709-713.
- Kumar R, Singh S, Kumar R, Sharma P (2022) Groundwater quality characterization for safe drinking water supply in Sheikhpura district of Bihar, India: A Geospatial Approach. Frontiers in Water 4: 1-13.
- APHA (2000) Standard Methods for the Analysis of Water and Wastewater. (15th edn), American Public Health Association and Water Pollution Control Federation, Washington DC, pp. 12-56.
- Boyd (1981) Water quality in warm water fish pond. Second Print. Cart. Opelika, Alabana.
- Jayaraman PR, Ganga DT, Vasudevan Nayar T (2003) Water quality studies on Karamana river, Thiruvananthapuram district, south Kerala. India Pollu Res 22(1): 89-100.
- Hawkes HA (1963) The ecology of waste water treatment. Pergamon Press, Oxford.
- Aggarwal A, Saxena M (2011) Assessment of pollution by physcochemical water parameters using regression analysis: A case study of Ganga River at Moradabad India. Adv Appl Sci Rese 2(2): 185-189.
- Ramachandra TV, Sudarshan P Bhat, Mahapatra DM, Krishnadas G (2012) Impact of indiscriminate disposal of untreated effluents from thermal power plant on water resources. Indian J Environ Prote 32(9): 705-718.
- Bhat P, Ramachandra TV, Sudarshan (2012) Impact of indiscriminate disposal of untreated effluents from thermal power plant on water resources. Indian J Environ Prote 32(9): 705-718.
- Houng KH, Lee DY (1998) Comparisons of linear and nonlinear Langmuir and Freundlich curve-f it in the study of Cu, Cd and Pb adsorption on Taiwan soils. J Soil Sci 163(2): 115-121.
- Oldiges H, Hochrainer P, Glase U (1989) Long term inhalation study with wistar rats and four cadmium compounds. Toxicol Environ Chem 19(3-4): 217-222.


