


Rainfall Trends Over Ethiopia
Mekuanint Tariku Guta*
National Meteorology Agency of Ethiopia, West Oromia Meteorological Service Center, Ethiopia
Submission: June 01, 2022; Published: July 07, 2022
*Corresponding author: Mekuanint Tariku Guta, National Meteorology Agency of Ethiopia, West Oromia Meteorological Service Center, P.O. Box: Jimma, Ethiopia
How to cite this article: Mekuanint T G. Rainfall Trends Over Ethiopia.Int J Environ Sci Nat Res. 2022; 30(4): 556297.DOI: 10.19080/IJESNR.2022.30.556297
Abstract
Rainfall has been extensively considered as one of the initial points toward the apprehension of climate change courses. Ethiopia is one of the East African Country which has highly affected by rainfall variability. This study was undertaken to analyze the trend of rainfall for Ethiopia with aspects of Spatial as well as Temporal from 1986-2018. The data implemented for this study was obtained from National Meteorological Agency of Ethiopia for 22-point station rainfall data from 1986 -2018. Mann-Kendall test and Sen’s slope estimator were used to assess the rainfall trends. Mann-Kendall test resulted significant increase for August and November by 0.918mm & 0.474mm/year respectively and significant decrease observed in month of February by 0.357mm/year. Stations shows a significant rainfall increasing at 0.05 significance level, in October, November, December & January (ONDJ) season at Gode, Qebridehar, Haragele, Moyale, Hageremariam & Yabelo from Bi-modal type-2 rainfall regime with amount of rainfall 2.3mm/year, 2.0mm/year, 2.5mm/year, 5.2mm/year, 5.0mm/year & 2.9mm/year respectively & in June, July, August & September (JJAS) season at Gashamo from bimodal type-2, Humara from monomodal rainfall regime, Atsbi, Gewane & Nazareth from Bi-modal type-1 regime with rainfall amount of 3.6mm/year, 3.6mm/year, 6.1mm/year, 6.4mm/year & 5.1mm/year respectively observed. The result of this study would hopefully help the planners and program managers to take necessary actions and to measure disaster management, agricultural production, drought mitigation, flood control etc.
Keywords: Rainfall trends; Mann-Kendall test; Enso-event; Ethiopia; Rainfall regime; NMA
Abbreviations: RENSO: El Niño–Southern Oscillation; DEM: Digital Elevation Model
Introduction
Rainfall is highly variable over East Africa at spatial as well as temporal scale [1]. Due to the complex topography and effects from regional and global sea surface temperature (SST), there is greater spatiotemporal rainfall variability over East and Horn of Africa [2-4]. The El Niño–Southern Oscillation (ENSO) is the main driver of the inter-annual variability in eastern African rainfall, with a significant impact on vegetation and Agriculture and dire consequences for food and social security; Due to this high variability and anomalies in rainfall, trend analysis has been of great interest to researchers in the region [5-10].
Degefu et al. 2018 [11] Country level studies have shown similar complex and weak trend results for all rainfall parameters. Some studies in Ethiopia have identified downward trends in some parts of the country - mainly in the eastern, southern and southeastern regions [12-14]. Similarly, Conway & Schipper [4] reported a tendency of downward trends for the belg rainfall, particularly over the eastern part of Ethiopia. However, other studies Bewket & Conway, NMA, Mengistu et al., Mekasha et al. [15-18] reported the absence of statistically significant upward or downward trends over central and northern parts of Ethiopia.
Rainfall variability has been found as a major cause of food insecurity and famine in the country [19]. Ethiopia was affected by drought/famine, for example, in 1913/14, 1920/22, 1932/34, 1953, 1957/58 and 1964/66, 1973/74 and recently, drought/famine occurred on 1983-1984, 1987-1988 and 1990-92, 1993/94 [20].
Agricultural sector is a pillar for the Economy of Ethiopian MOA; MOFED [21,22]. This sector, which is rain-fed by its nature, is highly sensitive to climate change and variability [17]. Moreover, agriculture in Ethiopia is practiced under the condition of diminished farm size, high soil degradation, inadequate and variable rainfall, imperfect agricultural markets and poor infrastructure, etc. [23]. As a result, agricultural production in Ethiopia reveals to be very poor and highly susceptible to minor climate change. Such climate conditions have caused major constraints to agricultural development. Rainfall being an important climatic element, the study of its variation and the consequent impact on agricultural production are paramount importance.
Studies in Ethiopia have shown that rainfall variability usually results in reduction of 20 percent production and 25 percent raise in poverty rates in Ethiopia [24,25]. Economic dependence of agricultural sector in Ethiopia on natural rainfall makes the production projected to be widen variation of yields and spatially and temporary. In line with this, the recorded famine in Ethiopia in 1973 and 1984 mainly due to severe drought [20] and hence caused crop damage and decline of food availability in the country [23].
Season is defined as, meteorologically, a period when an air mass characterized by homogeneous weather elements such as temperature, relative humidity, wind, rainfall etc., dominate a region or part of a country [26]. According to NMSA [26] Ethiopia has three Season, which is (June, July, August September (JJAS)) the most rainy season, the second rainy season February, March, April, May (FMAM) and the Dry Season October, November, December, January (ONDJ). In Ethiopia, the seasons and rainfall regimes are classified based on mean annual and mean monthly rainfall distribution. There is main three rainfall regimes in Ethiopia [27] Mono-Modal (Single maxima), Bi-modal type-1 (Quasi-double maxima) and Bi-modal type-2 (Double maxima). This analysis was undertaken by tacking sample station from those different rainfall regimes for spatial as well as temporal rainfall trend analysis based on professional judgment.
Materials and Methodsy
Identification of NBS genes
Location of the study area
Ethiopia is located 3º-14º N, 33º- 48º E in the Horn of Africa with Djibouti bordering in the East, Sudan in the West, Eritrea in the North and Kenya in South and Somalia in the South East. The Great East Africa Rift Valley, which runs from northeast to southeast across Ethiopia, the mountains and the highlands to the right and the left of this rift valley, the lowlands surrounding these mountainous and highlands in every direction can be described as the country’s main topographic features. The surface area in Ethiopia is currently at 1,104,300km² [28] (Figure 1-4 & Table 1).


Traditional agro ecology of Ethiopia
Under Ethiopian conditions, elevation has a strong influence on temperature and rainfall [29]. Therefore, this parameter (elevation) is the basis for traditional agroecological divisions. These different zones are:
a) Bereharefers to hot lowlands of less than 500 meters above sea level. In the arid east, crop production is very limited while in the humid west root crops and maize are largely grown.
b) Kollarefers to lowlands between 500 and 1,500 meters. Predominant crops are sorghum, finger millet, sesame, cowpeas, and groundnuts.
c) Woina Degarefers to midlands between 1,500 and 2,300 meters, in which predominant crops include wheat, teff, barley, maize, sorghum, chickpeas and haricot beans.
d) Dega refersto highlands between 2,300 and 3,200 meters. Predominant crops include barley, wheat, highland oilseeds, and highland pulses.
e) Wurchrefers to highlands between 3,200 and 3,700 meters. Barley is a common crop.
f) Kurrefers to highland areas above 3,700 meters, which are primarily used for grazing pasture (Figure 5).


Data sources and data quality control
Source of data
Very good quality of gauge or station as well as gridded daily rainfall data was obtained from the National Meteorological Agency of Ethiopia (NMA) from 1986 to 2018 for the selected 22 meteorological stations and DEM data from USGS.
Data quality control assessment
Detected outliers were removed using the Turkey fence approach [30]. The data series was also examined for homogeneity and no heterogeneity was detected. Missing data in the time series was filled with data from neighboring stations using statistical regression techniques as described in [31] and applied in various studies [32,33]. Additionally, the missing data were filled with gridded data. The gridded data are constructed data series based on records of gauge stations and satellite observations. This data is very useful because weather stations are limited in number and unevenly distributed and have sometimes a short period of observations.
Methodology
The magnitude of the trend in the seasonal and annual series was determined using Sen’s estimator [34] and statistical significance of the trend was analyzed using Mann-Kandall (MK) test [35,36]. The Sen’s slope method is nonparametric approach which gives a robust estimation of trend [37]. It calculates the slope as a change in measurement in respect to change in time. The slope (S) is calculated by equation 1.
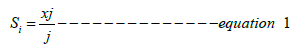
For =1,2,3……., N
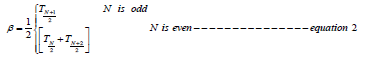
The S value is obtained by summing the counts of all the data series, Xi and Xj are the values of the series and i, j the years, being i =j +1 where and are data values at times j and k (j > k), respectively. The median of these N values of is Sen’s estimator of slope which is calculated as given in equation 2.

Note: * in table 2 shows significant trend at 0.05 significant level.

Note: *in table 4 shows significant trend 0.05 significant level.
A positive indicates an upward (increasing) trend and a negative (decreasing) trend in the time series.
The MK was used to check the null hypothesis of no trend versus the alternative hypothesis of the existence of increasing or decreasing trend. The statistic (S) is calculated using equation 3.
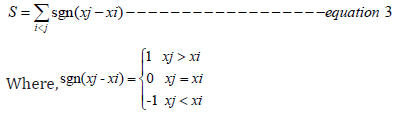
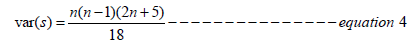
This statistic represents a number of positive differences minus the number of negative differences for all the data considered. For a large sample (N>10), the test is conducted using a normal distribution with the mean and variance as expressed in equation 4
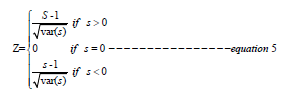
The standard normal (Z-statistics) is then computed as shown in equation 5
If the computed value of  the null hypothesis (Ho) is
rejected (here α = 0.05) level of significance in two-sided test,
but if of
the null hypothesis (Ho) is
rejected (here α = 0.05) level of significance in two-sided test,
but if of  then the null hypothesis for no trend is accepted.
Failing to reject Ho (null hypothesis) does not mean that there is
no trend. Rather, it is a statement that the evidence available is not
sufficient to conclude if there is a trend [38].
then the null hypothesis for no trend is accepted.
Failing to reject Ho (null hypothesis) does not mean that there is
no trend. Rather, it is a statement that the evidence available is not
sufficient to conclude if there is a trend [38].
Result and Discussion
Temporal rainfall trend analysis
(Table 2) Temporal rainfall trend analysis of Ethiopia by using mean of mean monthly rainfall of 22-point stations from 1986-2018, Mann-Kandall (MK) statistics, Sen’s slope and Z-value(highlighted in red show statistically significant at 0.05 significant level).
Mann-Kandall (MK) statistics (s- statistics) shows months of January, February, March, April and December and season of FMAM has decreasing trend but the others months and Seasons observed increasing trend some of month’s February, August and November shows Significant trend at 0.05 Significant level. the Sen`s Slop shows the magnitude of rainfall (Table 3).
Spatio-temporal rainfall trend analysis of 22-point stations of Ethiopia for three season October, November, December, January (ONDJ), February, March, April, May (FMAM) and Jun, July, August, September (JJAS) by using Annually seasonal total rainfall from 1986-2018, Mann-Kandall (MK) statistics, Sen’s slope and Z-value (highlighted in red show statistically significant at 5% level).
For JJAS rainfall most of stations except Moyale, Pawe and Masha shows increasing trend and some of stations Gashamo, Humera, Atsbi, Gewane and Nazareth tends to increasingly significantly in JJAS rainfall. Similarly, for FMAM rainfall nearly half of stations shows increasing and the other half of stations shows decreasing from the sampled of 22 but there were not observed significantly increase or decrease rainfall. Whereas, for ONDJ rainfall most of stations except Gashamo, Humera, Metema, Nedjo, Gambela and Elida shows increasing rainfall trend but the explained stations above observed decreasing rainfall trend. Some stations like Gode, Qebridehar, Haragele, Moyale, Hagere-Mariam and Yabelo tends to increasing significantly in ONDJ season rainfall.
When we see those stations based on rainfall regime: those are classified in to three rainfall regimes. the first category in the upper table. Stations sampled from Bi-modal type-2(two rainy period or double maxima rainfall) regions. It covers mostly south and south and south east Ethiopia and this area shows increasing significantly in ONDJ season rainfall except Gashamo stations. In JJAS season except from Moyale station sampled stations shows a positive rainfall trend but the FMAM season except Gashamo displayed a negative rainfall trend in this regime but not increasing or decreasing significantly for JJAS and FMAM season rainfall.
Stations displayed in the middle of table. Sampled from monomodal (single maxima) which covers the western and north western part of Ethiopia. In this category there is no significant increasing or decreasing except Humera station showed increasing significantly in JJAS but for most of stations from this region shows a positive rainfall trend for JJAS and FMAM.
The other categories in the bottom part of table. Are sampled stations from Bi-modal type-1 (long and short rainfall season pattern). which covers mostly in central and north eastern part of Ethiopia. the whole sampled stations in this category displayed increasing(positive) rainfall trend in JJAS rainfall and some of them stations Atsbi, Gewane and Nazareth display increasing significantly in JJAS rainfall. In this Regime of ONDJ season except Elidar station shows a positive rainfall trend.
This research was a line with undertaken by Yilma and Ulrichzank, in title of “Recent changes in rainfall and rainy days in Ethiopia” and they were finding significant decline since 1982 in southern and south western and eastern sampled stations [39]. From Mann-kandall trend test for annual and June-September total rainfall for Central, Northern and Northwestern Ethiopia in the period 1965-2002 [39]. That research was used similar methods with this research to detect the rainfall trend. But the finding has the variation with this research sample stations from the central part of the country shows significant increase observed in JJAS season and also stations from the south east part of the country observed significant increase in ONDJ. This result also has contradicted with the result of yilma and Zanke research result. The time spell to conduct the research and the variation of sample station may cause for observed different result.
Rising trend are found for total rainfall amount over a wide region encompassing South Somalia and Eastern Ethiopia [40]. The finding of this research has good relations with this research both are shows rising rainfall in South Eastern Ethiopia. Eastern Ethiopia both researches have good time relation and also implemented Mannkandall test. As the Seasonal scale OND is the season with the most evident results in terms of the extension of the trend Significance regions [40]. Cattani`s result was observed in Spatio temporal rainfall trend result of this research; both are shown ONDJ(Bega-season) the rising rainfall mainly in the south eastern part of Ethiopia.
Degefu [11] country level studies have shown similar complex and weak trend results for all rainfall parameters. Some studies in Ethiopia have identified downward trends in some parts of the country - mainly in the eastern, southern and southeastern regions [12-14]. Similarly, Conway & Schipper [4] reported a tendency of downward trends for the belg rainfall, particularly over the eastern part of Ethiopia. However, other studies by Bewket and Conway; NMA; Mengistu et al.; Mekasha et al. [15-18] reported the absence of statistically significant upward or downward trends over central and northern parts of Ethiopia
Conclusion
In this study, analysis of the temporal and spatial characteristics of rainfall trend using rainfall data obtained from the National Meteorological Agency of Ethiopia for (1986- 2018) is presented. The data used is a combination of gauge and gridded rainfall data which is believed to be more reliable than using lonely satellite rainfall data. Rainfall is the major climatic parameter that needs to be analyzed for its statistical characteristics in order to conduct successful rain-fed agriculture over Ethiopia.
Trends of rainfall at seasonal time scales for the study period were analyzed using the Mann-Kendall test and Sen’s slope estimator for 22-samped point station rainfall data from 1986-2018 from different regime of the country. Mann-Kendall test display significant increase for August and November by 0.918mm & 0.474mm per year respectively and significant decrease observed in month of February by 0.357mm per year and this was analyses by using monthly total spatial mean for the past thirty year. the spatial and temporal variation of rainfall trend analysis was observed a significance positive trend in ONDJ season for most of sampled station from bimodal type-2 regime and in bimodal type-1 in JJAS season some of sampled station observed increasing significantly at 5 percent significant level.
This study has offered useful information for a better understanding of the temporal trends and spatial distribution of rainfall in the study area, which is of great importance for water and forest resources management particularly in securing sustainable agricultural production. Moreover, this study can be used as an input for a more comprehensive study that may include the impact of the temporal rainfall trends and the spatial rainfall variability on water, agriculture, and forests as well as on the driving forces that caused the variability and trends.
a) Climate researchers should have to give high emphasis to the area of northern and south eastern part of the country Ethiopia.
b) Climate information should be the base of the planers especially for water sector and agricultural sector.
The country should have to encourage flood monitoring system.
References
- Indeje M, Semazzi FHM, Xie L, Ogallo LJ (2001) Mechanistic model simulations of the East African Climate using NCAR Regional Climate Model: Influence of large-scale orography on the Turkana Low-Level Jet. J Clim 14(12): 2710 -2724.
- Schreck CJ, Semazzi FHM (2004) Variability of the recent climate of Eastern Africa. International Journal of Climatology 24(6): 681-701.
- Bowden JH, Semazzi FHM (2007) Empirical analysis of intra seasonal climate variability over the greater Horn of Africa. Journal of Climate 20(23): 5715-5731.
- Conway D, Schipper ELF (2011) Adaptation to climate change in Africa: Challenges and opportunities identified from Ethiopia. Global Environmental Change 21(1): 227-237.
- Amin A, Nasim W, Mubeen M, Sarwar S, Urich P, et al. (2018) Regional climate assessment of precipitation and temperature in Southern Punjab (Pakistan) using SimCLIM climate model for different temporal scales. Theor Appl Climatol 131(1): 121-131.
- Darand M, Dostkamyan M, Rehmani MIA (2017) Spatial autocorrelation analysis of extreme precipitation in Iran. Russian Meteorol Hydrol 42(6): 415-424.
- IPCC (2014) Climate Change 2014: Synthesis Report. Contribution of Working Groups I, II and III to the Fifth Assessment Report of the Intergovernmental Panel on Climate Change. IPCC, Geneva, Switzerland, p. 151.
- Li X, Wang X, Babovic V (2018) Analysis of variability and trends of precipitation extremes in Singapore during 1980–2013. Int J Climatol 38(1): 125-141.
- Sun Q, Miao C, Duan Q, Ashouri H, Sorooshian S, et al. (2018) A Review of Global Precipitation Data Sets: Data Sources, Estimation, and Intercomparisons. Rev Geophys 56(1): 79-107.
- Yang W, Seager R, Cane MA, Lyon B (2014) The East African long rains in observations and models. J Climate 27(19): 7185-7202.
- Degefu MA, Assen M, McGashey D (2018) Climate variability and impact in ASSAR’S East African region. CARIAA-ASSAR working paper. International development research center, Ottawa, Canada and UK Aid, London, United Kingdom.
- Seleshi Y, Camberlin P (2006) Recent changes in dry spell and extreme rainfall events in Ethiopia. Theoretical and Applied Climatology 83: 181-192.
- Cheung WH, Senay G, Singh A (2008) Trends and spatial distribution of annual and seasonal rainfall in Ethiopia. International Journal of Climatology 28(13): 1723-1734.
- Jury MR, Funk C (2012) Climatic trends over Ethiopia: Regional signals and drivers. International Journal of Climatology 33(8): 1924-1935.
- Bewket W, Conway D (2007) A note on the temporal and spatial variability of rainfall in the drought-prone Amhara Region of Ethiopia. International Journal of Climatology 27(11): 1467-1477.
- NMA (2007) Climate change national adaptation program of action (NAPA) of Ethiopia. Ministry of Water Resources, Addis Ababa.
- Mengistu D, Bewket W, Rattan L (2014) Recent spatio-temporal temperature and rainfall variability and trends over the upper Blue Nile River Basin, Ethiopia. International Journal of Climatology 34(7): 2278-2292.
- Mekasha A, Tesfaye K, Duncan AJ (2014) Trends in daily observed temperature and precipitation extremes over three Ethiopian eco-environments. International Journal of Climatology 34(6): 1990-1999.
- Beweket W (2009 Rainfall variability and crop production in Ethiopia Case study in the Amhara region. Department of Geography & Environmental Studies, Addis Ababa University, Ethiopia.
- Wolde-Georgis T (1997) The Use of El Nino Information as Drought Early Warning in Ethiopia. IJAS 1(2).
- Ministry of Agriculture [MoA] (2010) Ethiopia’s agriculture sector policy and investment framework: Ten Years Road Map (2010-2020).
- Ministry of Finance and Economic Development [MoFED] (2010) The Federal Democratic Republic of Ethiopia: Growth and Transformation Plan (GTP) 2010/11-2014/15.
- Degefe B, Nega B (1999) Annual report on the Ethiopian economy. The Ethiopian Economic Association. Vol. 1.
- Hagos F, Makombe G, Namara RE, Awulachew SB (2009) Importance of irrigated agriculture to the Ethiopian economy: Capturing the direct net benefits of irrigation. Colombo, Sri Lanka: Int. Water Manage. Inst. p.37. (IWMI Research Report 128).
- Osman M, Sauerborn P (2002) A preliminary assessment of characteristics and long-term variability of rainfall in Ethiopia basis for sustainable land use and resources management. Conference on International Agricultural Research for Development, Deutscher Tropentag Witzenhausen, Germany.
- National Meteorological Service Agency [NMSA] (1996) Climate & agro-climate resources of Ethiopia. NMSA Meteorological Research Report Series 1(1), Addis Ababa, Ethiopia.
- Bekele F (1997) Ethiopian use of ENSO information in its seasonal forecast. Internet Journal for African Studies (IJAS) 1(2).
- CSA [Central Statistical Agency] (2007) Census data of the central statistical agency of Ethiopia.
- EIAR (2011) Coordination of national agricultural research system, Ethiopia. English and Amharic Version. EIAR, Addis Ababa
- Tukey J (1977) Exploratory data analysis. Reading. MA: Addison Wesley.
- Allen R (1998) Crop evapotranspiration: Guidelines for computing crop water requirements, Irrigation and Drainage Paper No. 56. FAO, Rome, Italy.
- Vergni L, Todisco F (2011) Spatio-temporal variability of precipitation, temperature and agricultural drought indices in central Italy. Agricultural and Forest Meteorology 151(3): 301-313.
- Seleshi Y, Zanke U (2004) Recent changes in rainfall and rainy days in Ethiopia. Int J Climatol 24(8): 973-983.
- Sen PK (1968) Estimates of the regression coefficient based on kendall’s tau. J Amer Stat Assoc 63(324): 1379-1389.
- Mann HB (1945) Non-parametric test against trend. Econometrica 13(3): 245-259.
- Kendall MG (1975) Rank correlation methods, Charles Griffin, London. UK,
- Yue S, Pilon P, Cavadias G (2002) Power of the Mann-Kendall and Spearman’s Rho tests for detecting monotonic trends in hydrologic series. Journal of Hydrology 259(1-4): 254-271.
- Helsel DR, Hirsch RM (2002) Statistical methods. Water resources techniques of water resources investigations, No. 4. U.S. Geological Survey. 522
- Sileshi Y, Zanke U (2004) Recent changes and rainfall and rainy days in Ethiopia. Int J Climatol 24(8): 973-983.
- Cattani E, Merino A, Levisani V (2019) Rainfall variability and trends over east Africa: 12th international precipitation conference Irvine, California (USA).


