Aerobiological Biodiversity in the Metropolitan City of Rome
Brighetti MA1, De Franco D1, Di Cosmo C2, Di Menno di Bucchianico A3,4, Froio F5, Miraglia A4, Moselli D2 and Travaglini A1*
1 Department of Biology, University of Rome Tor Vergata, Italy
2 Regional Natural Park Monti Simbruini, Italy
3 ISPRA, Italian Institute for Environmental Protection Research, Italy
4 PhD Program in Evolutionary Biology and Ecology, Department of Biology, University of Rome Tor Vergata, Italy
5 Allergology Centre, San Pietro-Fatebenefratelli Hospital, Italy
Submission: March 25, 2022; Published: April 14, 2022
*Corresponding author: Travaglini Alessandro, Department of Biology, University of Rome Tor Vergata, Rome, Italy
How to cite this article: Brighetti MA, De Franco D, Di Cosmo C, Di Menno di Bucchianico A, Froio F. Aerobiological Biodiversity in the Metropolitan City of 02 Rome. Int J Environ Sci Nat Res. 2022; 30(2): 556283. DOI: 10.19080/IJESNR.2022.30.556283
Abstract
Pollen monitoring is a useful tool for characterizing the flora present in a territory. Exposure to pollen is closely related with the season of flowering and the period of phenology of plants. The period of pollination and the pollen dispersion in air is conditioned also by meteorological variables, latitude, height above sea level and climatic conditions of each zone. In fact, the pollen presence changes both over years and months, and over days and hours of the day. This is a preliminary study that shows the use of pollen as bioindicators of the floristic-vegetational diversity and ex-post characterization of a site.
Keywords: Pollen; Biodiversity; Correlation coefficient; Cluster analysis
Introduction
The metropolitan city of Rome is a vast territory of 5.363km2, which extends from the Tyrrhenian Sea to the west to the border with the province of L'Aquila in the neighbouring Abruzzo region to the east and includes 121 municipalities including the city of Rome, with 4,356 million people.
From a geographical point of view, the area develops in an altitude difference from 0m asl along the Tyrrhenian coast, to 1855m asl of Monte Autore (Simbruini Mountains), characterized by three main mountain systems: Alban Hills and Lepini Mountains that delimit the border to the South-East, the anti-Apennine group to the North-West, bordering the province of Viterbo, and the Lazio sub-Apennines to the east with the Lucretili Mountains, the Tiburtini Mountains, the Prenestini Mountains, the Ruffi Mountains, the Affilani Mountains and the Simbruini Mountains whose territory also includes part of the municipality of Subiaco.
Climate varies greatly depending on the morphological characteristics of the territory: Mediterranean climate in the coastal belt to the west, and mild continental climate in inland areas to the east. Temperatures decrease from West to the East, while rainfall values increase, passing from about 700mm/year in the coastal area, to about 1500mm/year in the Simbruini mountains area [1].
About 25% of the soil is used by artificial surfaces, and the remaining 75% is characterized by pastures, crops, woods, olive groves, vineyards, permanent lawns [2].
The study of natural environments and the characterization of vegetation can be carried out through aerobiological monitoring which can prove to be a useful tool in the field of climatology, in the study of climate change [3], for the control of flora. of a territory [4], as well as for the prevention of allergic symptoms [5].
This study, through the presence of airborne pollen, is intended to provide preliminary assessment of the aerobiological diversity between the urban area of the municipality of Rome in the strict sense and the metropolitan peripheral area, in relation to the large extent of the territory concerned.
The presence of airborne pollen is strongly influenced by the characteristic vegetation of the sampling site and is strictly related to the flowering season and the phenological period of the plants. The pollination period is then influenced by latitude, height above sea level, weather, and climatic conditions. The interannual variation of these parameters can shift the start date of the pollen season, from one year to the next, even for several weeks. It is known that temperature represents one of the environmental variables mainly affecting pollen emission in the atmosphere [6-9], while the fluctuations that occur from year to year can be attributed to a series of parameters, including the weather conditions before and during pollination.
Materials and Methods
For the sampling, Hirst volumetric traps, model Lanzoni VPPS 2000 were used as per standardized methodology [10]. Data on daily pollen concentrations belonging to 8 pollen taxa were considered: Alnus spp., Corylus avellana L., Cupressaceae, Fraxinus spp., Platananceae, Populus spp., Salix spp. and Ulmus spp. The pollen concentrations were detected by the activity of 4 volumetric samplers belonging to the Rome Monitoring Center of the Tor Vergata University, situated in 4 different sites in the territory of the Rome Metropolitan City: three in the territory of the municipality of Rome - in Rome South, on the roof of the Biology Department of the University of Rome Tor Vergata, in North Rome on the roof of a building of the Villa San Pietro-Fatebenefratelli Hospital, and in Rome Center near the subway of Cipro-Musei Vaticani - and one in the municipality of Subiaco, in the territory of the Simbruini Mountains Regional Natural Park. In the city of Rome, pollen sampling has been active since 1996, while the sampler installed in the Simbruini Mountains park has been in operation since December 2019, the result of a research agreement between the university and the park authority.
For each taxon, within each of the 4 sites, in addition to the pollen data (daily concentrations p/m3), the phenological (start, end and length of the pollen season) and production (API, Annual Pollen Integral, and peak [11] indicators, calculated as both the maximum daily concentration and the day of the year in which it occurs) according to Jäger et al. [12].
The data were subjected to Pearson's correlation testing and cluster analysis, using the SPSS program [13].
Results
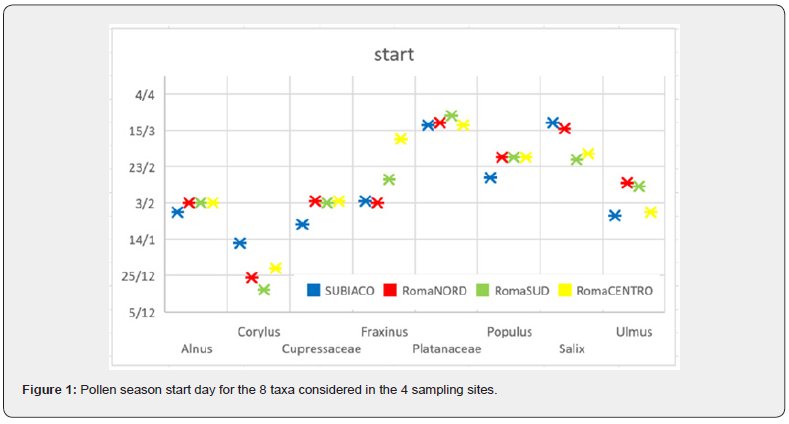
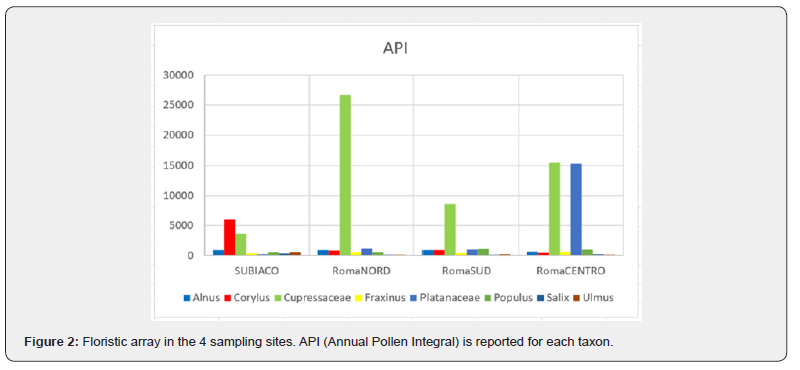
The results shown in the following graphs indicate differences in the start day of the pollen season of the 8 taxa considered in the 4 sampling sites (Figure 1), and the floristic array of each of the 4 sampling sites from which the diversity of the vegetation emerges (Figure 2).
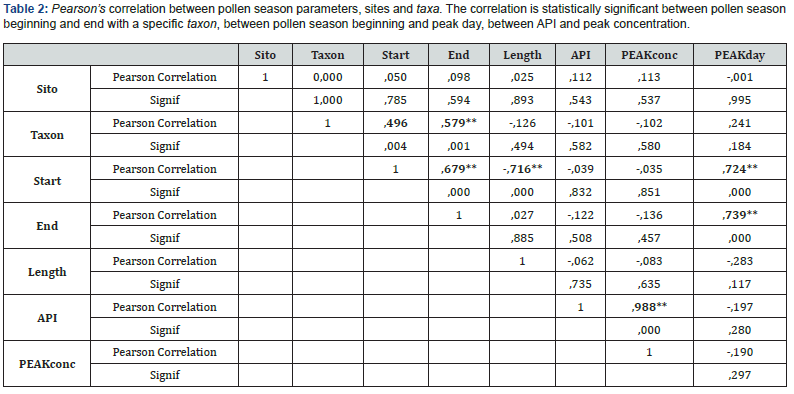
The Pearson correlation (* = Correlation at 0.05 level 2 tailed and ** = Correlation at 0.01 level 2 tailed) between the daily pollen concentrations of the taxa considered in the 4 sampling sites is significant (Table 1). In confirmation of the previous one, the beginning and end of the pollen season are correlated with a specific taxon, thus indicating the seasonal trend of each taxon; they also correlate very well the beginning of the pollen season with the day of the peak, as well as the API correlates with the concentration of the peak day (Table 2).

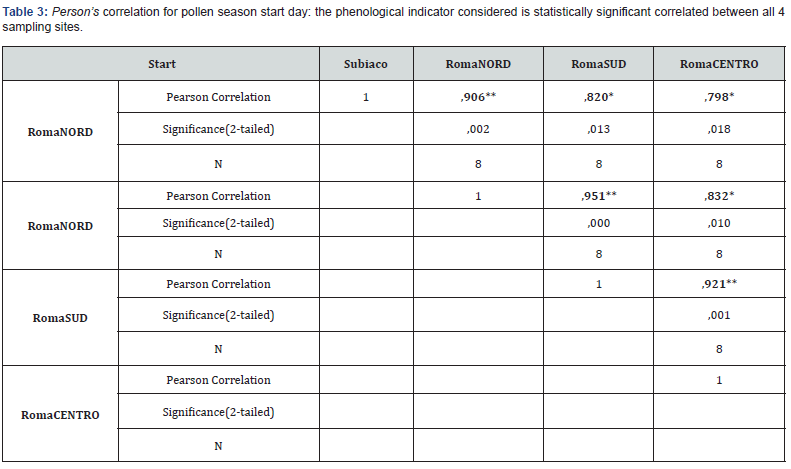
The correlation between the beginning of the pollen season of the 8 taxa considered in the 4 different sampling sites is also significant (Table 3), while there is no correlation between the length of the pollen seasons, not even among the 3 samplers in Rome (not shown).
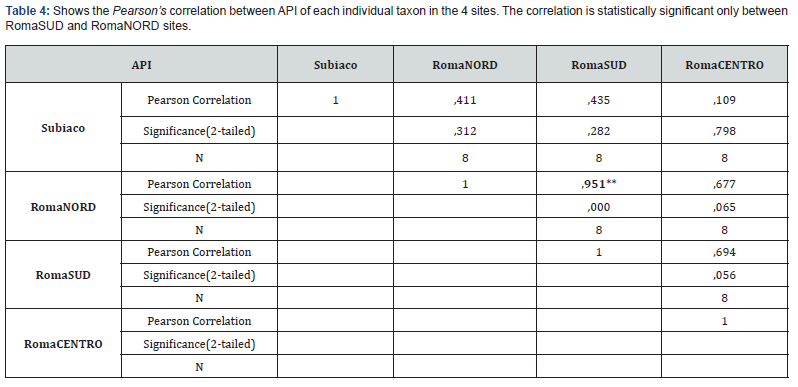
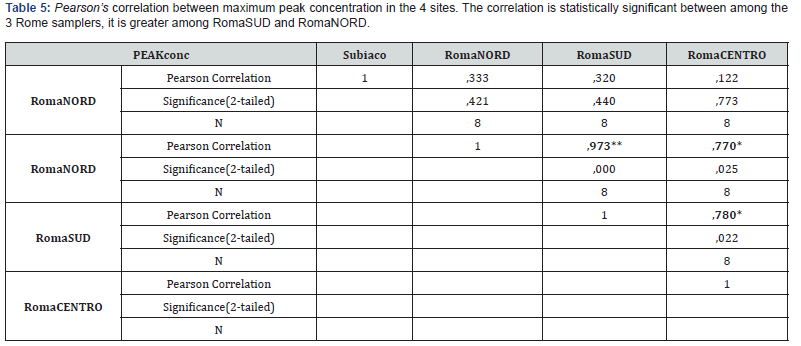
The API correlates only between the samplers of the outskirts of the city of ROME, in the RomaSUD and the RomaNORD (Table 4), as well as for the maximum peak concentration, although it is significant among the 3 Rome samplers, it is greater among RomaSUD and RomaNORD (Table 5).
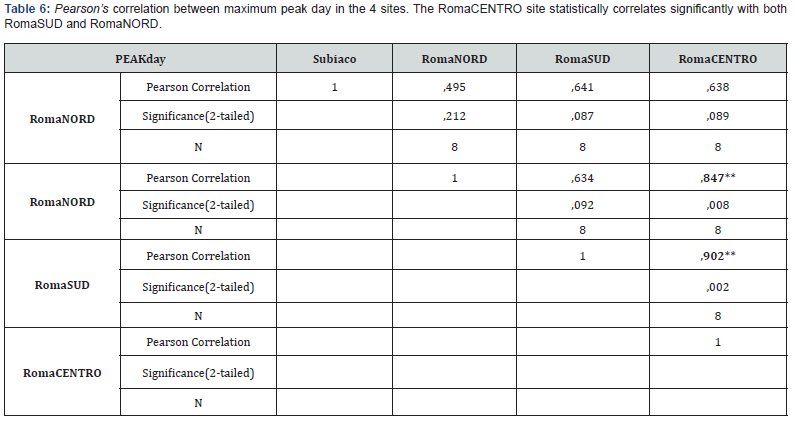
On the other hand, the day of maximum peak the sampler from RomaCENTRO correlates both with RomaSUD and with RomaNORD, but RomaNORD and RomaSUD do not correlate with each other (Table 6).
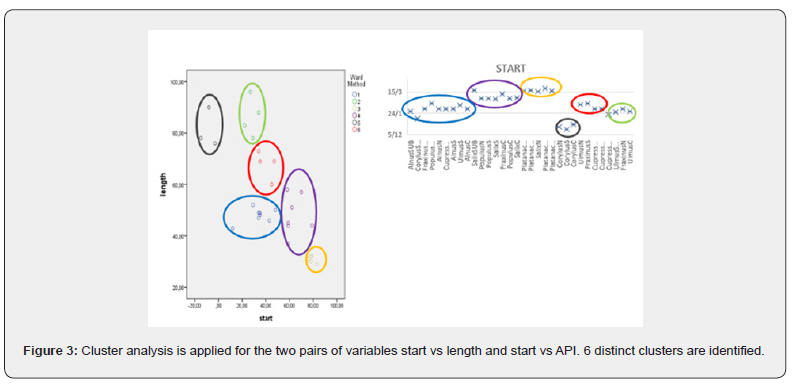
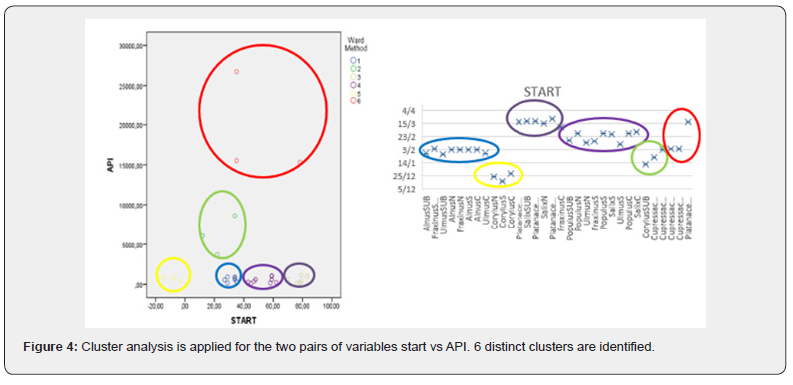
Cluster analysis was then applied, an exploratory technique to check whether within the samplings in the 4 different sites there were pollen taxa that had a similar behaviour with respect to the variables considered.
Cluster analysis was used for the two pairs of variables start vs length and start vs API, applying a hierarchical method for the 32 cases (8 taxa for 4 sites), with the Euclidean distance index and the Ward’s method as an algorithm, a very efficient method that considers the minimum sum of squares of the distances between points.
In both cases, 6 distinct clusters are identified. Interesting the case of Platanaceae (cluster 3 -yellow) (Figure 3), characterized by a well-defined and rather circumscribed pollen season, and of Corylus sp. in Rome city (cluster 3 -yellow) (Figure 4).
Discussion
The aerobiological monitoring gives us a photograph inherent to the vegetational variety and the different bioclimatic location.
The Pearson correlation value we can affirm that the trend of the pollen season of the pollen taxa is quite homogeneous in the 4 sites and reflects the phenology of the species (Table 1 & 2).
It is as if RomaCENTRO had middle conditions between the other two sites in Rome. The climate of urban centres is still subject to modifications which include the increase in the average temperature, the decrease of relative humidity and air circulation; this determines an overall warmer and drier phenomenon, a known as "urban island Heat" [14]; This urban island Heat forms frequently, causing thermal differences between the territories of cities and suburban or open spaces. Within the city the intensity of these variations increases from the periphery towards the centre and is related to the density of the buildings and the percentage of land covered by vegetation [15].
The environmental conditions, such as the distance of the Monitoring Station from the source of pollen or the abundance of taxa in the vegetation local/regional [16,17] strongly modify the parameters of the main pollen season.
Furthermore, the flora of the city of Rome has a high anthropic component: in the first half of the 1900s many trees were planted in the new restructuring of the city, for example, plane trees, along roadsides, pines soon to become a symbol of city, oaks, cypresses, oleanders and laurels. These species however cannot be used as bioindicators for Rome itself since they are not originally native to the city. The present-day vegetation is very complex and varied and includes plant communities belonging to different vegetation series. Pastures, abandoned fields and uncultivated land are still the most common type of greenery around Rome.
The territory of Subiaco, on the other hand, is characterized by abundant rainfall which justifies the presence of a rich flora and vegetation heritage; the climate is affected by the particular geographic location of the mountain massif, which constitutes a transversal barrier to the western winds coming from the Tyrrhenian Sea, often associated with perturbations of Atlantic origin; it is precisely the action of the winds that is responsible for the quality and quantity of atmospheric precipitation [18]. Temperatures are on average 5-6°C lower than in the city of Rome.
The spectral composition of the pollen in the atmosphere can of course also be conditioned by biological material coming from remote areas [19].
Conclusion
Aerobiological monitoring is a useful tool for the description of plant biodiversity in natural and anthropized environments. In this study the measurement of pollen concentrations in the air of 8 pollen taxa, sampled in 4 different sites, three in the territory of the municipality of Rome and one in the municipality of Subiaco (in the Simbruini Mountains Regional Natural Park) was used to characterize the vegetation of these the different locations through the differences in the pollen season and in the Annual Pollen Integral of the considered taxa. From the analysis of Pearson's correlation between the variables relating to pollen indicators, the climatic-vegetational difference between the two environments can be deduced, that of the city of Rome which is more covered by artificial surfaces (represented by the 3 samplers RomaSUD, RomaNORD and RomaCENTRO) and that of Subiaco. The cluster analysis, on the other hand, shows similarity between the RomaNORD and Subiaco sites, characterized by the presence of deciduous forests. This work is a preliminary study that highlighted the use of airborne pollen as bioindicator: there is a certain similarity in the pollen season trend of the various taxa among all the aerobiological stations of the metropolitan area of Rome, while delineating diversity of pollen species in line with the phytoclimatic characteristics described in the map of potential https://geoportale.cittametropolitanaroma.it/index.php/bdv/serie-di-vegetazione-e-qualita-ambientale/vegetazione-naturale-potenziale) [20] and real vegetation. The influence of weather-climatic conditions on the trend of pollen indicators, both phenological and productivity is now [6,21,22]; therefore, the next step will be to proceed with statistical analysis of correlation between more numerous pollen indicators of taxa and meteorological variables to detect the bioclimatic position of the monitoring stations.
This is a first contribution for the classification of the type of monitoring stations, from a geographical-environmental point of view [23,24].
Acknowledgement
It is our wish to express a particular thanks to Luciano Romanzi who strongly believed in this project.
References
- (2017) AA.VV. Dipartimento per gli Affari Regionali e le Autonomie Presidenza del Consiglio dei Ministri. 2017. I dossier delle Città Metropolitane. Città metropolitana di Roma I edizione, marzo.
- Papacci L, Iuliano S (2019) Rapporto statistico sull’area metropolitana romana. LE SCHEDE DEI COMUNI E DEI MUNICIPI. Città metropolitana di Roma Capitale - Ufficio metropolitano di Statistica Roma Capitale - Ufficio di Statistica.
- Van Leuken JPG, Swart AN, Droogers P, Van Pul A, Heederik D, et al. (2016) Climate change effects on airborne pathogenic bioaerosol concentrations: a scenario analysis. Aerobiologia 32(4): 607-617.
- Brighetti MA, Tocci R, Viglietti J, Travaglini A (2010) Il contributo del monitoraggio aerobiologico nello studio della flora esotica: l’esempio di Prospettive per la ricerca palinologica e paleobotanica italiana, Riunione scientifica, Firenze 2010.
- Charpin D, Pichot C, Belomonte J, Sutra JP, Zidkova J, et al. (2017) Cypress Pollinosis: from Tree to Clinic. Clinical Review in Allergy and Immunology. 56(2): 174-195.
- Brighetti MA, Costa C, Menesatti P, Antonucci F, Tripodi S, et al. (2014) Multivariate statistical forecasting modeling to predict Poaceae pollen critical concentration by meteoclimatic data. Aerobiologia 30(1): 25-33.
- Frenguelli G, Spieksma FThM, Bricchi E, Romano B, Mincigrucci G, et al. (1991) The influence of air temperature on the starting dates of the pollen season of Alnus and Populus. Grana 30(1): 196-200.
- Gehrig R, Clot B (2021) 50 Years of Pollen Monitoring in Basel (Switzerland) Demonstrate the Influence of Climate Change on Airborne Pollen. Front Allergy 2: 677159.
- Ziska LH, Makra L, Harry SK, Bruffaerts N, Hendrickx M, et al. (2019) Temperature-related changes in airborne allergenic pollen abundance and seasonality across the northern hemisphere: a retrospective data analysis. Lancet Planet Health 3(3): e124-e131.
- CEN/TS 16868:2019 (2019) Ambient air – Sampling and analysis of airborne pollen grains and fungal spores for allergy networks. Volumetric Hirst method.
- Galan C, Ariatti A, Bonini M, Clot B, Crouzy B, et al. (2017) Recommended terminology for aerobiological studies. Aerobiologia 33: 293-295.
- Jäger S, Nilsson S, Berggren B, Pessi AM, Helander M, et al. (1996) Trends of some airborne tree pollen in the Nordic countries and Austria, 1980–1993. A comparison between Stockholm, Trondheim, Turku and Vienna. Grana 35(3): 171-178
- IBM Corp. Released 2017. IBM SPSS Statistics for Windows, Version 25.0. Armonk, NY: IBM Corp
- Horbert M (1992) Das Stadtklima. In: Deutscher Rat fur Landesplege H. 61 Natur in der Stadt, pp. 64-73.
- Sukopp H, Horbert M, Stulpnagel A (1988) Zur Bedeutung der vegetation fur das Stadtklima. Aus: Conference Report. International Federation of Park and Recreation Administration. Innsbruck.
- Norris-Hill J, Emberlin J (1991) Diurnal variation in pollen concentration in the air of North-central London. Grana 30(1): 229-241.
- Norris-Hill J (1999) The diurnal variation of Poaceae pollen concentration in rural area. Grana 38(5): 301-305.
- Lollobrigida F (1994) “Il Parco Naturale Regionale Monti Simbruini” – Ente Parco Naturale Regionale Monti Simbruini – ITER, Subiaco (Roma).
- Anzalone B (1983) Le piante da proteggere nella provincia di Roma. Uomo, Natura e territorio. Assess. Sanità e Ambiente, Amm. Prov., Roma.
- https://geoportale.cittametropolitanaroma.it/index.php/bdv/serie-di-vegetazione-e-qualita-ambientale/vegetazione-naturale-potenziale
- Ziello C, Sparks TH, Estrella N, Belmonte J, Bergmann KC, et al. (2012) Changes to airborne pollen counts across Europe. PLoS ONE 7(4): e34076.
- Cristofolini F, Anelli P, Billi BM, Bocchi C, Borney MF, et al. (2020). Temporal trends in airborne pollen seasonality: evidence from the Italian POLLnet network data. Aerobiologia 36: 63-70.
- Blasi C (1994) Fitoclimatologia del Lazio. Fitosociologia 27: 151-175.
- Blasi C (a cura di) (2010) La vegetazione d’Italia. Palombi Editori.


