Assessing Urban Resilience to Thermal Risk: An Application for Athens, Greece
Thaleia Mavrakou, Anastasios Polydoros*, Constantinos Cartalis and Kostas Philippopoulos
Department of Physics, National and Kapodistrian University of Athens, Greece
Submission: October 08, 2021; Published: October 20, 2021
*Corresponding author: Anastasios Polydoros, Department of Physics, National and Kapodistrian University of Athens, Zografou Campus Building PHYS-V, 15784 Athens, Greece
How to cite this article: Mavrakou T, Polydoros A, Cartalis C, Philippopoulos K. Assessing Urban Resilience to Thermal Risk: An Application for Athens, Greece. 03 Int J Environ Sci Nat Res. 2021; 29(2): 556256. DOI: 10.19080/IJESNR.2021.29.556256
Abstract
Urbanization is a major driver of land use change and environmental degradation. In the context of climate change, it is essential to assess its impacts in order to ensure sustainable and resilient cities. In recent years, methodologies to assess urban resilience have been gradually developed but few of them study urban resilience using remote sensing data and products. In this study, a methodological framework is developed in order to assess the urban resilience to thermal risk, using remote sensing data and products, and apply it to Athens, Greece, as a case study. Results allow the identification of specific areas that exhibit low resilience to thermal risk. Findings suggest also that assessing urban resilience with remote sensing data allows the identification of specific interventions that could enhance the resilience to climate change related risks and the drafting of comprehensive plans for adapting and mitigating urban climate change.
Keywords: Urban resilience; Remote sensing; Climate change
Introduction
Today, around 360 million people - 72% of Europe's total population - live in cities. The percentage of the urban population in Europe continues to grow and is likely to exceed 80% by 2050 [1]. Currently in Greece 76% of population lives in urban areas, mainly within Athens urban agglomeration [2]. Urbanization interacts with climate change through the way cities are organized and built (i.e., land cover/land use changes, urban configuration and composition). Increased anthropogenic emissions intensify urban climate change [3] and consequentially affect the daily life of citizens. Despite the global efforts to mitigate climate change, its negative effects are already observed as extreme weather events (storms, drought, floods and heat waves) and natural disasters are evident and will become more frequent and severe [4]. Especially for cities, the most dangerous climate risk is the occurrence of thermal risk, due to its negative impacts on public health [5-7]. Specifically for Athens, the thermal risk associated with heatwaves has been correlated with cardiovascular and respiratory mortality [8,9].
The combination of the increasing urbanization rates, the intensifying urban thermal risk and the projected impacts of climate change highlight the need for assessing urban resilience to increasing urban temperatures due to climate change. The concept of resilience has gained increasing attention the last decade [10] although it remains a fuzzy and contested concept [11] mainly because it has been studied and described by various academic disciplines [12]. Several definitions of urban resilience along with a detailed description of the five research areas that the urban resilience concept is applied- namely climatic conditions, urban planning, urban communities, energy and disasters - can be found in [13]. This study considers resilience as the ability of a system to respond to a threat or hazard (i.e., heatwaves) and assess the urban resilience based on the climatic conditions and the urban planning characteristics of Athens.
Focusing on resilience has also resulted in the development of resilience indicators and indices to assess the resilience of a system [14] in order to characterize the elements of an urban system, to raise community awareness, as well as to monitor progress and prioritize the system needs [15,16]. Indicators should be used to transform resilience into a measureable concept and they can later be used to develop assessment tools that can be used to determine baseline conditions and evaluate effectiveness of interventions [17]. Numerous previous scientific contributions have dealt with the development of indicators measuring resilience at different spatial levels and based on different data sources [15]. Most of them are based on federal or institutional data for the different fields of observation, such as official census data or official land use surveys etc. and they can be expensive, differ in temporal frequency or are produced in different structure and formats, challenging the feasibility of standardized assessment methods [18]. Remote sensing offers long term observations in fine scales from a variety of sensors providing directly measured parameters or proxies associated with urban resilience in various spatial and temporal resolutions. Parameters such as land use/land cover, impervious density, land surface temperature which can be easily extracted from remote sensing data can act as indicators for assessing the urban resilience [19-22]. Especially for Athens such indicators were used to study the human thermal discomfort during heatwaves [23] and identify the thermal hot spots [24] using remote sensing data.
The objective of this research is to develop a methodology capable of assessing the urban resilience to thermal risk in urban areas by employing satellite remote sensing data. High spatial resolution remote sensing data and products are used to assess the urban resilience of Athens at neighborhood scale and identify and analyze the urban characteristics related with limited resilience to thermal risk. The proposed methodological framework is based on datasets produced with the same standards, thus promoting the comparative analysis of the urban resilience across all major European cities.
Materials and Methods
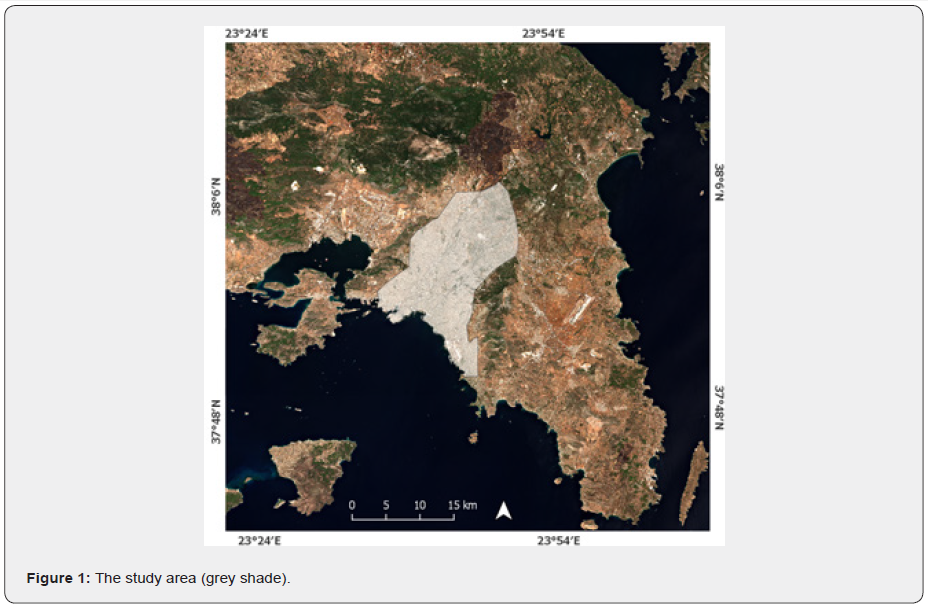
The study area is the Athens basin (Figure 1) which lies on a northeastern axis, surrounded at three sites by fairly high mountains and at its southern extremity is bounded by the Saronic Gulf. It covers a surface of about 285km2 that includes urban residential areas, commercial and industrial areas, transport units and the associated road network. The organization of urban space has been non-functional and characterized mainly by high building density, high degree of land-use mix, lack of open public spaces in central areas and closed vents to the natural environment of the surrounding countryside which affects the daily life of over 3 million inhabitants [25,26].
The overall methodological framework includes the following steps:
a) Selection of the appropriate satellite data parameters for assessing the urban resilience to thermal risk in urban areas.
b) Selection of the optimum clustering algorithm for defining spatial entities with similar characteristics in terms of thermal risk and identification of the optimal number of categories.
c) Statistical analysis of cluster centroids and assessment of urban resilience to thermal risk using a human thermal discomfort index.
In order to examine the urban resilience to thermal risk, urban thermal environment related parameters, such as Land Surface Temperature (LST) and Thom’s Discomfort Index (DI), were selected, as well as parameters related to the urban characteristics (land use, urban materials, etc.). Data were collected for the year 2017, which is the closest one to the acquisition date of all data used in this study and are described below.
Land surface temperature is considered a critical parameter for adaption and mitigation plans, as well as an indicator of urban resilience [19], and it is one of the most important variables measured by satellite remote sensing. LST was calculated at 30-m spatial resolution based on thermal remote sensing data from Landsat 8, using a single-window algorithm [27]. Three cloud free summer images were employed in order to calculate an average LST dataset for the 2017 summer.
Normalized Difference Vegetation Index (NDVI) is a widely used remote sensing index to describe the presence of healthy vegetation. For this study it is calculated at 10m spatial resolution using Sentinel-2 satellite data [28]. Densely vegetated areas tend to have high positive values, while built-up areas are represented by near zero values. Urban resilience is increased through the inclusion of urban nature based solutions like urban greenery and their associated delivery of ecosystem services in urban areas [29].
The Copernicus Land Monitoring Service (CLMS) [30] provides a series of remote sensing products on the status and evolution of the land surface. The pan-European component of the service provides high resolution products describing land cover, land use and specific land cover characteristics while the local component provides specific and detailed information on areas that are prone to specific environmental challenges and problems such as major European cities. The Copernicus data are distributed on a full, free and open basis and their usefulness relies on the use of high resolution satellite data, which provide homogeneity, repetitiveness and objectivity over the whole of Europe. The CLMS data used in this study are described below.
The imperviousness density (IMD 2018) product of the CLMS captures the percentage of soil sealing at a 10m spatial resolution. Impervious areas are characterized by man-made surfaces which are usually maintained over long periods of time. Impervious surfaces alter sensible and latent heat fluxes while they can create heat stress through the absorption and storage of solar energy during the day. At night this storage energy is emitted back to the sky causing urban heat islands. Thus the IMD can be used as an urban resilience indicator [19].
The Building Height (BH 2012) product of the CLMS is a high-resolution Digital Height Model (DHM) that provides building height information for urban areas at a 10m spatial resolution. This product is very useful in order to achieve a better insight into measuring urban density and is essential for effective spatial and urban planning. This information is widely used for the purpose of the research on urban microclimate providing concise information regarding wind speed flows, urban heat island and shading effect [31].
The Urban Atlas CLMS product provides detailed coverage of land cover and land use for major European cities with more than 100.000 inhabitants [32]. The availability of such a huge dataset produced with the same standards promotes the comparative analysis of the urban areas across Europe. The Urban Atlas cities are mapped in 20 classes, of which the 17 urban classes have a minimum mapping unit of 0.25 ha and the 3 non-urban classes a MMU of 1 ha. Urban ecosystems are complex mosaics of multiple land uses which are in a state of continuous changes. These can lead to less desirable, unwanted states in urban areas compared to natural ones, such as biota degradation and loss of ecosystem services [33]. This potential loss of such services also leads to loss of urban resilience.
All data were processed in the freely available QGIS [34] software in order to be reprojected in a common geographic coordinate system and resampled to 100m spatial resolution, which is an appropriate spatial scale to depict the urban characteristics, assess urban resilience and plan adaptation and mitigation actions. Geographic information systems (GIS) are widely used as a tool to identify hazards and map the spatial attributes contributing to resilience. This can improve the understandings of the factors that influence local resilience and its spatial variability [35].
The methodology for assessing the urban resilience to thermal risk in urban areas is based on the spatial clustering of the data and on selecting the optimum number of clusters using inter- and intra-cluster similarities. Clustering is a process in which sets of input data points are grouped in categories, which contain data points that are very similar to each other, while at the same time differing significantly from data points of different categories. A critical aspect in selecting the optimum cluster algorithm for this study is the use of both categorical and numerical data. The mixed-type k-prototypes clustering algorithm is selected as it has the ability to recognize structures in the input datasets based on a criterion that simultaneously examines the geometric similarity of both continuous and discrete variables [36].
In order to assess and compare the resilience level of each category UrbClim data [37] from the Copernicus Climate Change Service [38] were used to calculate Thom’s discomfort index [39] at a spatial resolution of 100m. DI was calculated for the days that LST was produced using hourly data of air temperature and relative humidity. The UrbClim model scales large-scale weather conditions down to agglomeration-scale and computes the impact of urban development on the most important weather parameters, such as temperature and humidity, required for the discomfort index calculation. The mean daily DI value was calculated for each category, while categories with low mean DI values were considered as more resilient to thermal risk. Finally the resulting categories were characterized using linguistic values (i.e. “High resilient”, “moderate resilient”, etc.).
Results and Discussion
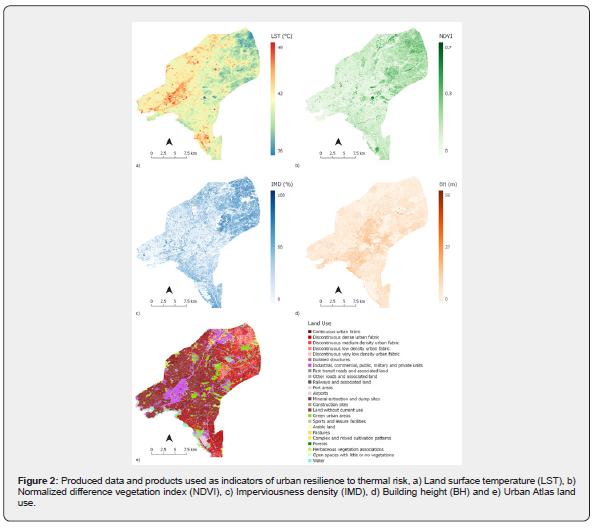
Figure 2 presents the produced data and the CLMS products used for the assessment of urban resilience to thermal risk. The LST spatial distribution is presented in Figure 2a where it is clearly observed that the western parts of the Athens basin exhibit the highest values. The high spatial resolution of the produced LST data allows the identification of small areas considered as hot spots. Regarding NDVI (Figure 2b) high values, associated with urban vegetation, are depicted mainly in the northeastern part of the study area. Extremely low values of NDVI are found at the central and southern areas indicating the lack of natural vegetation. Concerning the soil sealing of the study area, the western and central parts of the study area exhibit the highest imperviousness density contrary to the northern and southern parts, while numerous impervious surfaces are scattered across the study area (Figure 2c). Regarding building height, Figure 2d shows that the highest buildings are concentrated at the central part of the study area, where the municipality of Athens is located and the most of the economic activity takes place. As far as land use is concerned, various land uses characterize the study area (Figure 2e); 29% is occupied by Continuous Urban fabric, 17% by Discontinuous Dense Urban Fabric, 12% by Industrial, commercial, public, military and private units, 16% by road network and 7% by Green urban areas.
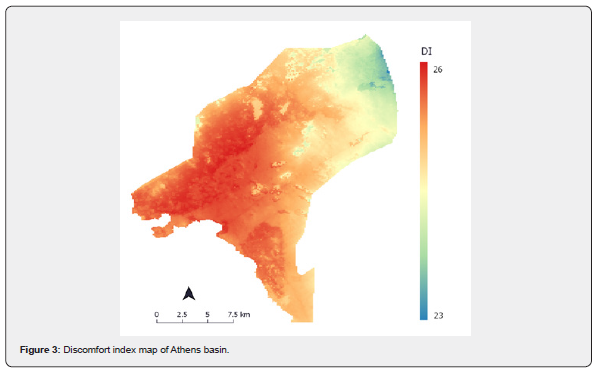
The spatial distribution of DI is presented in Figure 3; the western part of the city exhibits higher discomfort values than the central and eastern parts. It must be noted that DI values below 24 indicate that less than 50% of the population feels discomfort and DI values over 24 indicate that more than 50% of the population feels discomfort. Interestingly, DI values below 24 are found only at the northeastern part of the study area.
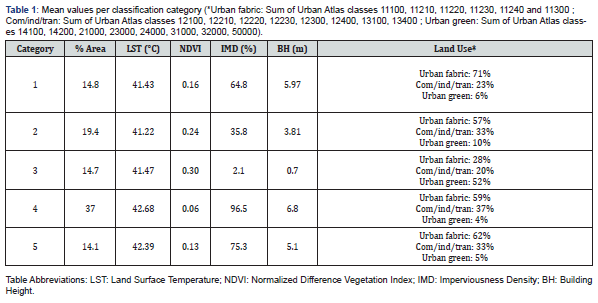
The optimum number of k-prototypes, following the proposed methodology, was selected subjectively in our case from evaluating the corresponding centroid maps. In the case of Athens five clusters exhibit maximum inter-cluster differences and intra-cluster similarities. Characteristically in the case of six clusters the differences between two centroids are minimal without increasing the overall accuracy of the corresponding results. Table 1 provides an overview of the five categories, produced by the K-prototypes algorithm application. LST, NDVI, IMD and BH mean values along with the area extent and the land use characteristics are presented for each category. Significant differences between categories are observed confirming the successful application of the K-prototypes algorithm. Particularly, category #1 is characterized by a high percentage of urban residential land use; category #2 exhibits the lowest LST values; category #3 is characterized by high NDVI values since it contains mainly urban green land uses; category #4 occupies 37 % of the study area and exhibits the highest IMD, BH and LST values and finally category #5 is characterized by high values of IMD, BH and LST but significant lower that category #4.
The above analysis provides a quantitatively indication of the resilience levels of each category. In order to confirm these indications and to evaluate the capacity of the selected remote sensing indicators to assess urban resilience, the mean DI value in each category was calculated (Table 2). Based on this analysis the five categories were transformed into five urban resilience classes. As expected categories with high NDVI values and low IMD, LST and BH values exhibit the lower DI values and vice versa. The results suggest that urban resilience to thermal risk increases with increasing presence of urban greenery and decreases with increasing imperviousness density, building height and land surface temperatures. This indicates the appropriate actions and measures to enhance urban resilience.
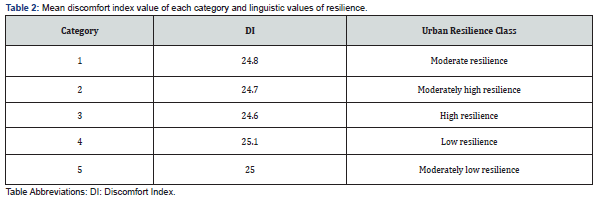
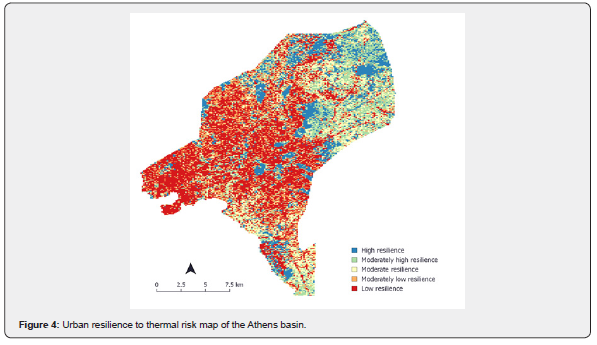
Figure 4 presents the urban resilience to thermal risk map of Athens basin as described by the five urban resilience classes in Table 2. It is evident that the western and central parts of the study area have low resilience levels compared to the eastern parts. This practical mapping of urban resilience provides an example of how a complex and multidimensional concept, such as urban resilience, can be communicated to local authorities, policy makers and citizens. The high spatial resolution of the data used allows the mapping of urban resilience at neighborhood scale, indicating specific areas where adaptation and mitigation interventions should be prioritized.
Conclusion
This study exploited the capacity of remote sensing data and Copernicus Land Monitoring Service products to assess the urban resilience to thermal risk. The proposed methodological framework provides the opportunity to scientists, local authorities and policy-makers to monitor the spatial patterns of urban resilience at neighborhood scales, to assess the effectiveness of urban policies and to use it as a tool for comparative benchmarking between European cities. Given the above remote sensing data and CLMS products provide a better insight into cities and their resilience, thus facilitating evidence based policy-making.
An urban resilience to thermal risk map of Athens basin was developed based on high resolution remote sensing data. The eastern part of the Athens basin exhibits higher resilience to thermal risk compared to the western and central parts. Furthermore, the results suggest that urban resilience to thermal risk increases with increasing presence of urban greenery and decreases with increasing imperviousness density, building height and land surface temperatures. The above indicate the appropriate actions and measures to enhance urban resilience such as the reduction of the land surface temperature of the built areas with the use of cool materials or other technologies and the increase urban greenery with methods that promote natural-based solutions (e.g., pocket parks, green roofs).
Finally, the results of this study demonstrate the close interlinks between urbanization, the built environment and urban resilience to thermal risk. A thorough study of these interlinks is considered necessary for assessing the urban resilience levels at the city scale. Urban resilience indicators can be used to identify the specific characteristics of low resilience areas allowing the drafting of differentiated adaptation and mitigations plans at local level instead of generic regional plans.
Acknowledgement
This research is co-financed by Greece and the European Union (European Social Fund- ESF) through the Operational Programme «Human Resources Development, Education and Lifelong Learning 2014-2020» in the context of the project “Development of a composite urban climate change resilience index with the use of remote sensing data.” (MIS 5048138).
References
- United Nations, Department of Economic and Social Affairs, Population Division (2019). World Urbanization Prospects: The 2018 Revision (ST/ESA/SER.A/420). New York: United Nations, USA.
- Salvati L (2020) Envisaging long-term urban dynamics: a spatially explicit analysis of local-scale population growth and natural balance. Letters in Spatial and Resource Sciences 13(2): 165-186.
- Climate Change 2013: The Physical Science Basis. In: Stocker TF, Qin D, Plattner GK, Tignor M, Allen SK, et al. (Eds.), Contribution of Working Group I to the Fifth Assessment Report of the Intergovernmental Panel on Climate Change. Cambridge University Press, Cambridge, United Kingdom and New York, NY, USA, p. 1535.
- Mal S, Singh RB, Huggel C, Grover A (2018) Introducing linkages between climate change, extreme events, and disaster risk reduction. In Climate change, extreme events and disaster risk reduction. Springer, Cham, pp. 1-14.
- Macintyre HL, Heaviside C, Taylor J, Picetti R, Symonds P, et al. (2018) Assessing urban population vulnerability and environmental risks across an urban area during heatwaves–Implications for health protection. Science of the total environment 610-611: 678-690.
- Kenney WL, Craighead DH, Alexander LM (2014) Heat waves, aging, and human cardiovascular health. Medicine and Science in Sports and Exercise 46(10): 1891.
- Kovats RS, Kristie LE (2006) Heatwaves and public health in Europe. European Journal of Public Health 16(6): 592-599.
- Dimitriadou L, Nastos P, Zerefos C (2021) Defining Heatwaves with Respect to Human Biometeorology. The Case of Attica Region, Greece. Atmosphere 12(9): 1100.
- Paravantis J, Santamouris M, Cartalis C, Efthymiou C, Kontoulis N (2017) Mortality associated with high ambient temperatures, heatwaves, and the urban heat island in Athens, Greece. Sustainability 9(4): 606.
- Meerow S, Newell JP, Stults M (2016) Defining urban resilience: A review. Landscape and Urban Planning 147: 38-49.
- Salata KD, Yiannakou A (2020) The Quest for Adaptation through Spatial Planning and Ecosystem-Based Tools in Resilience Strategies. Sustainability 12(14): 5548.
- Koslowski TG, Longstaff PH (2015) Resilience Undefined: A framework for interdisciplinary communication and application to real-world problems. In Disaster management: Enabling resilience. Springer, Cham, pp. 3-20.
- Ribeiro PJG, Gonçalves LAPJ (2019) Urban resilience: A conceptual framework. Sustainable Cities and Society 50: 101625.
- Doorn N (2017) Resilience indicators: Opportunities for including distributive justice concerns in disaster management. Journal of Risk Research 20(6): 711-731.
- Cutter SL (2016) The landscape of disaster resilience indicators in the USA. Natural Hazards 80(2): 741-758.
- Feldmeyer D, Wilden D, Kind C, Kaiser T, Goldschmidt R, et al. (2019) Indicators for monitoring urban climate change resilience and adaptation. Sustainability 11(10): 2931.
- Sharifi A, Yamagata Y (2016) Urban resilience assessment: Multiple dimensions, criteria, and indicators. In Urban Resilience. Springer, Cham, pp. 259-276.
- Sauter H, Feldmeyer D, Birkmann J (2019) Exploratory study of urban resilience in the region of Stuttgart based on Openstreetmap and literature resilience indicators. International Archives of the Photogrammetry, Remote Sensing & Spatial Information Sciences.
- Chrysoulakis N, Mitraka Z, Marconcini M, Ludlow D, Khan ZA, et al. (2020) Copernicus for urban resilience in Europe: The CURE project. In Remote Sensing Technologies and Applications in Urban Environments. International Society for Optics and Photonics 11535: 1153503.
- Ghaffarian S, Kerle N, Filatova T (2018) Remote sensing-based proxies for urban disaster risk management and resilience: A review. Remote Sensing 10(11): 1760.
- Cartalis C, Polydoros A, Mavrakou T, Asimakopoulos DN (2015) Earth Observation in Support of Urban Resilience and Climate Adaptability Plans. The Open Remote Sensing Journal 6(1): 17-22.
- Milesi C, Churkina G (2020) Measuring and monitoring urban impacts on climate change from space. Remote Sensing 12(21): 3494.
- Polydoros A, Cartalis C (2014) Assessing thermal risk in urban areas–an application for the urban agglomeration of Athens. Advances in Building Energy Research 8(1): 74-83.
- Mavrakou T, Polydoros A, Cartalis C, Santamouris M (2018) Recognition of thermal hot and cold spots in urban areas in support of mitigation plans to counteract overheating: Application for Athens. Climate 6(1): 16.
- Chorianopoulos I, Pagonis T, Koukoulas S, Drymoniti S (2010) Planning, competitiveness and sprawl in the Mediterranean city: The case of Athens. Cities 27(4): 249-259.
- Papamanolis N (2015) The main characteristics of the urban climate and the air quality in Greek cities. Urban Climate 12: 49-64.
- Parastatidis D, Mitraka Z, Chrysoulakis N, Abrams M (2017) Online Global Land Surface Temperature Estimation from Landsat. Remote Sens 9(12: 1208.
- Wong MMF, Fung JCH, Yeung PPS (2019) High-resolution calculation of the urban vegetation fraction in the Pearl River Delta from the Sentinel-2 NDVI for urban climate model parameterization. Geoscience Letters 6(1): 1-10.
- Bush J, Doyon A (2019) Building urban resilience with nature-based solutions: How can urban planning contribute? Cities 95: 102483.
- ©European Union, Copernicus Land Monitoring Service 2021, European Environment Agency (EEA)
- Kaluski M, Hoscilo A, Gurdak R, Sensing, R (2018) Accuracy assessment of the Copernicus Buildings Height 2012 layer based on the city of Warsaw. Geoinformation Issues 10(1(10)): 53-64.
- Montero E, Van Wolvelaer J, Garzón A (2014) The European urban atlas. In Land use and land cover mapping in Europe. Springer, Dordrecht, pp. 115-124.
- Colding J (2007) Ecological land-use complementation for building resilience in urban ecosystems. Landscape and Urban Planning 81(1-2): 46-55.
- org (2021) QGIS Geographic Information System. QGIS Association.
- Hung HC, Yang CY, Chien CY, Liu YC (2016) Building resilience: Mainstreaming community participation into integrated assessment of resilience to climatic hazards in metropolitan land use management. Land Use Policy 50: 48-58.
- Huang Z (1998) Extensions to the k-means algorithm for clustering large data sets with categorical values. Data Mining and Knowledge Discovery 2(3): 283-304.
- De Ridder K, Lauwaet D, Maiheu B (2015) UrbClim–A fast urban boundary layer climate model. Urban Climate 12: 21-48.
- © European Union, Copernicus Climate Change Service 2021.
- Thom EC (1959) The discomfort index. Weatherwise 12(2): 57-61.


