Multi-Temporal Study of Land Use Land Cover Changes
Addo Koranteng1*, Isaac Adu Poku2, Emmanuel Donkor3 and Tomasz Zawiła Niedźwiecki4
1Kumasi Technical University, Institute of Research, Innovation and Development, Ghana
2Department of Geomatic Engineering, Kwame Nkrumah University of Science and Technology, Ghana
3Resource Management Support Centre of Forestry Commission, Ghana
4Coordination Centre for Environmental Projects, Poland
Submission: August 19, 2021; Published: October 06, 2021
*Corresponding author: Addo Koranteng, Kumasi Technical University, Institute of Research, Innovation and Development, Kumasi, Ghana
How to cite this article: Addo K, Isaac Adu P, Emmanuel D, Tomasz Zawiła N. Multi-Temporal Study of Land Use Land Cover Changes. Int J Environ Sci Nat Res. 2021; 29(1): 556254. 10.19080/IJESNR.2021.29.556254
Abstract
Anthropogenic activities have profound impact on Land use and land cover (LULC) the world over affecting all abiotic and biotic components in all environments. Studying the effects of past, present and future LULC on forest cover and other dynamic land uses provide valuable information for environmental, land planning and climate change mitigation measures. This study uses a combined methodology of Remote Sensing and Geographical Information System to map historical, current and future LULC through Satellite imagery (Landsat TM, Landsat ETM+, ALOS, Disaster Monitoring Constellation-DMC and SENTINEL) covering Greater Kumasi in a 40-year period. LULC classes such as Agriculture, Built-up, Close Forest, Open Forest, and water were considered based on the predominant geographical sceneries, remote sensing data and field study. Markov Cellular Automata modelling was employed for the estimation of likely LULC changes for the year 2040. The study discovered a perturbing development of forest loss (forest degradation and deforestation), decreasing agricultural activities whiles the Built-up share ballooned. Increasing urbanization at the expense of forest cover and transformation of agricultural lands into human settlements were observed. The forecasted LULC map for 2040 indicated an upward growth in Built up areas at the detriment of the other LULC categories. The outcomes validate the urgent necessity for critical review of regulations in LULC policy strategy, design, and development for the protection of forests and other critical ecosystem services to be preserved. This trend encompassing historical, current and future LULC necessitates that prudent resolutions have to be made to guarantee forest cover, make available land for agriculture and to mitigate the effects of the climate change
Keywords: Remote sensing; Cellular-automata-markov; Forest loss; Urbanization
Introduction
The Climate Change phenomenon is reckoned to be linked to Land use land cover (LULC) changes and the activities of humans [1-3]. Consequently, Land use land cover change (LULCC) information at varying spatial and time-scales is vital in appraising abiotic and biotic components in all environments trends [4,5]. For optimum planning, management, regulation and utilization of the of the earth’s resources it is vital for resource managers and users to understand the nature of change and the rate of LULCC [6,7]. Kagombe et al. [8] reasoned that, information on LULCC is also essential in resource economics as it impacts the dynamics of proximal livelihood opportunities as well as distal interrelated economic activities and resources.
Gatsi & Appiah [9] project Ghana’s urban population to hit 65% by 2030 from the current 52% of the total population to about 65% by 2030. This surging rate undoubtedly has serious ramifications for natural environments in urban hubs as economic forces escalate [10]. For a long time, Ghana’s second largest city (Kumasi) was fondly referred to as West Africa Garden city, unfortunately this is not the case anymore. This prestige has been lost due to urban development [11]. An economic analysis study by Quartey [12] in Kumasi via a Hedonic Price Model contrasted the overall economic usage value of forests with the user value of the forest. The assessment revealed that Kumasi (Ghana) loses a net minimum of US$ 35 million each year in carbon credits because of deforestation.
Remote sensing and Geographic information system (GIS) provide a cost-effective technology which have unique environmental capabilities to monitor vast region of the earth for extracting information related to the earth’s land, ocean, and atmosphere [13,14]. Remote sensing offers a cost-effective alternative of mapping landscape resources and analyzing changes over the traditional ground-based surveying methods. While the latter methods will continue to be important in ground-truthing exercises for validation and calibration of remotely sensed data, it is generally agreed that application of remote sensing technologies for mapping of resources over large areas and with need for temporal replication is far much economical in comparison to traditional methods. They provide effective tool for analyzing the land use dynamics of a region, as well as for monitoring, mapping and management of natural resources, [15,16]. Indeed, remote sensing approach employing the moderate resolution satellite imageries like Landsat Thematic Mapper, Landsat Enhanced Thematic Mapper Plus, SPOT Vegetation among others has widely been accepted [17,18]. It has gained prominence in wide range of application such as landscape resource assessment, resource monitoring, land cover change analysis, drought monitoring, and biomass estimation among others.
This study intends to produce past, current and future LULC map of Greater Kumasi. The study seeks to assess the LULCC for the period 1990 – 2020 in a ten-year interval. This is envisaged to offer an insight into the extent, and pattern of LULCC. The study also purposes to offer a synopsis of the key pressures causing the unbridled urban growth and to forecast the LULCC extent of the region by 2040.
Methodology
Study area
Greater Kumasi is centrally located in the middle belt of Ghana and its lies within longitude 1058’W and 1011’W and latitude 6022’N and 7011’N. The study area in the Ashanti Region includes the Afigya Kwabre, Asokore Mampong Municipal, Atwima Kwanwoma, Atwima Nwabiagya, Bosomtwe, Ejisu Juaben Kwabre, and Kumasi Metropolis. These administrative divisions are within the semi-deciduous forest zone and inundated with deforestation and degradation as a result of anthropogenic activities. The Ashanti Region remains the most populous region in all census years 1960-2010 [19]. The population of the region is anticipated at 5,792,200 as at 2019 from 1,109,133 in 1960 [19]. The climate conditions in study area features both wet and dry conditions with stable temperature throughout the course of the year, an average of 1400mm of rain per year. The topography of the study area is undulating with a number of rivers running through the study area and has an average elevation of 250m above Mean Sea Level (MSL). The Owabi and Berekese head works located in the study area are the main source of portable drinking water. Lake Bosumtwi is natural lake (formed from antique meteorite impact crater) is located within the study area. This lake offers means of livelihood such as a fishing industry to the neighboring towns and villages. It is also a hot hub tourism attracting foreign and local and tourist [20].

Data acquisition
Inventory of Satellite data used for LULC classification and Reference Data are itemized in Table 1 & Figure 1.

Image preprocessing
Parsa et al. [21] posit that image pre-processing is essential in to examining LULCC as errors emanating from imaging sensors, atmospheric effects and curvature of the Earth, when overlooked produce false results. Images procured from different months of the year based on obtainability of cloud free data, are mostly influenced by seasonal disturbances and atmospheric effects like aerosols, dust particles, cloud, varying sun angle etc. Also, noises in data emanating from limitations in sensing by the sensor, signal digitization, or data recording process significantly degrade the radiometric information of the image [22]. These images were subjected to a rigorous atmospheric and radiometric correction to minimize the influences of clouds, atmosphere and sun elevation angle.
The individual bands of the downloaded satellite images (1990 LandSat TM & 2000 LandSat ETM+ and 2020 Sentinel) were merged into three different composite images. The 2010 DMC, the individual scenes of Landsat images were subsequently resampled to 10m resolution for better change detection analysis. The images were subsequently enhanced using Histogram Equalization. The 1990 and 2000 Landsat images were found to be hazy and were corrected.
Land use classes
The following broad LULC classes were chosen based on satellite image availability and study of literature (Table 2).
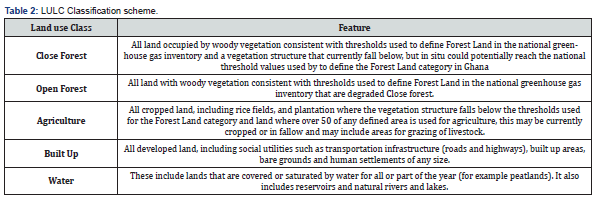
Image classification
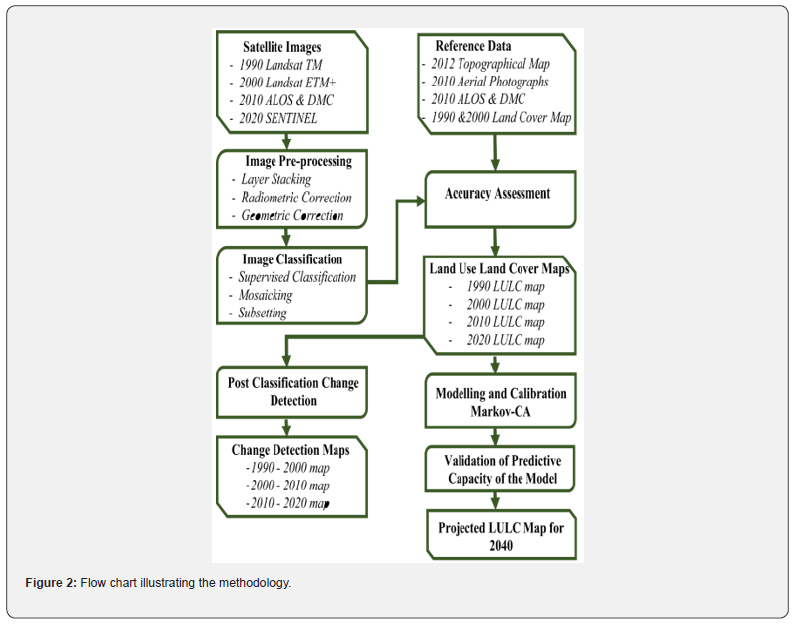
The modified Anderson Level I classification Scheme [23] which is the worldwide accepted and widely used LULC classification scheme was used in this study to achieve desired LULC categories from satellite imagery. A total of 160 ground truth data were taken randomly evenly distributed on site by a stratified random sampling. Using a total of 60 training points coupled with local knowledge and google earth images, the 2020 image were classified and the remaining 100 points were used to assess the accuracy of the image classification. A supervised classification based on maximum likelihood was employed to classify the study area into five (5) land use categories: (1) Close Forest; (2) Open Forest; (3) Agriculture Lands; (4) Built Up and (5) Water. The 2010 ALOS images were classified using the 2010 aerial photographs covering the study area whiles the 2000 and 1990 Landsat images were conducted based on the land cover Map of Ghana obtained from CERGIS and prior “local knowledge” of the area. The various classified scenes of ALOS, DMC and Landsat images were then mosaicked into the individual classified maps (1990, 2000 & 2010 maps). All the individual classified LULC maps were later subset to our area of interest (study area) Confusion matrix and kappa statistics were used to assess the accuracy classified images.
Accuracy assessment of LU/LC classification
Accuracy assessment vitally is an approach to validate the classification undertaken as meeting acceptable standards. The accuracy assessment tool in Erdas Imagine 2014 was applied so as to produce the accuracy for each LULC map. Image Accuracy assessment was measured in percentage (%) and that was in 80.45 % for 1990, 81.24% for 2000, 83.65% for 2010 and 90.89% for 2020.
Change detection analysis
The study employed a Post-Classification Change Detection in assessing the LULCC that had occured over the thirty year’ period (1990-2020). The LULC categorized images converted into maps were in ArcGIS and Microsoft Excel used to produce tables of area and percentages. All the three LULC classified images in Erdas format (.img) were exported. Using ERDAS of the two thematic maps of the same dimensions at a time could be analyzed. By the 1990, 2000, 2010 and 2020 thematic maps as input, the following results were generated for the three-time epochs (1990 - 2000, 2000 - 2010, 2010 - 2020).
Modelling and predicting LULC change
CA is a very efficient tool for forecasting spatial dynamic urban growth [24]. Verburg et al. [25] and Feng et al. [26] posit that apart from the optimum determination of CA transition rules based on the cell status and those of its neighbors in CA urban growth modeling, there are other factors called constraints (environmentally sensitive areas, restricted areas and development policies) and development potentials. This is given in equation (1)

Where:
 and
and  - states of a cell at location ij at time t and t + 1,
f - is the transition function;  - neighborhood evaluation function,
Con - constraints of influencing factors; N - is the number of cells.
Yang et al. [27] and Feng et al. [26] consequently add that, the development potential value of the cell at location ij at time t is expressed in equation (2)

Where
(Pc) - development potential value of the cell; ij – location
t - time ; (Pg) - potential value of cell at location
γ - stochastic factor ranging from 0 to 1,
α - parameter to control the degree of stochasticity.
Veldkamp & Lambin [28], Turner et al. [29] and Feng et al. [26] continue that LR is a multi-variant discovery method that is often combined with CA. LR has the ability to reduce spatial dependency among variables and remove spatial autocorrelation. Employing LR, the development potential of cell at location ij, (Pg)ij, based on spatial factors is given in equation (3)

where x1, x2, …, xk are various spatial development variables impacting urban growth, a1, a2, …, ak are different weights for the variables.
Furthermore, Wu [30] states that urban growth is impacted by dynamic factors such as the local interaction between a cell at location ij and its neighborhood cells. The potential of neighborhood effects () within an n × n Moore’s neighborhood of the cell at location ij is denoted in equation (4)

where Con(Stij=urban) displays the amount of urban cells in Moore’s neighborhood. Stij is situation of cell at location ij . The value of the estimated development potential (Pc)tij is constrasted with a threshold value (Q) to choose either its a non- urban cell can be transformed to an urban cell at time t + 1. Q is a uniform random distribution grid in range of [0, 1] [30-32] equation (5)

The 2010-2020 land-cover maps were first used as inputs in Markov module to generate a transition matrix and a set of conditional probability images between the two dates of the thematic maps. These resulting outputs were later loaded in the CA-Markov module to generate the 2020 predicted map. Afterwards, the predicted 2020 land-cover map was compared with actual land-cover map of 2020 for validation. Following the validation, the 1990-2020 land-cover maps were used to predict the 2040 land-cover map.
Flow chart for the study
All the GIS and remote sensing processes are summarized in Figure 2.
Results
Image classification and accuracy assessment
Foody [33] and Behera et al. [34] intimate that accuracy assessment is essential, and particularly so, when using post-classification change detection methods Accuracy assessment of the LULC Maps produced from the 1990, 2000, 2010 and 2020 were performed and assessment report was generated. Total classification accuracy of 80.00% was attained. Overall Kappa statistics of 0.7375 was realized for 2020 LULC. The Ghana Forest Preservation Program -report [35] Ground truthing and verification data was used for this activity. Accuracy assessments for 1990, 2000, 2010 images were undertaken through Topographical Map, Aerial Photograph, Land Cover Map, Digitized Topographical data photographs, data and reference points from statutory bodies such as the Forestry Commission and Survey Department.
LULC maps assessment

The Table 3 shows the extent of the area of the individual LULC in hectares (ha) and expressed in percentages. Five (5) LULC classes were produced based on supervised classification - Closed Forest, Open Forest, Agriculture, Built Up and Water. Figure 3A-3D display the four thematic maps generated for 1990, 2000, 2010 and 2020 LULC Maps respectively.

Figure 3A displays the LULC map for 1990 where Close and Open forests constituting a little over 63%; Agriculture constitute next dominant LULC category at 29%; Built-Ups is displayed at 5% of the LULC and Water share of the LULC aggregating 2%.
The LULC map (Figure 3B) for 2000 shows Close and Open forests plummeting to 53% Agriculture increases slightly from 29% in 1990 to 33%; Built-Ups doubles from 10% from 5% in 1990. Water part of the LULC remains same.
LULC map for 2010 (Figure 3C) portray Close and Open forests bounce to 62% from 53% in 2000 as results of considerable reforestation efforts. Agriculture drops to 20%; Built-Up to increases at the expense of Agriculture to 15%. Water share of the LULC remains constant.
The LULC map for 2020 (Figure 3D) shows Close and Open forests plummeting to 50% Agriculture remaining stable @ 20%; Built-Ups surge endures from 15% to 27%. Water share of the LULC remains same.
LULC change detection
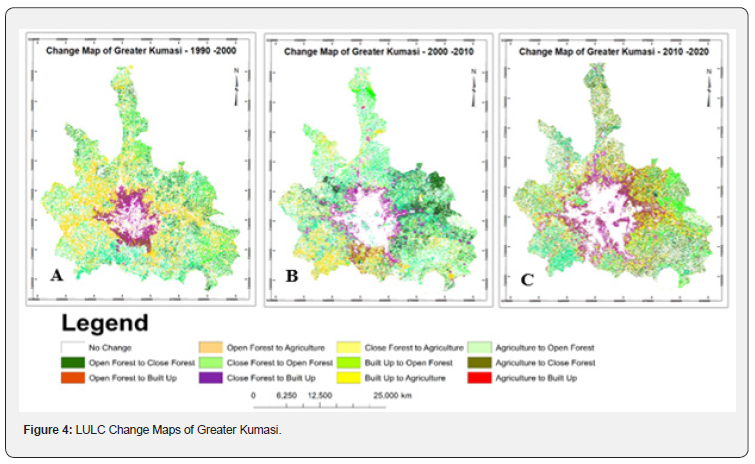
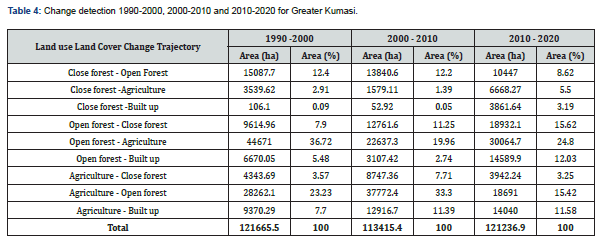
The Table 4 show the scope of change in the area of the individual land cover classes in hectares (ha) and the percentage they occupied for 1990–2000, 2000 – 2010 and 2010 – 2020 respectively. Figure 4A-4C provide illustrations of the changes that have transpired. An overall scrutiny defines a severe change from 1990 to 2000 (Figure 4A) as Close and Open forests decrease whereas Agriculture and Built up area increase. The LULCC map incessantly changes from 2000 to 2010 (Figures 4B) as Close forest and Built up improves as Agriculture drops. This fast expansion illustrates positive influence headed for urbanization and reforestation. Incessantly, the LULC map continues from 2010 to 2020 (Figure 4C) as Open forest is used up mostly for Built up, whiles Agriculture remains stable. This development illustrates positive impact towards urbanization as in the previous decade.
Validation of the 2040 LULC map
The validation used the computer-generated 2020 LULC map produced by the CA-Markov model and compared it to the actual present 2020 LULC map. Assessment of simulated and actual classified map for the year 2020. Close forest area and water bodies had the best agreement. The simulated LULC map showed an overestimated share for Open at 51% whiles the Actual LULC map showed it to be 40%. The simulated LULC map showed that Agriculture and Built up areas were underestimated at 16% and 17% while the Actual LULC map put the figures at 20% and 25.
Kappa coefficient was used as the main statistical evaluation based on the to measure the overall agreement of matrix, the ratio diagonal values summary versus total number of pixel totals within matrix, and the non-diagonal elements is the optimum method to evaluate the model accurateness [36]. A kappa value of 0 shows the agreement between actual and reference map (equals chance agreement), the upper and lower limit of kappa is +1.00 (occurs when the is total agreement) and -1.00 (happen when agreement is less chance). The accuracy assessment process achieved by employing VALIDATE module in IDRISI Selva environment v.17 produced K values (Kstandard = 0.6595; Kno = 0.7313; Klocation = 0.7241; KlocationStrata = 0.7241) above 0.8 displaying reasonable level of accuracy [37]. The values were deemed to be within the standard values recommended by Monserud & Leamans [38].
LULC 2040 quantification
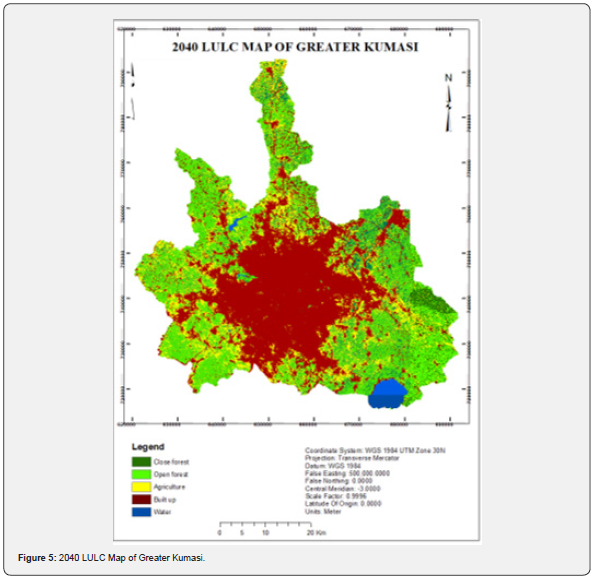
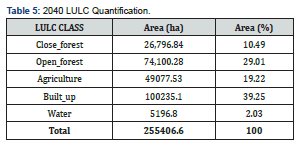
Table 5 & Figure 5 show the amount of the area of the different LULC in hectares (ha) and expressed in percentages for the predicted LULC map for 2040. The aggregate forest cover comprising both the Close and Open forests had reduced as the area are being converted for agricultural use and built up purposes. Agriculture declines as the area is converted into Built up. Built-Up category is the main LULC. Water level remains stable. This fast expansion shows positive impact towards the urbanization.
LULC trajectory for 1990 - 2040
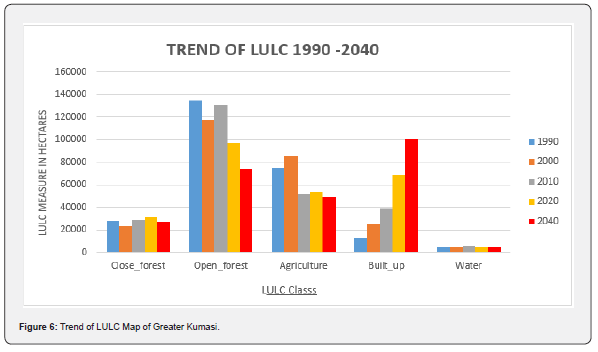
Figure 6 shows the course of LULC from 1990–2040 covering 50years. The illustration defines a perturbing scenario for forests. There is forest loss (deforestation and degradation) from as high as 66% in 1990 by 2040 to 44%. Agricultural land will continue to decline paving way formore houses and social amenities to be provided. Built-ups share would continue be the fastest growing land use class from 4.8% in 1990 35.2% by 2040. The water share remains unchanging throughout the 50 year under consideration.
Discussion
Remote sensing and GIS in LULC appraisal
The optimal utilization of the land and its resources requires an in-depth information of the historical, current and possible future scenarios. RS and GIS provide the tools expedient for monitoring the dynamics of LULC ensuing out of both the changing demands of increasing populace and elements of nature acting to influence the landscape [39,40]. Processes emanating from natural and man-made activities cause the transformation of earth’s atmosphere and land [41,42]. The assessment of the spatial-temporal patterns of LULC in forests, rural, urban and other land use forms are necessary to the understanding of the evolution of forest loss, urban systems and other critical ecosystem services. Consequently, information about LULC extent, change and forecasting are essential for apprising land cover maps and the management of natural resources [43,44].
Satellite imagery deliver a proficient means of obtaining information (data) on spatial distribution and temporal trends of LULC required for quantifying, appraising, forecasting and projecting land changes [45,46]. Additionally, in inaccessible (such as mountainous, marshy, glacial and many others) terrain, remote sensing technique is feasibly the only method of procuring the relevant data at a cost and time effective basis [47,48].
LULC trajectory
In the selection of the training sites for the supervised classification of the Greater Kumasi stratified random sampling ensured quality results. This involved employing expert knowledge, as the area of interest was disseminated into strata that maximized the dissimilarities between units and minimize the difference within each unit. Strata designated (One or more) were appraised to be main drivers of the system under scrutiny. A random sample was then selected from each unit or stratum. As recognized variances occur between the strata, stratified random sampling with well-adjusted allocation gives enhanced estimation devoid of bias. The chief advantage of stratified random sampling is that results are generally unbiased and precise. It frequently produces data that is more illustrative of the entire population due to the special attention it gives to the smaller subcategories within the population. Additionally, it provides the best avenue to get results that mirror the diversity of the population under study [49,50]. Stratified random sampling is more effective for large and diverse populations as pertained in Greater Kumasi.
LULCC detection appraisals have quite a lot of inferences contingent on the range and concentration of the researcher. However, the widely accepted fact about Change Detection use is its capacity to deliver data on changes in LULC including the magnitude, location and trajectory and the spatial dissemination of the change [50,51].
The LULCC maps for 1990 - 2000, 2000 - 2010 and 2010 - 2020 gives a great cause for concern in the light of climate change concerns. LULC changes of 141504.72ha (49.69%), 130354.25ha (45.77%), 138598.03ha (48.67%) for the respective epoch years had transpired transitioning mostly into other land use classes. Deforestation is prevalent outside of the protected areas whiles forest degradation is manifest in the protected areas as a result of logging (mostly illegal), illegal mining popularly called Galamsey and admitted agricultural activities. Cumulatively, urbanization is on rise as the population continues to rise. LULCC in this study is clearly caused by anthropogenic forces. These finding concur with earlier research undertaken [52-55].
Predicting the future land use changes
Forecasting LULC has become critical in land and resource management [54,56]. The consolidative and combinative model of cellular automata and Markov chain were employed to forecast the future LULC pattern of the study area for the year 2040.
The forecast for the period 2040 indicates the human built up class becoming the dominant LU in the study area. Mostly, the measurements display a growing trend in human-built environment, which is attributed to increasing human population [19]. The Ashanti Region as the center of the country with its rich natural resources and strategic location attracts migrants from different communities in Ghana and other nationals from West Africa and the continents.
Anthropogenic causes of the land use land cover trends
Greater Kumasi has undergone dramatic increase of built-up areas and agricultural intensification as revealed by the land cover change analyses. The sum of land cover change substantiates the trend and extent of urban growth resulting in sprawling unto the outskirts and additional densification in the inner parts as well. The upsurge of built-up and agriculture (mostly in the neighboring districts) have impacted negatively on forest cover and other open spaces. Essential service such as water supply from the Owabi and Barekese Headworks are under serious threat owing to wanton destruction of natural vegetation for human settlement and agricultural purposes [57]. The driver for deforestation and degradation is clearly anthropogenic in this study. The Ashanti Region has the largest population in Ghana and the fastest growing population [19]. The surge in population has direct consequence on the environment and the forests in particular. The rapid urbanization growth in study area is the consequence of natural increase in population, and migration [19]. Ghana’s population was 24,658,823 in 2010. 6,726,815 was recorded in 1960 and increased to 18,912,079 in 2000. Between 1960 and 2010, a period of fifty years, the population more than tripled. The Ashanti Region had the highest population in all the census years and most of the population in Ashanti Region resides in the urban centers [19]. The factors enumerated in Table 1 all apply in the study area. This unfortunate situation necessitates a quick and a well thought out plan to salvage what is left.
Conclusion
The application of GIS, remote sensing, and statistical simulations techniques has shown in this study to be a cost effective and potent means for monitoring spatial and temporal LULCC. The study revealed that, built up area grew astronomically (fivefold) at the expense of forest cover and Agriculture in the Greater Kumasi area within the 30years (1990 - 2020). Most of the forest cover within the study area are under strict protection. These protected forests include part of the Bobri Forest reserve, the Barekese Headworks and the Owabi Headworks reserves. Forests cover outside these protected reserves are mostly gone or heavily degraded. Water share of the LULC remained stable as the main water bodies within the study area which includes the Bosumtwi late and the two headworks (Barekese and Owabi) are important national assets and are thus protected. The 2040 projected LULC map of Greater Kumasi estimates 40% of the LULC being built up, which was at 5% in 1990. The results of this study is consistent with studies by Addae & Oppelt [58]; Akubia et al. [59] and Toure et al. [60] in Ghana.
LULC maps derived from satellite data in this study are not without errors. As Robinove [61] stated, computer produced maps via digital operation of multispectral data is never 100% precise. The procedure of categorizing a wide spectrum of the World’s landscapes into precise and frequently simplified categories brings error by delineating boundaries round geographically situated categories which are ‘homogeneous’ or suitably heterogeneous. Nevertheless, these limitations are rectified by comprehensive statistical scrutiny to give reasonably correct LULC maps [62].
References
- Muhati GL, Olago D, Olaka L (2018) Land use and land cover changes in a sub-humid montane forest in an arid setting: a case study of the Marsabit forest reserve in northern Kenya. Global Ecology and Conservation 16: e00512.
- Qi W, Li H, Zhang Q, Zhang K (2019) Forest restoration efforts drive changes in land-use/land-cover and water-related ecosystem services in China’s Han River basin. Ecological Engineering 126: 64-73.
- Shawul AA, Chakma S (2019) Spatiotemporal detection of land use/land cover change in the large basin using integrated approaches of remote sensing and GIS in the Upper Awash basin, Ethiopia. Environmental Earth Sciences 78(141).
- Nguyen AT, Hens L (2019) Human ecology of climate change hazards in Vietnam. Cham, Switzerland: Springer International Publishing.
- Tattu SP (2016) Study on the Coastal Vegetation and Land-use Changes of the Coastal Talukas of Bharuch District (Doctoral dissertation, Maharaja Sayajirao University of Baroda (India).
- Gashu K, Gebre-Egziabher T (2018) Spatiotemporal trends of urban land use/land cover and green infrastructure change in two Ethiopian cities: Bahir Dar and Hawassa. Environmental Systems Research 7(8).
- Deka J, Tripathi OP, Khan ML, Srivastava VK (2019) Study on land-use and land-cover change dynamics in Eastern Arunachal Pradesh, NE India using remote sensing and GIS. Tropical Ecology 60(2): 199-208.
- Kagombe J, Kiama S, Kungu J (2020) Land cover mapping and change analysis in tropical humid-highlands: Case of Ndakaini water reservoir in Central Kenya.
- Gatsi JG, Appiah MO (2020) Population growth, income growth and savings in Ghana. Journal of Economics and Development 22(2).
- Abass K, Afriyie K, Gyasi RM (2019) From green to grey: the dynamics of land use/land cover change in urban Ghana. Landscape Research 44(8): 909-921.
- Abass K, Adanu SK, Agyemang S (2018) Peri-urbanisation and loss of arable land in Kumasi Metropolis in three decades: Evidence from remote sensing image analysis. Land Use Policy 72: 470-479.
- Quartey JD (2013) An Economic Assessment of the Deforestation of Ghana’s Garden City of West Africa. In: Simpson R, Zimmermann M (Eds.), The Economy of Green Cities. Local Sustainability, vol 3, Springer, Dordrecht, pp. 351-362.
- Khatami R, Mountrakis G, Stehman SV (2016) A meta-analysis of remote sensing research on supervised pixel-based land-cover image classification processes: General guidelines for practitioners and future research. Remote Sensing of Environment 177: 89-100.
- Liang S, Wang J (2019) Advanced remote sensing: terrestrial information extraction and applications. Academic Press.
- Mas JF (1999) Monitoring land-cover changes: A comparison of change detection techniques. International Journal of Remote Sensing 20(1): 139-152.
- Singh SK, Srivastava PK, Szabó S, Petropoulos GP, Gupta M, et al. (2017) Landscape transform and spatial metrics for mapping spatiotemporal land cover dynamics using Earth Observation data-sets. Geocarto international 32(2): 113-127.
- Li Y, Sulla-Menashe D, Motesharrei S, Song XP, Kalnay E, et al. (2017) Inconsistent estimates of forest cover change in China between 2000 and 2013 from multiple datasets: differences in parameters, spatial resolution, and definitions. Scientific reports 7(8748): 1-12.
- Warner TA, Skowronski NS, Gallagher MR (2017) High spatial resolution burn severity mapping of the New Jersey Pine Barrens with WorldView-3 near-infrared and shortwave infrared imagery. International Journal of Remote Sensing 38(2): 598-616.
- GSS (2013) 2010 Population and Housing census National analytical report. Accra, Ghana, pp. 1-430.
- Jones WB, Bacon M, Hastings DA (1981) The Lake Bosumtwi impact crater, Ghana. Geological Society of America Bulletin 92(6): 342-349.
- Parsa VA, Yavari A, Nejadi A (2016) Spatio-temporal analysis of land use/land cover pattern changes in Arasbaran Biosphere Reserve: Iran. Modeling Earth Systems and Environment 2(4): 1-13.
- Lillesand T, Kiefer R (1999) Remote sensing and image interpretation. New York: Wiley.
- Anderson R, Hardy E, Roach J, Witmer R (1976) A land use and land cover classification system for use with remote sensor data, Sioux Falls, USA. USGS professional paper, vol. 964.
- Naghibi F, Delavar MR, Pijanowski B (2016) Urban growth modeling using cellular automata with multi-temporal remote sensing images calibrated by the artificial bee colony optimization algorithm. Sensors 16(12): 2122.
- Verburg PH, Schot PP, Dijst MJ, Veldkamp A (2004) Land use change modeling: Current practice and research priorities. Geo Journal 61: 309-324.
- Feng Y, Liu Y, Tong X, Liu M, Deng S (2011) Modeling dynamic urban growth using cellular automata and particle swarm optimization rules. Lands Urban Plan 102: 188-196.
- Yang Q, Li X, Shi X (2008) Cellular automata for simulating land use changes based on support vector machines. Comput Geosci 34(6): 592-602.
- Veldkamp A, Lambin EF (2001) Predicting land-use change. Agric Ecosyst Environ 85(1-3): 1-6.
- Turner BL, Lambin EF, Reenberg A (2007) The emergence of land change science for global environmental change and sustainability. Proc Natl Acad Sci USA 104(52): 20666-20671.
- Wu F (2002) Calibration of stochastic cellular automata: The application to rural-urban land conversions. Int J Geogr Inf Sci 16(8): 795-818.
- Chen Y, Li X, Liu X, Ai B (2014) Modeling urban land-use dynamics in a fast developing city using the modified logistic cellular automaton with a patch-based simulation strategy. Int J Geogr Inf Sci 28(2): 234-255.
- Yeh AGO, Li X (2004) Errors and uncertainties in urban cellular automata. Comput Environ Urban Sys 30: 10-28.
- Foody GM (2002) Status of land cover classification accuracy assessment. Remote Sensing of Environment 80(1): 185-201.
- Behera MD, Borate SN, Panda SN, Behera PR, Roy PS (2012) Modelling and analyzing the watershed dynamics using Cellular Automata (CA)–Markov model–A geo-information based approach. Journal of Earth System Science 121(4): 1011-1024.
- FPP-PASCO-FC Report (2013) Mapping of Forest Cover and Carbon Stock in Ghana – Pilot study which covered the SECOND and THIRD TIERS recommended in the Good Practice Guidelines of the Intergovernmental Panel on Climate Change (IPCCGPG) for REDD+ planning.
- Pontius RG, Millones M (2011) Death to Kappa: birth of quantity disagreement and allocation disagreement for accuracy assessment. International Journal of Remote Sensing 32(15): 4407-4429.
- Arsanjani JJ, Helbich M, Kainz W, Boloorani AD (2013) Integration of logistic regression, Markov chain and cellular automata models to simulate urban expansion. International Journal of Applied Earth Observation and Geoinformation 21: 265-275.
- Monserud RA, Leamans R (1992) Comparing global vegetation maps with the kappa statistic. Ecological Modelling 62(4): 275-293.
- Cheruto MC, Kauti MK, Kisangau DP, Kariuki PC (2016) Assessment of land use and land cover change using GIS and remote sensing techniques: A case study of Makueni County, Kenya.
- Bellón B, Bégué A, Lo Seen D, De Almeida CA, Simões M (2017) A remote sensing approach for regional-scale mapping of agricultural land-use systems based on NDVI time series. Remote Sensing 9(6): 600.
- Khairullina ER, Bogdanova VI, Slepneva EV, Nizamutdinova GF, Fatkhullina LR, et al. (2019) Global climate change: cyclical nature of natural and permanent nature of man-made processes. Eur Asian Journal of BioSciences 13(2): 2311-2316.
- Nagy L, Artaxo P, Forsberg BR (2016) Interactions between biosphere, atmosphere, and human land use in the Amazon basin: an introduction. In Interactions Between Biosphere, Atmosphere and Human Land Use in the Amazon Basin. Springer, Berlin, Heidelberg, 3-15.
- Nampak H, Pradhan B, Mojaddadi Rizeei H, Park HJ (2018) Assessment of land cover and land use change impact on soil loss in a tropical catchment by using multitemporal SPOT‐5 satellite images and Revised Universal Soil Loss Equation model. Land degradation & development 29(10): 3440-3455.
- Cerbaro M, Morse S, Murphy R, Lynch J, Griffiths G (2020) Information from Earth Observation for the Management of Sustainable Land Use and Land Cover in Brazil: An Analysis of User Needs. Sustainability 12(2): 489.
- Maselli F, Chiesi M, Pieri M (2019) A new method to enhance the spatial features of multitemporal NDVI image series. IEEE Transactions on Geoscience and Remote Sensing 57(7): 4967-4979.
- Domeneghetti A, Tarpanelli A, Grimaldi L, Brath A, Schumann G (2018) Flow duration curve from satellite: potential of a lifetime SWOT mission. Remote Sensing 10(7): 1107.
- Stead D, Donati D, Wolter A, Sturzenegger M (2019) Application of Remote Sensing to the Investigation of Rock Slopes: Experience Gained and Lessons Learned. ISPRS International Journal of Geo-Information 8(7): 296.
- Hakeem KA, Abirami S, Rao VV, Diwakar PG, Dadhwal VK (2018) Updated inventory of Glacial Lakes in Teesta Basin using remote sensing data for use in GLOF risk assessment. Journal of the Indian Society of Remote Sensing 46(3): 463-470.
- Snedecor GW, Cochran WG (1989) Statistical Methods, Eighth Edition, Iowa State University Press.
- Ma L, Li M, Gao Y, Chen T, Ma X, et al. (2017) A novel wrapper approach for feature selection in object-based image classification using polygon-based cross-validation. IEEE Geoscience and Remote Sensing Letters 14(3): 409-413.
- Zhao K, Wulder MA, Hu T, Bright R, Wu Q. et al. (2019) Detecting change-point, trend, and seasonality in satellite time series data to track abrupt changes and nonlinear dynamics: a Bayesian ensemble algorithm. Remote sensing of Environment 232: 111181.
- Koranteng A, Niedzwiecki TZ (2015) Modelling forest loss and other land use change dynamics in Ashanti Region of Ghana. Folia Forestalia Polonica 57(2): 96-111.
- Yeboah F, Awotwi A, Forkuo EK, Kumi M (2017). Assessing the land use and land cover changes due to urban growth in Accra, Ghana. Journal of Basic and Applied Research International 22(2): 43-50.
- Awotwi A, Anornu GK, Ballard JAQ, Annor T (2018) Monitoring land use and land cover changes due to extensive gold mining, urban expansion, and agriculture in the Pra River Basin of Ghana, 1986–2025. Land degradation & development 29(10): 3331-3343.
- Obodai J, Adjei KA, Odai SN, Lumor M (2019) Land use/land cover dynamics using landsat data in a gold mining basin-the Ankobra, Ghana. Remote Sensing Applications: Society and Environment 13: 247-256.
- Anand J, Gosain AK, Khosa R (2018) Prediction of land use changes based on Land Change Modeler and attribution of changes in the water balance of Ganga basin to land use change using the SWAT model. Science of the Total Environment 644: 503-519.
- Koranteng A, Niedźwiecki TZ (2014) Anthropogenic Pressure on Barekese and Owabi HeadworksIn Ashanti Region, Ghana. In: Management of Environmental Protection in Forests, Tuchola. Tom VIII (ISSN 2081-1438), pp. 118-125.
- Addae B, Oppelt N (2019) Land-use/land-cover change analysis and urban growth modelling in the Greater Accra Metropolitan Area (GAMA), Ghana. Urban Science 3(1): 26.
- Akubia JE, Ahmed A, Bruns A (2020) Assessing How Land-Cover Change Associated with Urbanisation Affects Ecological Sustainability in the Greater Accra Metropolitan Area, Ghana. Land 9(6): 182.
- Toure SI, Stow DA, Clarke K, Weeks J (2020) Patterns of land cover and land use change within the two major metropolitan areas of Ghana. Geocarto International 35(2): 209-223.
- Robinove CJ (1986) Principles of Logic and the Use of Digital Geographic Information Systems. U.S. Geological Survey Professional Paper No. 977. U.S. Gov. Printing Office, Washington, D.C. p. 19.
- Eastman JR (2012) DRISI Selva Manual; Clark University: Worcester, MA, USA.


