An Assessment of the Spatio Temporal Dynamics of Potable Water Delivery for Water Resource Management on the South Eastern Flank of Mount Cameroon
Usongo P Ajonina* and Briyan Aligenui
Department of Geography,University of Buea, Cameroon
Submission: June 1, 2021; Published: June 17, 2021
*Corresponding author: Usongo P Ajonina, Department of Geography, P.O Box 63, University of Buea, Cameroon
How to cite this article: Usongo P A, Briyan A. An Assessment of the Spatio Temporal Dynamics of Potable Water Delivery for Water Resource Management on the South Eastern Flank of Mount Cameroon. Int J Environ Sci Nat Res. 2021; 28(3): 556236. DOI: 10.19080/IJESNR.2021.28.556236
Abstract
Potable water delivery, an important ecosystem service of Mount Cameroon is under threat in Buea and its environs. The study was aimed at analysing the dynamics of water quality and quantity parameters from 3 streams (Wolikakwo. Koke, Ndongo) within the Mt Cameroon watershed at three points (source point, human habitation upstream and human habitation downstream) during the dry and rainy season. The water quality index (WQI) computed from eleven parameters using the Weighted Arithmetic Index was employed to determine the water quality. Water samples were collected from the field and analyzed at the IRA Laboratory in Yaounde. Water depth, width, velocity and discharge measured using the flow meter and tri-meter were used to assess water quantity parameters. The ANOVA and Independent Sample Tests were used to investigate whether there were significant spatial-temporal variations of water quality and quantity parameters tested. The WHO standard was used to compare the values of the water quality parameters tested. The study revealed no seasonal variations in water quality parameters and a significant spatial variation of EC (µs/ml), Ca2+(mg/l), TDS (mg/l) within Wolikakwo stream. With the exception of Cl – (mg/l), no significant seasonal difference was observed within Koke stream. Spatially, K+, TDS (µs/cm), coliform count varied significantly. Within Ndongo stream, Temp (0c), Coliform counts (m/l), NO3- (mg/l), Ca2+ (mg/l) recorded significant seasonal variations while discharge over space varied significantly. Results of the WQI showed that the water at all sampling points for all the streams was not suitable for consumption and none was in accordance with the WHO standard. The study concluded that portable water delivery is under threat due to the encroachment of human activities. To ensure a sustainable water delivery a watershed management board should be created to oversee stream protection and portable water delivery to local communities.
Keywords: Mount cameroon; Portable water delivery; Water quality parameters; Water quantity parameters; Water quality index (WQI)
Introduction
The Ecosystem has potentials to supply a range of services that are of fundamental importance to human well-being, health, livelihoods, and survival [1]. Ecosystem services (ES) are the benefits people obtain from ecosystems, directly and indirectly, contributing to human well-being [2]. The Millennium Ecosystem Assessment [2]. categorized ecosystem services into four types: provisioning, regulating, cultural and supporting services. The provisioning services are products obtained from the ecosystem and water is one of them. An increase in the world’s population and rapid developmental activities has brought water delivery within most ecosystems under threat and humans play a vital role in water quality and quantity determination.
Mountain ecosystems provide a vast array of goods and services to humanity, both to people living in the mountains and to people living outside mountains [2,3], Mountain regions are often good water catchments locations because they possess water holding abilities and releasing rocks in most cases coupled with the vegetation. These areas often act as delivering spots in which water is released to the surface. Water delivery from the source is pure but experience changes in quality and quantity as it flows over space. Despite the importance of water for life, the quality and quantity of water resources have been rapidly impaired by human land use in the last decades [4].
Mt Cameroon, the highest mountain in West Africa provides valuable ecosystem services such as watershed protection giving rise to several rivers and streams in the area. In third world countries, water scarcity within the municipal, industrial and agricultural sectors have increased food insecurity, health problems and poverty. Therefore, thoroughly addressing issues that could result in water deficiency would contribute to achieving the Millennium Development Goals (MDGs). Good quality and quantity of water is supplied from the watershed, but due to an increase in human activities significant alteration resulting in degradation in water parameters are bound to occur. This is fostered through intensified agriculture and increased domestic uses among others. Human occupancy and activities have changed the chemical, physical and biological properties of water. The disparities in water parameters can be observed on a seasonal basis as human activities are also dynamic with seasonal change.
During the past decade Buea has been suffering from an acute water crisis. However, the fact remains that Buea is blessed with abundant water resources. The failure to effectively manage and harness this vital ecosystem provisioning service has resulted in indiscriminately spatiotemporal depletion in water quality and quantity parameters leading to fresh and portable water shortages Also, there is an underestimation of the role played by the mount Cameroon ecosystem in water purification and supply resulting to no appropriate creditability being accorded to the Mt ecosystem for such essential services. According to [5] about 70% of local communities are not mindful of the significant role the mountain ecosystem plays in providing water. The gradual depreciation of water provision within the Southeastern flank of mount Cameroon has been highly visible as compared to the Northeastern flank of Bafia-Muyuka. Although access to safe and reliable water delivery service is a global challenge, it is particularly acute in developing countries [6]. This is the situation in Buea municipality where the population is faced with severe irregular, unreliable and intermittent drinking water supply characterized by water rationing with some areas going for weeks and months with no water at a time when water is necessary in the fight against COVID 19. Reduction in source water delivery flow and increased water demand due to the high population growth and urbanization have been blamed to the growing water supply crisis. Inspired by this growing crisis of inadequate and unreliable water supply in Buea and considering the fact that both water quality and quantity are to a large extent dependent on the state of source water delivery, this research, therefore, seeks to identify human activities along stream courses; investigate the spatio-temporal dynamics of water quality and quantity parameters as a provisioning ecosystem service within the Mount Cameroon watershed, compare the water parameters with the WHO drinking water standards in order to evaluate the current state of the mountain towards water provisioning and to propose policy recommendations that can be put in place to ensure the continuous supply of portable water in the area.
Materials and Methods
Study area
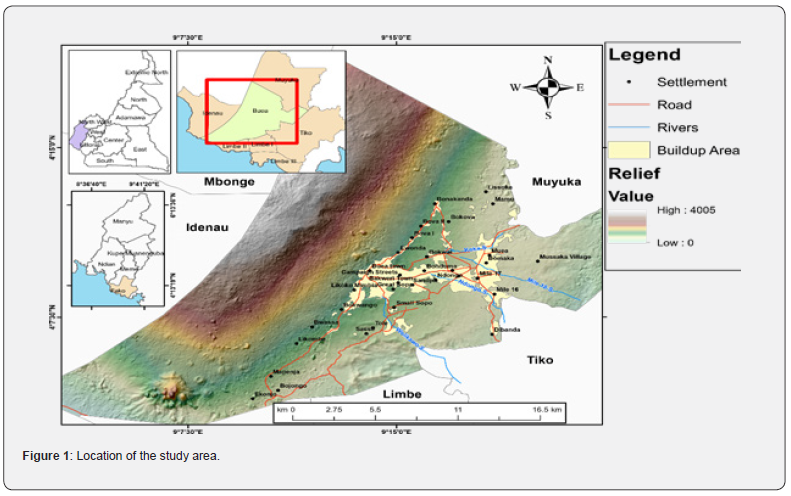
Mount Cameroon is located between 3°57'- 4°27' N and 8°58'-9°24'E (Figure 1). It is a huge volcanic mass with a long axis (about 45km long and 30km wide) running SW to NE. The highest uplift in West and Central Africa with a peak just about 20km inland from the Atlantic coastline. It is an active volcano. The last eruption occurred in 1999, which probably continued and led to minor tremors and lava flows in 2000 [7]. Climatically, Mt Cameroon is influenced by the uplift nature giving it a distinct seasonal pattern of rainfall and temperature related to the north-south movement of the Inter-tropical Convergence Zone (ITCZ). Mean annual rainfall decreases with altitude to approximately 4,000mm at 1000m and to less than 3,000mm above 2,000m [8]. The temperature decreases with increasing elevation. For each 100m ascent, the average temperature drops by about 0.6°C. Observing the humidity, it remains at 75-85% due to the marine influence and the incidence of mist and orographic cloud formation. Despite of the abundant precipitation, the Mt Cameroon area is characterized by a dense hydrological network with several rivers, seasonal and permanent streams, springs, lakes and waterfalls. There are no permanent rivers/streams at the upper slopes of the mountain.
Most of the rivers, and streams are found at the lower slopes of the mountain about 700m above sea level. Very few catchments are located within the forested region of the Mountain except for few brooks [9]. Streams flow from some catchments and go underground thereafter they resurface some few km below the foot of the Mt as resurgent streams. This Explains why our stream of interest are found from about 500-1000masl. Thick green forest occupies the southernmost section and a succession of savanna vegetal formation with shrubs are found above 200meters. The tropical climate makes it possible for the tress to be green throughout the year. Vegetation plays a significant role in water purification. Climate, geology and vegetation are multiple factors that sustain the drainage of this region. These factors combine to create diverse water types that change spatially and temporally. The quality assessment shows that, in general, the spring waters are suitable for drinking and domestic uses and are commercialized by bottling companies such as Supermont and Seme [9].
Criteria for site and streams selection
The Mount Cameroon Region was chosen for the study because it is an important watershed not only in Buea municipality but in Fako Division where most of the streams in the area take their rise and flow into the Atlantic Ocean.
The streams selected for the study are: Ndongo, Koke and Woklikawo. The criteria used for their selection were; proximity to human influences, population density, dependence on stream use and the flow pattern of the streams for easy monitoring. Firstly, these streams have the highest proximity to human influences, especially around Molyko, Koke and Small Soppo (Wolikawo). These areas have a dense population around the streams and settlements are highly concentrated along these streams. There is high dependence on the streams for domestic and agricultural uses in these areas. The 3 streams flow on a permanent basis that is during both the rainy season and dry season. Due to the yearly discharge of these streams, the study there was the possibility to measure stream discharge and water quality parameters on a seasonal basis.
Collection of water samples
Water samples from the respective streams were collected from 3 different points: the source, at the point of encroachment of human activities and further downstream. A Global Positioning System (GPS) was used to take the location of the sampling sites. The source point acted as the control because there is little or no interference and the other two sites served as the treatments. Water samples were collected using sing sterilized 500ml glass bottles rinsed with distilled water and dried thereafter. At the collection sites, these bottles were rinsed to eliminate foreign water in the containers. Each sample was codified and transported in an ice-cool container to the laboratory within 24 hours for analysis of parameters that could not be measured on the field. Four water samples were collected from each point for the 3 streams both during the rainy and dry seasons and analyzed for selected physio-chemical properties relevant to the study.
Water quantity measurement
The velocity of discharge within the streams was measured at three different points along all the streams: the source, at the point of encroachment of human activities and further downstream. This was done by the flow meter method which involves measuring the surface velocity of the water using a flow meter and then multiplying this velocity to the width and average depth of the channel. The following tools were used: a tape measure, yard or meter stick to measure depth, flow meter, tri-meter, stakes for anchoring the tape to channel banks pen and recording sheets. Human activities along the stream courses were also identified to in order to explain the variation of water parameters observed.
Water quantity analysis
The calculations for water quantity was as follows: firstly, the cross-sectional area was obtained by measuring the bank to bank distance and the average depth with the aid of a measurement stick placed across the stream at right angles to stream flow. Secondly, the depth was measured using a measuring stick. This was measured at 4 equal distances and each value-added and divided by 4 to get the average depth.
The cross-section area (A) was calculated as width × depth. The stream flow meter was submerged some few cm into the water. Measurements were recorded using a gauge. This was done 4 times to get the average speed denoted as:
Volume m3/s Q = A×V
Where, A= area of the cross-section in m2. (A=Channel width× Channel Depth)
V=Average Velocity (value obtained from the flow meter).
Calculation of water quality index
WQI was used for the detection and evaluation of water pollution and defined as a reflection of the composite influence of different quality parameters on the overall quality of water [10]. It is a summarization of all water quality parameters into a single value. The calculation was done based on the summarization of the parameters tested using the Horton’s method as thus;

Where, qn = Quality rating of nth water quality parameter.
Wn= Unit weight of nth water quality parameter.
Quality rating (qn)
The quality rating (qn) is calculated using the expression given in
Equation (2).

Where,
Vn = Estimated value of nth water quality parameter at a given sample location.
Vid = Ideal value for nth parameter in pure water.
(Vid for pH = 7 and 0 for all other parameters)
Sn= Standard permissible value of nth water quality parameter
Unit weight
The unit weight (Wn) is calculated using the expression given in the equation below

Where,
Sn = Standard permissible value of nth water quality parameter.
k = Constant of proportionality and it is calculated by using the
Expression given in Equation

The ranges and corresponding status of water quality and their possible uses are summarized on Table 1.

Statistical analysis
Data collected were entered using the EpiData Version 3.1 and analyzed using the Statistical Package for Social Sciences (SPSS) Standard version, Release 21.0 (IBM Inc. 2012). One-way ANOVA and independent sample test were performed to investigate whether there are significant variations of water quality and quantity parameters tested between the various sampling points (spatial variations) and the seasons (temporal variations). This was followed by multiple comparisons to further separate significant levels if overall significant treatment differences exist. To carry out this analysis, a table showing the water quality and quantity parameters at different sampling points during both the dry and the rainy season was generated for the analysis and verified at 0.05% level of significance. To test the difference between water parameters tested and the WHO water quality standard for drinking water, [12] standard for drinking water quality was used to match standards against actual measures gotten from the field. The Standard deviation was used to compare the tested parameter and WHO Standard. and the results were verified at 0.05% level of significance.
Results and Discussion
Identification of human activities along stream courses
Man is an integral part of the ecosystem and land use changes and urbanization processes will continue to have negative impacts on water quality and quantity at all scales. The impact of human activities on water quality and quantity is generally studied to investigate the relationships between land use and water quality and quantity indicators [13]. The 3 streams selected are found at the urban setting of Buea municipality and flow through human habitation. By default, they attract usage by the recipient population. Water is of great importance to human civilization and these streams under study are noted for being used for drinking, cooking, washing, quarry, irrigation, car wash and machine cooling.
Farming and irrigation
Though Buea is not noted for intense agro practices, farming activities serve as a backup for food production for most homes. Within Wolikawo and the surrounding villages the predominant economic activity is farming. Output from farming is mainly for subsistence though some may be channeled to the local market. Major crops cultivated around Wolikawo stream include maize, potatoes, plantain, beans, tubers and more. Koke and Ndongo are found at the center of the Buea Municipality and are famous for market gardening practices (Figure 2). Gardening crops such as tomatoes, cucumber, vegetable etc are cultivated. Irrigation is a common practice in the areas. Though there are no major irrigation techniques along the streams, farmers make use of furrow, sprinkler and manual irrigation (bucket watering) especially around human habitation upstream and downstream resulting to water quantity reduction.
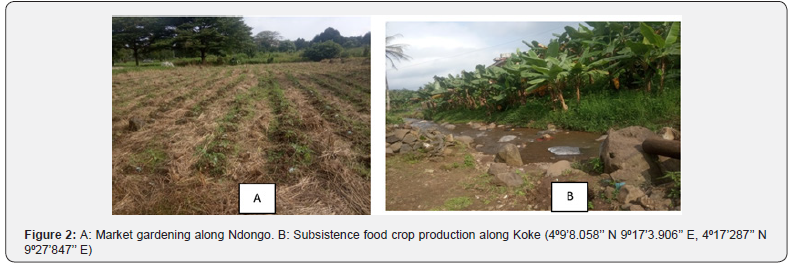
Farming activities make use of chemical fertilizers which are washed by runoff into streams. Intense farming also makes the soil susceptible to erosion which is washed into the stream channel along Ndongo neighborhood, UB, Dirty South and Mile 16. Irrigation is greatly related to water quantity reduction.
Fishing
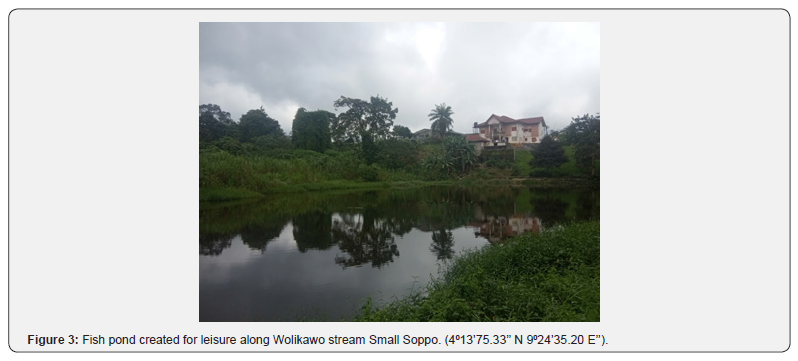
Fresh water is a perfect habitat for aquatic life with perfect chemical composition creating a comfortable and suitable atmosphere for fish and aquatic life. It may sound surprising to have a fish pond within the streams but from findings and observations done on the field it was discovered that within Wolikawo stream there is a personal fish pond (Figure 3). Mud fish is nursed here and later harvested for domestic use and sale. The fish pond has an impact on water quality and quantity parameters.
Domestic activities
Water is a very important resource to human development and civilization and has improved the livelihoods of many communities. Water delivery has facilitated domestic activities. Laundries, washing of dishes, bathing are common within these streams. Dirt from clothes, soap and other detergents are contagion to fresh water. Those residing close to the stream use the flowing water for these activities. According to research carried within Ndongo, Nkwelle (2010) stated that laundry constituted (13.77%) and bathing (06.09%). Even though livelihood is facilitated there is an impact on water quality and quantity.
Quarry activities
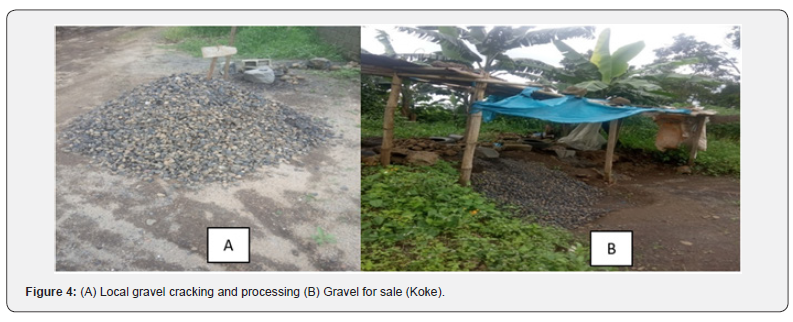
Quarrying is a widespread technique for acquiring construction material. Stream capacity and competence to transport sedimentdown slope becomes very advantageous to quarrying activities. This process of sediment deposition in the ever-changing streams environment separate grains according to density, size, and shape. Sand and gravel are among the minerals found along these water courses especially around downstream Koke (Figure 4). Quarry activities are widely practiced at Small Soppo along Wolikawo and downstream areas of Koke. The implications could be farfetched as during mining the turbidity is affected and this widens the channels and reduces velocity at some points (Barnes, 1999).
Constructions
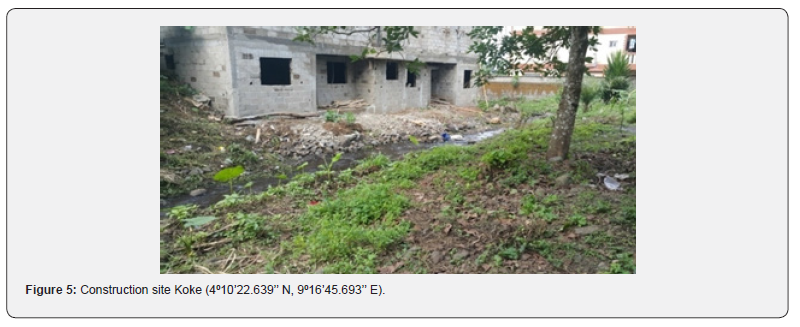
Proximity to fresh water has placed residential land along the rivers on high demand. Construction demands high amount of water for an easy building process. According to [14]. developed lands release pollutants especially during the construction and post construction phases. Construction activities are very common along these streams (Figure 5). The post construction actions depreciate the quality as well as the quantity, through pollutant deposited and water extraction respectively. According to [15] sediments and muddy water are popularly among the most common construction pollutants of streams and lakes.
Car wash and machine cooling
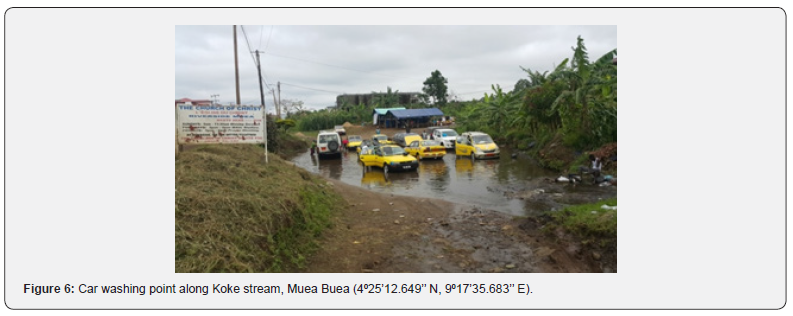
Car wash and machine cooling is detrimental to stream quality with successive addition of effluents from wastewater resulting from car washing points. Car-wash involves the use of detergents, kerosene, petrol and diesel [16]. Large quantities of wastewater are released containing left over detergents and hydrocarbons. Koke stream which flows to Muea is a perfect example of a very popular car wash center in Buea (Figure 6). WoliKawo is also noted for car washing and machine cooling and within Ndongo, car washing points are found spotted along the water course.
Dump sites
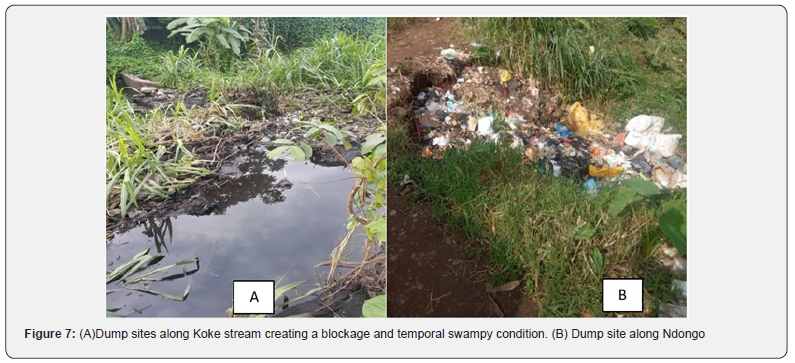
Due to the scarcity of well-constructed landfills and inconsistency in the sanitary sector within Buea municipality, running streams and rivers have become very effective and flexible method of solid and liquid waste disposal. Discrediting urbanization encroachment, the consumption habits of the population has increased tremendously and waste production is evident within most urban areas. Municipal wastes from domestic dwellings, agricultural operations and commercial establishments are unarguably accompanied with contagion compounds which are detrimental to the potability and usability of streams (Figure 7). In some countries waste dumping is considered illegal and a punishable act. In the case of Cameroon nothing is done to stop this. Associated with health effects, the United Nations reports on developing countries [17] concluded that, unsanitary environment and poor disposal of solid and liquid wastes and inadequate hygienic establishment are still major causes for the prevalence of infectious disease. Ndongo stream is the most disturbed stream that has witnessed blockage of some flow channels and creating temporary swampy conditions which hampering movement of people within the neighborhood.
Spatio-temporal dynamics of water quality parameters
Physio-chemical and biological parameters are fragile components of water and are bound to change when interrupted either by anthropogenic or natural actors.
The temperature was higher during the rainy season compared to the dry season though not significant as the average temperature along the streams was 230C with Koke recording the lowest temperature of 200C at the source point. Koke was observed as the most visited stream for drinking and other domestic activities. Within Koke stream the average dry season temperature was 24.333±1.7638°C which was similar to 24.833±2.6194°C during the rainy season but not statistically significant (Table 2). Koke is well noted for its low atmospheric temperature which has a direct influence on the water temperature (Figure 8). Water temperature also vary spatially with the source point recording the lowest value and HDS the highest value. Water at the source point recorded an average water temperature of 20.500±.5000°C, Human habitation upstream had a value of 25.250±0.2500°C and human habitation downstream was slightly higher at 28.000±1.0000°C. Results revealed a significant difference in temperature over space (P<0.05) (Table 3). This finding coincides with that of [18] who established that Koke is the coldest running water within the Buea Municipality. Exposure and shade are among the factors that affect the temperature of a water body [19].
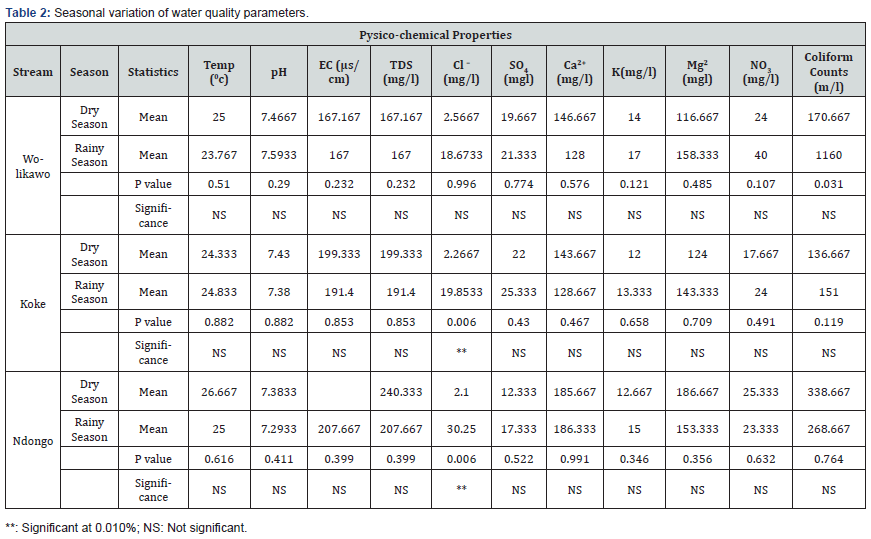
The pH shows a fluctuating trend. Walikawo recorded an average pH of 7.4667±.07513 during the dry season and was similar to the rainy season value of 7.5933±0.03930. The values within Koke were 7.2933±.09563 for the dry season and 7.3833±0.04619 for the rainy season samples and Ndongo, recorded a pH value of 7.2933±.09563 for the dry season and 7.3833±0.04619 for the rainy season. Spatially pH values were higher at HDS. Wolikawo stream recorded an average value of 7.2650±.05500 at the source point just slightly lower than that of human habitation upstream with a value of 7.3250±.07500, while human habitation downstream had an average of 7.4250±.11500. This is in line with the work of [20] who observed variation in pH over space largely due to agricultural activities.
Electrical Conductivity (EC) values were higher during the dry season. EC values within Wolikawo stream recorded an average of 167.167±22.0876 (µs/cm) and 167.000±25.0150 (µs/cm) for the dry and rainy season respectively. A progressive increase was observed from the source point through HUD. A significant spatial variation was observed within Wolikawo and Koke. EC indicates the presence of municipal waste from domestic dwellings, agricultural activities and might results to adverse health effects when consumed.
The TDS which is related to the organic and inorganic materials in water increased with distance from the source and results revealed a significant spatial variation within Wolikawo and Koke streams. The observed high values are clear indications of the influence of human activities such as agriculture, car wash and building and construction common in the area. [21] also revealed similar findings and suggested that contaminants from agricultural operations and household waste contributed to the successive increase of TDS from the source point to areas of human habitation. However, the major ions contributing to TDS are calcium, magnesium, sodium, potassium, carbonate, bicarbonate, chloride, fluoride, sulfate, and nitrate. According to [22] variation in TDS may be related to land use and pollution. Chloride (Cl-) values were higher during the rainy season compared to the dry season (Figure 8). Results revealed a progressive increase from the source to HUD due to the intensity of human activities over space.
Sulphate (SO42-) concentration showed no variation between the rainy and the dry season values. Spatially, results revealed an increase concentration from the source point. This finding is not in line with [23] who established a contrary opinion of sulphate concentration over space. Similar pattern was observed spatially along each point.
Though the mean values of the cations were higher during the dry season, no significant seasonal variations were observed (Tables 2 & 3). Variation over space revealed a significant spatial variation in calcium (Ca2+) values within Wolikawo and Ndongo. Changes observed on the parameters within each stream is related directly to the degree of human activities. Variation in K+ levels over space was significant within Koke largely due to the intensive cultivation of vegetables in the area [21], enumerated agro-activities as the prime catalyst for K+ changes. Magnesium Mg2+ (mg/l) showed an increase in concentration from the source point to areas of human habitation due to the numerous domestic and agro activities along the stream channels. This additional concentration influences the potability of the water and is detrimental to the human system if consumed. Stanislav [24] oncurred to this conclusion and established an irrefutable framework between Mg2+ and Human health system.
Nitrate concentration was higher during the rainy season compared to the dry season and increased progressively from the source point (Figure 9). A significant spatial variation in NO3 levels was observed only for Ndongo (Table 3). Tole Tea estate is a major influence of this parameter, while other small agricultural ventures along the other streams contributed to the little margin of variation. The higher NO3-concentration obtained agrees with the finding of [25] who also reported higher NO3 level in the area from chemical fertilizer application along the Tole Tea Slopes.
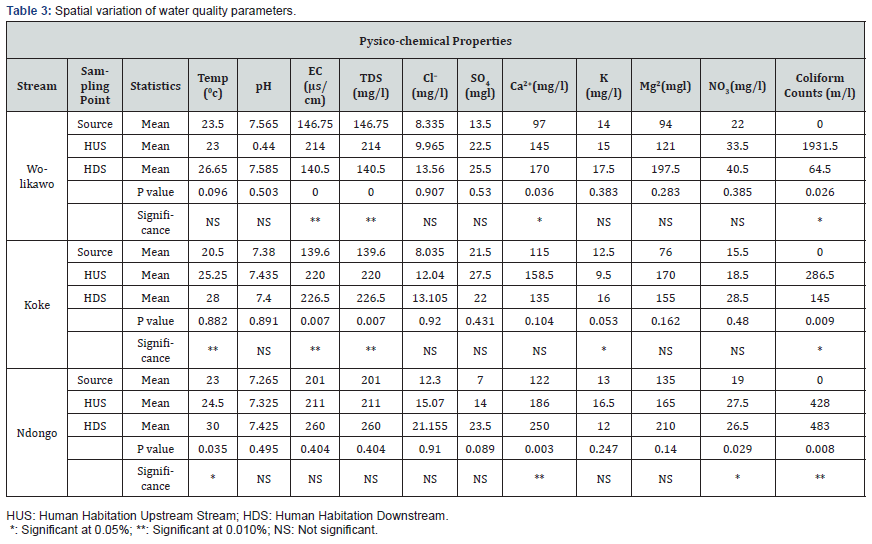
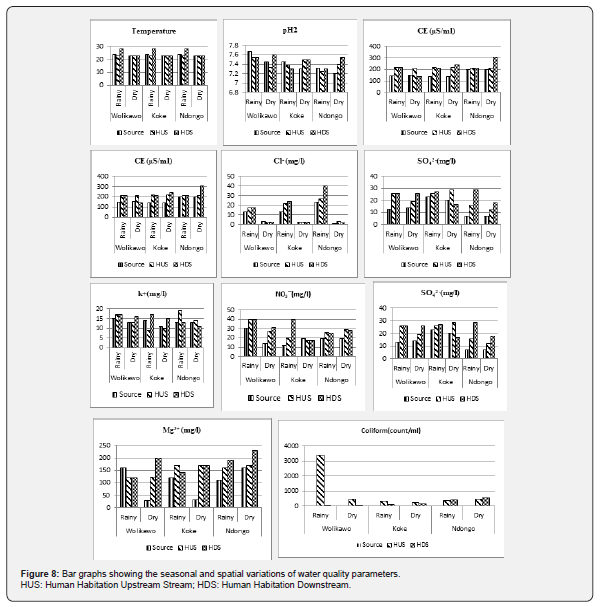
It was also found that coliform counts were zero at the source points both during the dry and rainy seasons but their numbers increased with human influence. This remarkable change was however not progressive as some areas witnessed massive increase in coli form concentration. Wolikawo HDS recorded over 3403 counts/ml due to a high concentration of domestic activities in the area such as swimming, bathing, dish washing among others. Water quality parameters within the three streams experienced some of variations over space and time. On a seasonal basis, no significant statistical variation was recorded (Table 2) but for chloride which was significant (P<0.05). No significant seasonal variations were observed for water temperature, pH, electrical conductivity, calcium, magnesium, and potassium, TDS, nitrates, phosphates and coliform counts. Spatial variability across sampling points showed no significant spatial variation in water quality parameters for pH, electrical conductivity, phosphates, chloride, potassium, TDS and coliform counts. Significant spatial variation of water quality parameters was observed for temperature, sulphates, calcium and magnesium. The urban stream syndrome is responsible for the spatiotemporal variations of water quality parameters observed in the area. The urban stream syndrome, [26,27] is mostly characterized by very high peak flows, resulting from dramatic increases in runoff, as a result of increasing impervious surface covers (ISC) in urban catchments causing significant physical chemical and biological in urban streams quality [23] With rapid urban development, streams attract multitude of stressor independent of the stream size and length [28] thereby affecting water quality parameters. The findings in the area in line with the work [29] who highlighted that human threats (rapidly growing population, urbanization, agricultural, industrial and mining activities) on water ecosystem service in South Africa, pose a threat to availability, accessibility and quality of potable water resources in the country.
Spatio-temporal dynamics of water quantity parameters
The volume of water from the catchment is directly proportionate to the water table level. However, in the course of flowing the source to areas of human habitation, some hydro climatic and anthropogenic agents set in resulting to a gradual change in water quantity parameters such as stream depth, width and discharge [30] Each stream recorded unique values for water quantity measurements as shown in Table 4 & 5.
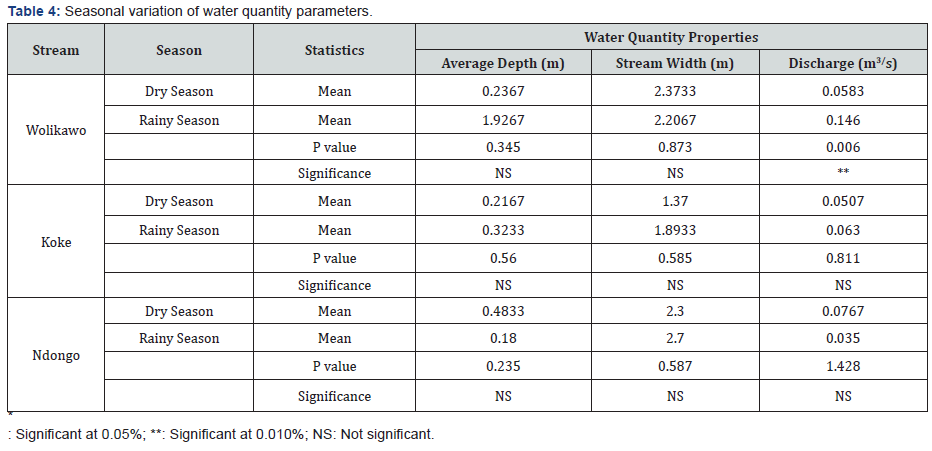
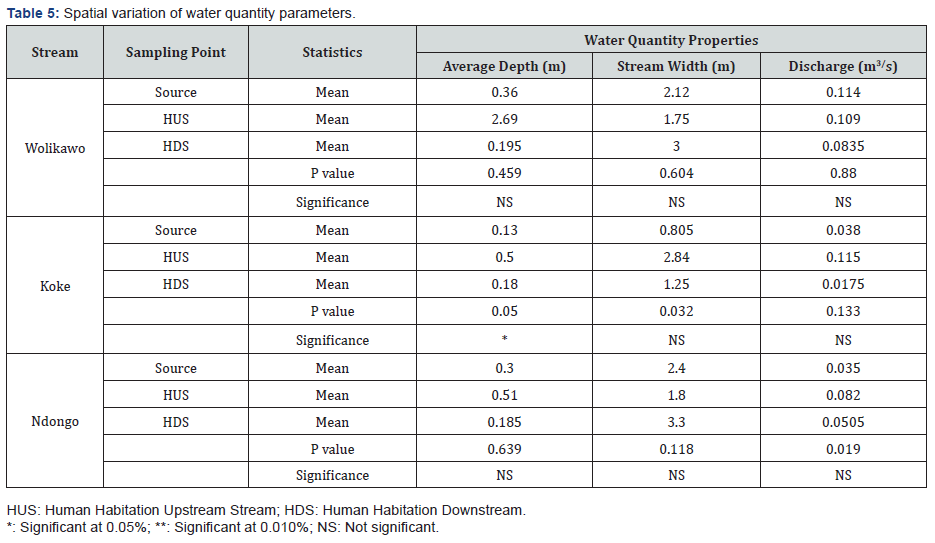
Stream depth showed a seasonal variation with the rainy season having higher values (Figure 9) though not significantly higher compared to the dry season values (Table 4). The seasonal difference in the average depth is as a result of discharge which is usually high during the rainy season. The average depth values recorded during the dry and rainy seasons respectively were 0.2367±0.06333m and 0.9267±1.57718m for Wolikawo, 0.2167±0.09171m and 0.3233±0.14075m for Koke and 0.4833±.2088m and of 0.1800±.06000m for Ndongo. Spatially, no significant difference was observed for the three streams (Table 5). Results showed that the average depth within Wolikawo was 0.3600±0.06000m at the source point, 2.6900± 2.39000m within human habitation upstream and 0.1950± 0.08500m within human habitation downstream. Koke stream recorded a value of 0.1300±.01000m at the source point, smaller compared to human habitation upstream with a value of 0.5000± 0.10000m and human habitation downstream having a value of 0.1800± 0.05000m. Values recorded at Ndongo were 0.3000 ±0.00000m at the source point, 0.5100±39000m within human habitation upstream and 0.1850±0.06500m within human habitation downstream.
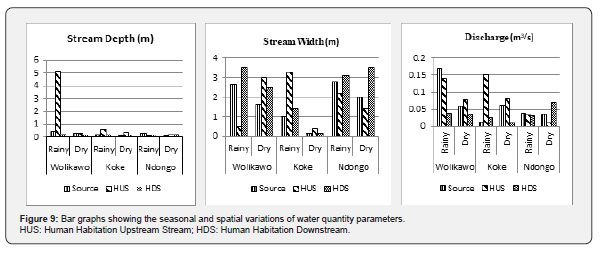
The stream width values recorded during the dry and rainy seasons respectively were 2.3733±0.40337 and 2.2067 ±0.89034m for Wolikawo, .3700±0.40337m and .8933±0.70288m for Koke, 2.3000±0.62450m and 2.7000± 0.26458m for Ndongo. However, the minimal change can be attributed to fall in discharge due to reduction in precipitation, over harnessing and irrigation and no significant seasonal variations were observed. Within Wolikawo the average width recorded 2.1200±0.50000m at the source point which was higher to that of human habitation upstream which was 1.7500± 1.25000m while the width expanded at human habitation downstream to 3.0000±0.50000m. On a spatial dimension the average width within Koke recorded 0.8050±0.19500m at the source point which was smaller compared to human habitation upstream with an average of 2.8400± 0.44000 while the value for human habitation downstream was1.2500±.15000m. Within Ndongo it recorded 2.4000±.40000m at the source point, 1.8000±.40000m within human habitation up stream and 3.3000±.20000m within human habitation downstream. However, no significant spatial variation was observed (Table 5).
Seasonally, stream discharge a measure of the actual volume of water passing through a point in m3/s was higher during the rainy season though not significant compared to the dry season values. The seasonal differences observed can be ascribed to changes in seasonal precipitation Wolikawo recorded a discharge value of 0.0583±0.01186m3/s during the dry season and 0.1460±0.01137m3 during the rainy. The discharge value of 0.0507±0.02099m3/s within Koke during the dry season was far below that of the rainy season which stood at 0.0630±.04362m3/s while within Ndongo discharge recorded an average of .0767±.02906 (m3s) during the dry season and 0.0350 ±0.00265 (m3s) during the rainy season. No significant seasonal variations in discharged were observed.
Spatial discharge recorded 0.1140±0.05400(m3/s) at the source point in Walikawo was different to that of human habitation upstream averaged 0.1090± 0.03100m3/s while there was a drastic fall in discharge downstream to 0.0835±0.04650. Discharge in Wolikawo reduce over space from the catchment. This is due to changing patterns in natural agents and human activities Average discharge recorded 0.0380±0.02400m3/s at the source point and was different to that of human habitation upstream averaged 0.1150±.03500m3/s while that of human habitation downstream was 0.0175± 0.00750m3/s within Koke. Average discharge values of 0.0350±0.00500(m3s) at the source point was different to that within human upstream (0.0820± 0.04800(m3s) and human habitation downstream (0.0505± 0.01950(m3s) within Ndongo. Ndongo stream taking its rise from the Bokoko hill is subjected to a lot of challenges. This stream is channeled through the most populated, busy and active zone (Buea, Mile 16) within Buea. It flows through business centers, students’ residential areas, public roads and agricultural paths. According to [18] irrigation and laundry along the Ndongo stream in Buea, contribute to a significant proportion of water usage along this stream there by reducing the stream discharge over space.
Comparism of water parameters tested and the who drinking water quality standard
Water quality parameters tested over space during the rainy and dry seasons were compared with the WHO standard to appreciate the role of the mountain in the supply of good quality water (Table 6). With the WHO dry season constants of 181.2409 and 178.0302 for mean and standard deviation respectively, the calculated standard deviation for the source point at Wolikawo showed that the deviation was 58.24575. Compared to the WHO standard constant we can conclude that the source point at Wolikawo has some deficits in terms of the physiochemical and biological parameters and therefore not suitable for drinking. Human habitation upstream with a mean value of 114.14 also recorded a deficit in the composition of parameters rendering the stream not suitable for human consumption. Koke on the other did not meet up with the WHO standard as all the SD values at various sampling points were below the stipulated WHO values. None of the points along Ndongo meet up the standard as all SD values (83.96303, 144.3472, and 183.3221) for the source point, HUS and HDS respectively were far below the standard value indicating deficiencies in the physiochemical and biological composition.
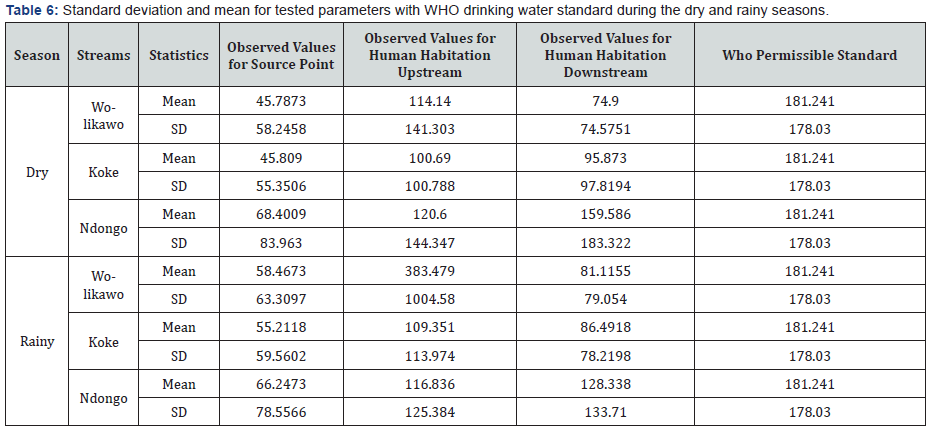
Observed values during the rainy season were not in accordance with the WHO standards showing a massive deficiency in water parameters. Source points which are most likely assumed to be of good quality recorded a SD range of 60-78 far lower than the WHO standard of (178.0302) an indication that the portable water provisioning ability of the Mountain has been largely degraded. The SD and mean within HUS for all streams showed values below the constant.
The study identified a myriad of human activities such as farming and irrigation, fishing, quarrying, construction, car wash and waste dump sites common in the area. These activities can have a negative impact on water quality thereby reducing the availability of good quality water. [31] also reported that high chemical fertilizer application and improper waste management has increasingly toxifying impacts on freshwater bodies around cities consequently jeopardizing water quality and security. Ssignificant differences in water quality parameters and the WHO standard for drinking water imply that the water is polluted thereby posing a serious health risk to the surrounding population. According to [32], without access to portable water, vulnerable populations are exposed to deadly water-borne illnesses.
Water quality index
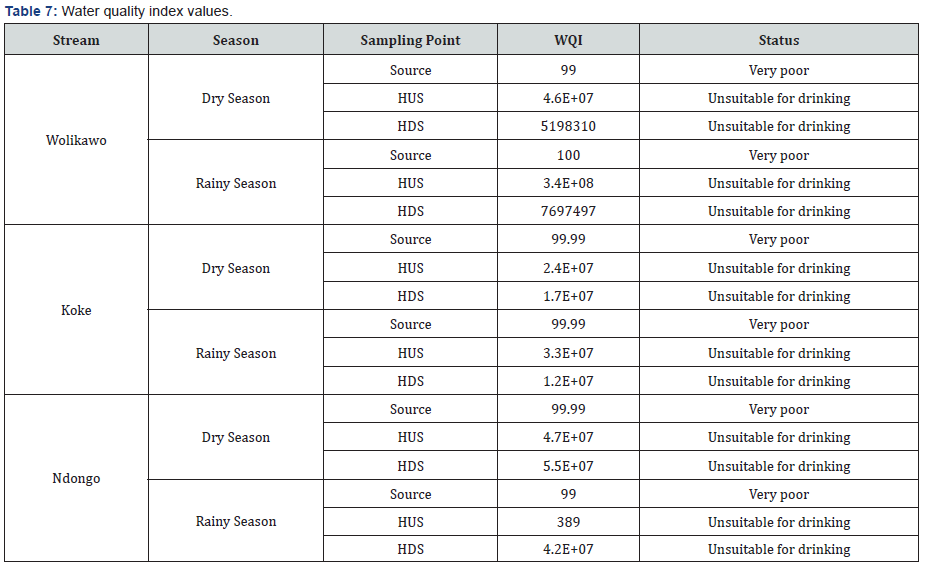
The water quality index was employed to assess the potability and pollution status for each sampling point across the selected streams both during the dry and the rainy seasons. This calculation generates a score and the lower the score the suitable the water is for drinking. From the calculations, the following results were obtained (Table 7). Results revealed that water atall sampling points was not suitable for direct consumption. All source points were very poor, with a WQI of <100 indicating that they could be consumed after effective treatment to avoid adverse health effects. Other sampling sites were totally unsuitable for drinking because of the degree of pollution. Downstream points for all streams recorded very high WQI values indicating that there are unsuitable for drinking and other uses. It was generally observed that there was a progressive decline in water quality from the source to areas of human habitation. This correlates with the findings of [33]. who said water become relatively undisturbed from the watershed upon arrival in areas of human habitation, there is a degradation in quality largely due to pollution and water quantity depreciation exacerbating from over extraction and irrigation along waterways.
Conclusion and Recommendations
The study identified a myriad of human activities in the area such as farming, irrigation, fishing, quarrying, construction, car wash, machine cooling and waste dump sites with negative impacts on water quality thereby reducing the availability of good quality water. The capacity of the Mountain ecosystem to supply portable water delivery services for human well-being directly depends on the ecosystem condition (its structure and processes), anthropogenic activities and pressure on ecosystem structure and functions that can influence the state and the services it supplies. The study shows deterioration of water quality and quantity parameters over space and time. For water quality seasonally, most parameters were not statistically significant except Cl- while spatially, temperature, calcium and magnesium were statistically significant. Quantity analysis on the other hand, also showed that discharge was not statistically significant between the dry and rainy season and across space. Also, parameters tested were not in compliance with the WHO drinking water standard and thereby posing a potential health risk when consumed by the local inhabitants. The water quality index indicated that the streams are not good for drinking.
In line with the findings, the study proposes the following recommendations in order to guarantee the portability and availability of water to attain water security within Buea plagued with serious acute portable water deficiencies.
a) Water catchment laws should be created within Buea with emphasis on rigor in human activities around source points and along stream courses. Limitations should be placed over extraction, deviation and large irrigation schemes.
b) The government should carryout monitoring and surveillance of activities by mapping high risk zones for intervention and follow up.
c) The local council should work in close collaboration with the Hygiene and sanitation sector (HYSACAM) in Buea to avoid misuse of water channels for dumping of wastes. The numbers of trash cans should be increased and located at regular intervals within each neighborhood.
d) To combat pollution, human activities should be located more than 100m away from the source point, agricultural actives should be practiced further from the channels. Car wash and machine cooling centers should all be located downstream to avoid introducing alien chemical compounds into the stream.
e) An integrated watershed management board should be created to oversee stream protection and portable water delivery to local communities.
References
- Costanza R, D Arge R, de Groot RS, Farber S, Grasso M, et al. (1997) The value of world’s ecosystem services and natural capital. Nature 387: 253-260.
- MEA Millenium Ecosystem Assessment (2005).Ecosystems and Human Wellbeing: Current State and Trends. Washington, DC: Island Press.
- TEEB [The Economics of Ecology and Biodiversity] (2010).
- Haygarth PM, Jarvi SC (2002) Agriculture, hydrology and water quality.
- Kolinjivadi V, Adamowski J, Kosoy N (2014) Recasting payments for ecosystem services (PES) in water resource management: A novel institutional approach. Ecosystem Services 10: 144-154.
- Ivey JL, De Loe RC, Kreutzwiser RD (2006) Planning for source water protection in Ontario. J Appl Geogr 26(3-4): 192-209.
- Wantim MN, Suh CE, Ernst GGJ, Kervyn M, Jacobs P (2011) Characteristics of the 2000 fissure eruption and lava flow fields at Mount Cameroon volcano, West Africa: a combined field emapping and remote sensing approach. Geological Journal 46(4): 344-363.
- Payton RW (1993) Ecology, altitudinal zonation and conservation of tropical rainforest of Mount Cameroon. Unpublished report to FAO.
- Ako AA, Shimada J, Hosono T, Kagabu M, Ayuk RA, et al. (2012) Spring water quality and usability in the Mount Cameroon area revealed by hydro geochemistry. Environ Geochem Health 34: 615-639.
- Horton RK (1965) An index number system for rating water quality. J Water Pollu Cont Fed 37(3): 300-305.
- Chatterjee PR, Raziuddin M (2002) Determination of water quality index of a degraded river in Asanol Industrial area, Raniganj, Burdwan, West Bengal. Nature, Environment and Pollution Technology 1(2): 181-189.
- World Health Organization and UNICEF (2006) Meeting the MDG drinking water and sanitation target: the urban and rural challenge of the decade.1, FAO ROME, pp. 20-26.
- Moriken C, Nor RJ, Ahmad FA (2019) Impact of land uses on water quality in Malaysia: a review. Ecological Processes volume 8(10).
- Sarah Goodyear (2013) The Stresses of Water Scarcity.
- North Carolina State University (2009) Much Better Way to Protect Streams from Construction Runoff Is Also Low Cost. Science Daily.
- Chukwu O, Segi S, Adeoye PA (2008) Effect of Car-Wash Effluents on the Quality of Receiving Stream. Journal of Engineering and Applied Sciences 3(7): 607-610.
- Nkede FN (2010) Investigating the pollution of Ndongo River a result of solid waste dumping. Msc thesis department of environmental science university of Buea.
- United Nations Development Program (UNDP) (1997) Human Development Report on Developing Countries, Environment.
- Ekhaise FO, Anyasi CC (2005) Influence of breweries effluent discharge on the microbiological and physiochemical quality of Ikpoba River, Nigeria. African J Biotech 4(10): 1062-1065.
- Usongo PA (2010) An Assessment of The Biophysical Impact of Banana (Musa Acuminata) Plantations in South Western Cameroon. Thesis from the Department of Geography Obafemi Awolowo University Ile-Ife, Nigeria.
- Ray KL, Joseph BF, David LF, George TC (1992) Water supply system, in Water resources association 4 (Washington, D.C. Engineering. McGraw Hill, 1992), pp. 497-567.
- Gaillardet J, Dupre B, Louvat P, Allegre CJ (1999) Global silicate weathering and CO2 consumption rates deduced from the chemistry of large rivers. Chemical Geology 159(1-4): 3-30.
- Paul MJ, JL Meyer (2001) Streams in The Urban Landscape. Annual Review of Ecology and Systematics 32: 333-365.
- Stanislav R, Veronika C, Katarína F, Darina S, Beáta (2017) Impact of Calcium and Magnesium in Groundwater and Drinking Water on the Health of Inhabitants of the Slovak Republic. Int J Environ Res Public Health 14(3): 278.
- Lekeanju NT, Lenyu IK, Mbunya FN (2016) Chemical fertilizer application and farmers perception on food safety in Buea, Cameroon Resource Centre for Environment and Sustainable Development (RCESD), Buea, Ca
- Walsh CJ, Roy AH, Feminella JW, Cottingham PD, Groffman PM, et al. (2005) The urban stream syndrome: Journal of the North American Benthological Society 24(3): 706-723.
- Meyer JL, Paul MJ, Taulbee WK (2005) Stream Ecosystem Function in Urbanizing Landscapes. Journal of the North American Benthological Society 24(3): 602-612.
- Lowa State University, (2020) Assessing the Health of Streams in Agricultural Landscapes: The Impacts of Land Management Change on Water Quality - Interpretive Summary (800) 262-3804, 2150 Beardshear Hall, Ames, IA 50010-2046Copyright ©.
- Musingafi M (2014) Fresh water sources pollution: A human related threat to fresh water security in South Africa. Journal of Public policy and Governance.
- Booth DB, Jackson CR (1997) Urbanization of aquatic systems: degradation thresholds, stormwater detection, and the limits of mitigation. Journal of the American Water Resources Association 33(5): 1077-1090.
- Liao H, Yen JY, Guan Y, Ke D, Liu C (2018) Differential responses of stream water and bed sediment microbial communities to watershed degradation. Environment International 134: 105198.
- Keller A, Sakthivadivel R, Seckler D (2000) Water scarcity and the role of storage in development. Colombo, Sri Lanka: I v, IWMI Research Report 39), p. 16.
- Natasha K, Sanjiv T (2015) Influences of natural and anthropogenic factors on surface and groundwater quality in rural and urban areas. Frontiers in Life Science 8(1): 23-39.


