Hierarchical Cluster Analysis as an Indicative of the Hydrogeochemical Evolution of Ground Water in a Shallow Aquifer System
Aneeshkumar Narikkatan1* and AGS Reddy2
1Central Ground Water Board, Ministry of Jal Shakti, India
2National Ground Water Training & Research Institute, Ministry of Jal Shakti, India
Submission: November 26, 2020;Published: January 05, 2021
*Corresponding author: Aneeshkumar Narikkatan, Central Ground Water Board, Ministry of Jal Shakti, Trivandrum, Kerala -695004, India
How to cite this article: Aneeshkumar N, AGS Reddy. Hierarchical Cluster Analysis as an Indicative of the Hydrogeochemical Evolution of Ground Water in a Shallow Aquifer System. Int J Environ Sci Nat Res. 2021; 26(5): 556197. DOI:10.19080/IJESNR.2021.26.556197
Abstract
The use of the Hierarchical Cluster Analysis (HCA) in conjunction with a multi-sample graphical technique offers a robust indicator of geochemical evolution of ground water. HCA applied to identify geochemical processes controlling the ground water geochemistry of shallow aquifer system in the outer plains of Jammu and Kashmir State. HCA has good agreement with hydro chemical facies to reflect the process and pattern of the ground water flow in geological formation and it explains the distribution and genesis of ground water. Majority of the collected water samples have higher HCO3- than alkaline earth metals thus indicating base exchange-softened water. Alkaline earth metals (Ca and Mg) prominent than alkali metals (Na and K). Ion dominance pattern in Kandi is in order of Ca2+ > Mg2+ > Na+ > K+ : HCO32- > SO42- > Cl- > NO3- > F-> CO32- while in Sirowal it is Na+ > K+ >Ca2+ > Mg2+ : HCO32- > NO3- > SO42- > Cl- > F- > CO32- type. Indirect Ion-exchange processes are involved in water with host rock during the evolution of sub-surface water chemistry along the hydraulic gradient.
Keywords: Geochemistry; Cluster analysis; Facies; Ionic order; CAI
Introduction
The hydrochemistry of natural water is controlled by dissolution and adsorption of geological material. The minerals can pass in the ground water by various processes including advection, dispersion, physical filtering, sorption, precipitation and biological transformation. The ions move primarily vertically downwards through the unsaturated zone from the surface and the solute undergoes horizontal displacement to a limited extent. The solutes get into the unsaturated zone along with water; it tends to spread out, due to dead end effect or dispersion. It may take considerable time for the solute to percolate through the zone of aeration. Once the ions reach the saturated zone, they usually spread out laterally and move in the direction of ground water flow along hydraulic gradient.
In Jammu and Kashmir, issues related to ground water quality are not of much concern at present. However, the current issues of its quality problems are geogenic and to some extent anthropogenic in the form of unregulated disposal of village sewages in open water bodies resulting into contamination of shallow aquifers. The scope of the present study is to infer the evolution of geochemistry of ground water of shallow aquifers. An effort has been made to organize the voluminous chemical data and attempt interpretation by applying multivariate statistical methods and HCA. Cluster analysis is a convenient method for identifying homogenous groups of objects called clusters. Objects (variables) in a specific cluster share many characteristics. The objective of cluster analysis is to identify groups of wells that are very similar with regard to their variables and assign them into clusters. In this study Euclidean distance (or straight-line distance) method is used for analyzing ratio or interval-scaled data after suitably normalized hence in this study equal weighing of all variables has done with log-transformation of the data by converting the measured variables to log-ratio [1,2]. In addition to cluster analysis some commonly used graphical methods and multivariate statistical technique were applied, viz Gibbs diagram, Schoeller semi logarithmic diagram, Piper diagram, and Scatter plots for ionic distribution study.
Hydrometeorology and hydrogeology
Climate of Jammu region varies from sub-humid to sub-tropical. It lies in the northern hemisphere above the tropic of cancer. There are three seasonal conditions prevailing in this study area, i.e., monsoon (June-September) yielding 60-65% of the total rainfall (≈ 107cm), post-monsoon (October-January) and pre-monsoon (February-May). Precipitation occurs in the form of snow fall in high mountainous parts of Jammu region also contribute total availability of ground water in aquifer. The minimum and maximum temperature of the study area varies between 40C (December-January) and 470C in (April-May).
In the study area, groundwater occurs in piedmont deposits belonging to upper Pleistocene to Recent age. Two hydro geological units, namely Kandi (Bhabhar) and Sirowal (Terai) zones are observed in outer plains of Jammu region, extending between rivers Ravi in the east to Munawar Tawi in the west (Figure 1). The typical Kandi formation comprises boulder, pebble, gravel and coarse sand with substantial amount of clay, hard and sticky, of varying thickness. The clay proportion increases towards southwest. Occurrence of perched water bodies is a common phenomenon in Kandi belt. The ground water generally occurs under unconfined conditions in Kandi formation. In general depth to water level is very deep in Kandi area except along canals and tributaries where water level is shallow and dug wells are feasible in the area. Depth of dug wells varies from 02m to 20.0m and depth to water level varies between 05m to 10mbgl (below ground level). The yields of dug wells are in general very high about 200m3/day to 300m3/day with meagre draw down of 0.5m. Dug wells are main source of water supply in Kandi area.

Sirowal formations are southernmost hydrogoelogical unit ,which is finer outwash of Siwalik debris brought by streams. Ground water occurs under both confined as well as unconfined conditions in Sirowal formation. The junction between Kandi and Sirowal formations is generally characterized by a spring line as water table interact with topography and water oozes out along this line causing marshy conditions. The area is underlain by multi-aquifer system with thickness of aquifers varying from 3-4m to 20m. General depth of dug wells in Sirowal area is 5 to 8m bgl and yield varies from 50 to 100m3/day. The flow direction of ground water is from north-east to south-west i.e., along Kandi to Sirowal formations. The Kandi tract has got steep topographic slopes ranging between 1:90 and 1:120. Altitude of the Kandi ranges between 320 and 400m above mean sea level. Sirowal tract occupies the southern plain tract of the district. It has altitude less than 320m above mean sea level. Topographic gradient is reduced to gentle 1:250 to 1:300.
Materials and Methods
Water quality data of 650 samples collected from 69 observation wells from 2005 to 2015 has been used for this study. 13 chemical variables, specific conductance (EC), pH, Ca2+, Mg2+, Na+ ,K+, Fe (total), HCO3 NO3-,SO42-,Cl-, F-,CO32- were tested for the present evaluation. All the samples were analyzed according to standard method APHA [3]. pH, EC were measured immediately at sampling site using portable meters. Calcium and Magnesium were determined titrimetrically using standard EDTA (Sodium salt of ethylene di amine tetra acetic acid). Chloride was determined by silver nitrate titration. Carbonate and bicarbonate were estimated with standard sulphuric acid. Nitrate, fluoride sulphate and iron were determined spectrophotometrically. Sodium and potassium were analyzed by flame photometry method. Microsoft Excel 97 and AquaChem were used for the graphical analyses. Classification of the data was performed using cluster analysis (HCA) by using the software CLUSTER-3. All the samples were validated using Histogram plot and ion balance method. Among the 69 samples, 5 samples rejected during validation due to abnormality as outliers and 64 samples have only been used for HCA analysis. In this study, Euclidean distance has been selected as the distance measure and Ward’s method [1] has been used as a linkage rule to produce the most distinctive groups. The Euclidean distance takes the difference between two variables directly. It should therefore only be used for data that are suitably normalized hence in this study equal weighting has been assigned to all variables with log transformation of the data by converting the measured variables to log-ratios [2].
Results and Discussion
Hydrochemistry
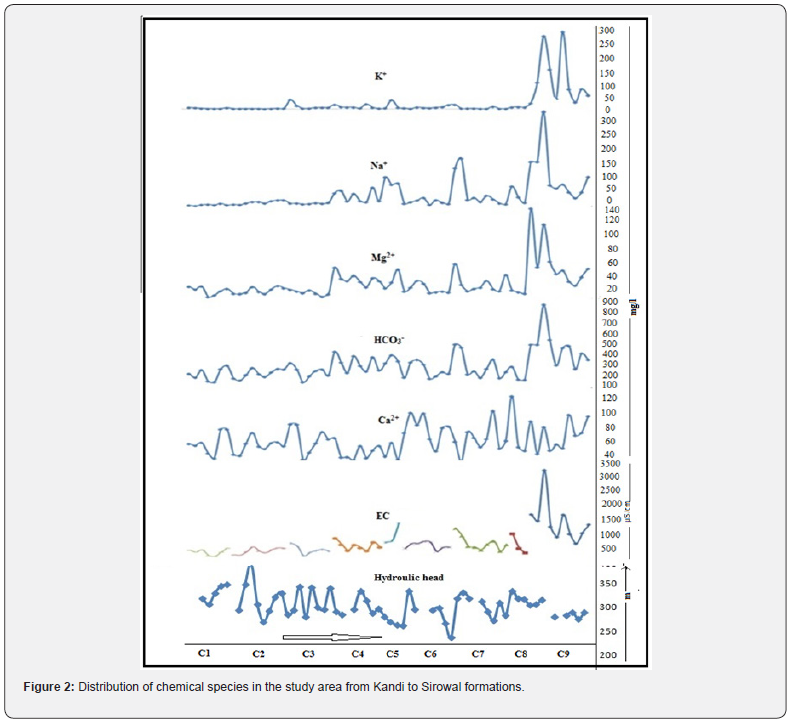
The hydrochemistry of the study area is assessed through the analysis of ground water samples collected from the wells of Kandi and Sirowal formations. General distributions of chemical species in the study area are shown in the Figure 2. The ground water in the outer plain of the study area is generally alkaline in nature. The pH value of ground water in Kandi area ranges from 7.42 to 8.09. EC varies from 271 to 1229μS/cm at 25oC. The ranges concentration of other major constituents viz Na+ (0.2 -135mg/l) , K+(nd (non detectable) -71mg/l), Mg2+ (0.5- 81mg/l) , Ca2+ (1.8-124mg/l), Cl- (0.2- 130mg/l), SO42- (ND-243 mg/l), HCO3- (2.5-524mg/l), CO32- (ND),NO3- (0.1- 154mg/l) , F- (0.01 to 0.9mg/l) and total dissolved iron (Fe) (0.13-2.44mg/l ) showed wide variation. pH of ground water in Sirowal formation ranges from 7.46-8.41 and EC varies from 392-1710μS/cm at 25oC. The ranges of concentration of various ions in these wells are Na+ (0.3 -169mg/l), K+ (ND- 306mg/l), Mg2+ (0.6- 146mg/l), Ca2+ (1.7- 106mg/l), Cl- (0.3-230mg/l), SO42- (0.1- 462mg/l), HCO3- (2.9-567mg/l), CO32- (ND), NO3- (nd- 278mg/l) and Fe (0.11 - 3.64mg/l). These values reveal some trend between hydrochemistry of Kandi and Sirowal formation. The water samples from former wells have significantly lower EC than the later. The concentration of chemical species of water samples from Kandi to Sirowal wells shows gradual increase on moving from Kandi to Sirowal (Figure 2). The gradual change of the ions depending upon the availability of source, mineral, solubility, exchange mechanism, adsorption and desorption as observed in the direction of flow from Kandi to Sirowal as per topography. The source of these ions in majority of the samples appears to be geogenic. Weathering of rocks forms main source for the major ions. At low dissolved concentration, the dominant ions are Na+ and Cl-, contributed by rain water without much geochemical reaction. Contact with minerals (calcite) increases the relative content of Ca2+ and HCO3- (Kandi formation). If subsequent evaporation concentrates the solution, Ca2+ and HCO3- are lost by precipitation/dissolution and solution is dominated by Na+ and Ca+ (Sirowal formation). Plots of Gibb’s diagram (Figure 3) indicate that most of the ground waters of Sirowal and Kandi shallow aquifers fall on the boundary of rock dominance, but some samples in Sirowal formation show evaporation dominance.
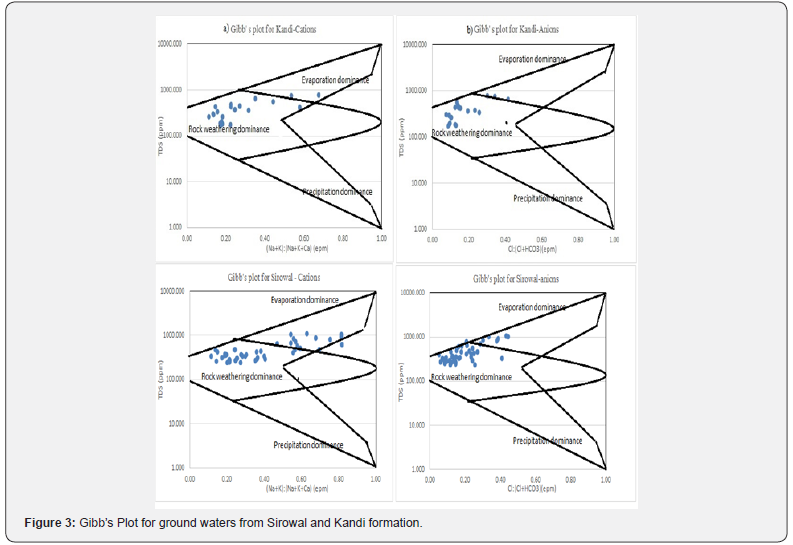
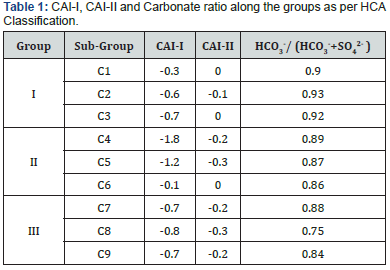
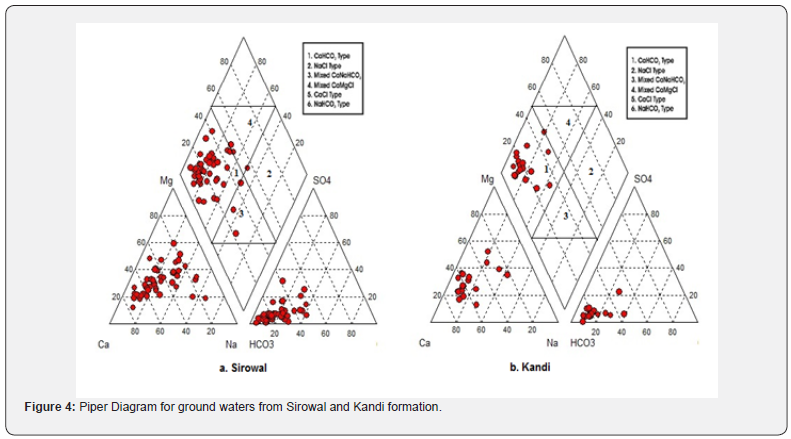
In the study area, 92% of the collected water samples have higher HCO3- concentration than alkaline earths thereby indicating base exchange-softened water. Ground water in Kandi formation is mostly Ca2+ or Mg2+ type while concentration of Na+ and K+ is more in Sirowal and it is due to weathering of rock which is confirmed by presence of clay and slit in the outer plains. The alkaline earth metals exchange with alkali metal in rocks due to the size of atom (atomic size Ca>Mg>Na>K) in the direction of flow and ultimately reaches a dynamic equilibrium. The nature and type of water can be evaluated by plotting the concentration of major cations and anions in the Piper diagram (Figure 4). The plot shows that most of the ground water samples fall in the field of CaHCO3 and a few samples demonstrate Ca-Na-HCO3 type. Ca- Mg-Cl type water is also observed in fewer samples. Gibb’s plot, Chloroalkaline indices and Piper diagram propose that most of the ground waters of the study area fall on the boundary of rock and evaporation dominance field. Temperature in the study area is very high (up to 45-50 ºC) and rain fall is very less in summer, the ground water became oversaturated with respect of CaCO3 due to evaporation. The ion exchange between the ground water and its host environment during residence or travel can be understood by studying the chloroalkaline indices: CAI-I = [Cl- – (Na+ + K+)]/ Cland CAI-II = [Cl- – (Na+ + K+)]/ (SO42- + HCO3- + CO3- + NO3- Schoeller H [4]. The CAI-I and CAI-II are found to be negative (Table 1) indicating that ion-exchange processes are involved between Naand K- in water with Ca2+ and Mg2+ in host rock, and the exchange is indirect during the evolution of sub-surface water chemistry McIntosh & Walter [5].
It is evident from these observations that active process of dissolution has taken place as a result of weathering and precipitation in the study area. In order to find the detailed relationship between hydro geochemistry of water samples and their process, statistical and cluster analysis has been applied among their dissolved concentration of the constituents and environmental parameters such as lithology using multivariate technique. HCA technique has been successfully applied for the classification of hydro geochemical data by many researchers Stein horst & Williams [6]; Davis [7]; Schot & Van dermal [8]; Guler et al. [9]; and Awni Batayneh & Taisser Zumlot [10].
Cluster analysis
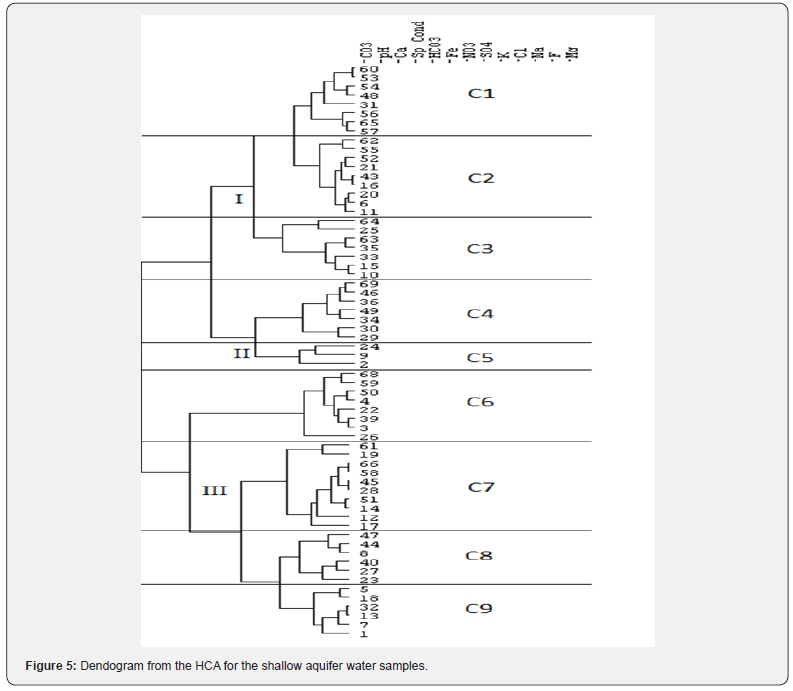
HCA classifies the data in a relatively simple and direct, with the results being presented as a dendogram Davis [7]. In the present study, the number of groups was selected based on visual examination of the dendogram (Figure 5). The resulting dendogram was interpreted to have classified the 64 wells into three major groups (I–III) and nine subgroups (C1to C9) using 13 variables. The interpretation of dendogram with hydrochemistry of each site was carried out by comparison of each group with the graphical techniques since dendogram does not give information about the distribution of the chemical constituents that form the group.
The results of the physico chemical analysis of ground water samples as determined by HCA are summarized in Table 2. These values reveal some trends between the major groups. Group I samples have significantly lower EC than Group II and III. The distribution of Groups I, II and III is unique and distinguishable easily by hydrochemistry. The basis for the division into subgroups is logical and subgroups C1, C2 and C3 can be clearly distinguished from subgroups C7, C8 and C9 by the increasing trend of concentration of chemical species while the subgroup C4, C5 and C6 is a mixed type. Subgroup C5 has three members that are distinguished by other groups having abnormally high EC. It has been found that there is a good agreement between the spatial locations and statistical groups determined by the HCA. The samples comprising C1 and C2 are located in Kandi and nearby recharge areas on the basin floor and have the lowest cation and anion concentrations while samples of C3 to C6 are characterized by mixed type. The samples comprising of groups C8 and C9 are found in Sirowal and nearby discharge areas and have recorded highest chemical entity. The majority of recharge to the basinfill aquifers occurs in samples which fall in the C1 and C2 while C3 to C6 fall mostly in transition / dilution stage of aquifers. The relationship with the sample location and cluster analysis was confirmed by plotting the distribution of the concentration of chemical species along with hydraulic head of the samples from C1 to C9 (Figure 2). The plot shows gradual increase of cations and anions along the gradient of hydraulic head.
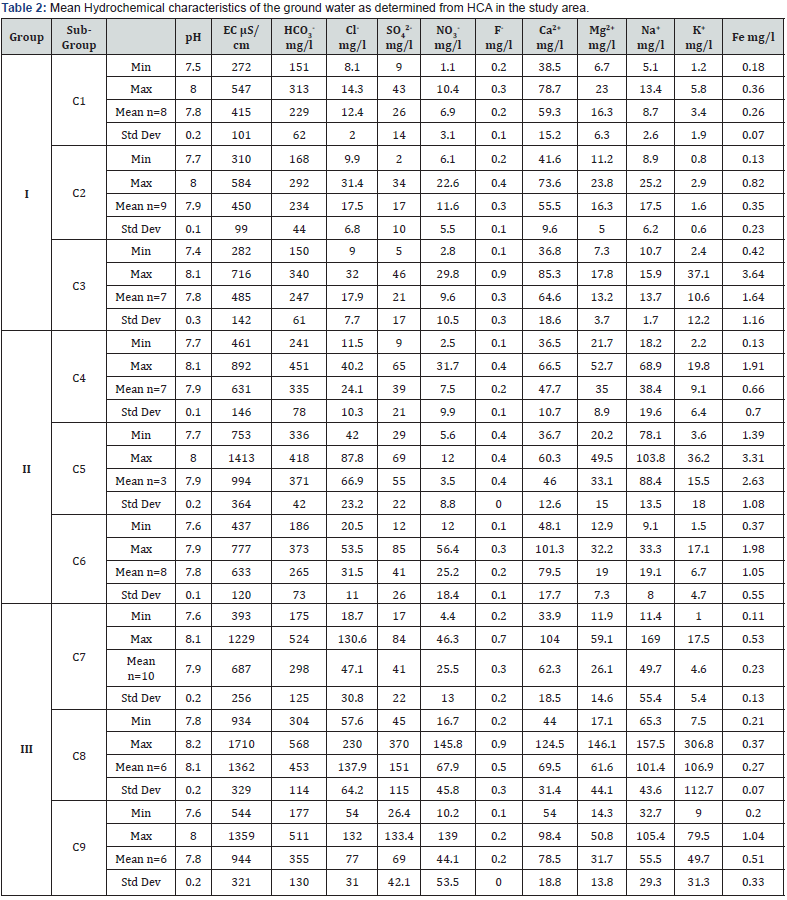
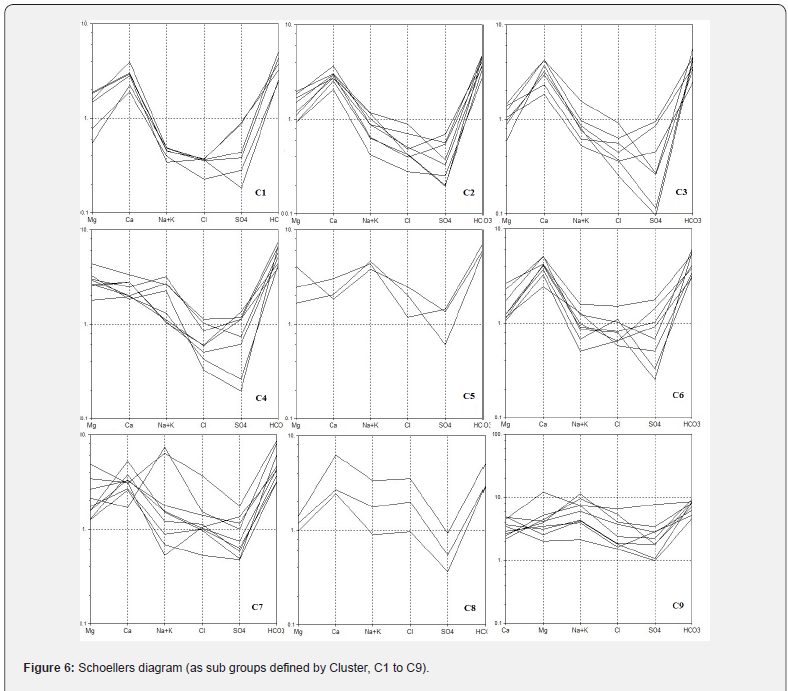
The gradual change (increase) of the ions is further confirmed by chloroalkaline indices as described earlier. The magnitude of dissolution and concentration of chemical entity depend on the availability of mineral and exchange mechanism as observed in the direction of flow from Kandi to Sirowal formations. Ground water samples are plotted on Schoellers Semi logarithmic diagram (Figure 6). The group I, II, and III are unique and support HCA analysis that is patterns of C1 to C3, C4 to C6 and C7 to C9 shows a distinct pattern that differs from other sub groups. It would be difficult to discriminate between samples belonging from C3 to C6 or C4 to C9 along the group. This is due to the fact that group C1 to C3 falls in the recharge area, C4 to C6 in the mixing area and C7 to C9 in the discharge area. It shows that the HCA can provide valuable information on hydrologic system to support a model of hydro geochemical evolution where the changes in water chemistry are a result of increasing rock–water interactions and evaporations along hydrological flow paths
Ionic dominance pattern and process
The detailed analysis of cation and anion chemistry reflects the process and pattern of water flow in an aquifer matrix and it explains the distribution and genesis of ground water type [11-13]. Ionic dominance pattern in the study area along with schematic exchange pattern is shown in Figure 7. In Kandi area, C1 comprises of Ca2+ > Mg2+ > Na+ > K+ > Fe: HCO3- > SO42- > Cl- > NO3- >F- > CO32- ionic order, C2 is Ca2+ > Na+ > Mg2+ > K+ >Fe: HCO3- > Cl- > SO42- > CO32- > NO3- > F- and Ca2+ > Mg2+ > Na+ > K+ >Fe: HCO3- > SO42- > Cl- > NO3- > F- > CO32- type and C3 has 3 types of species. C4, C5 and C6 are mixed type, here Kandi /Sirowal transition occurs giving rise to variety of ionic arrays mostly Ca2+ > Mg2+ > Na+ > K+ > Fe : HCO32- > SO42- > Cl- > NO3- > F- > CO32-, Na+ > Ca2+ > Mg2+ > K + > Fe : HCO32- > SO42- > Cl- > NO3- > F- > CO32- or Ca2+ > Mg2+ > Na+ > K+ >Fe : HCO3- > NO3- > Cl- >SO42- > F- > CO32-. While C7 wells are isolated having only Na+ - Ca2+ or Ca2+ - Na+ and HCO3- > Cl- , HCO3- > NO3- or HCO3- > SO42- ionic order. While in the low gradient area wells which falls in sirowal viz C8 and C9 comprises of Na+ and K+ type or Ca2+ and Na+ type, where the exchange is maximum. These ion analyses are in tune with HCA indicating that exchange has been occurring in the direction of water flows. It confirms that along the hydraulic gradient, calcium type water will ultimately improved to sodium type and will attain a dynamic equilibrium state. As mentioned earlier the study area is characterized by temperature greater than 40 ºC and low rain fall during the pre monsoon, the ground water is saturated with salts due to evaporation. The salts are precipitated in the order CaCO3, MgCO3, CaSO4, Na2CO3, Na2SO4, NaHCO3, MgSO4, MgCl, CaCl, KCl and KNO3. In general salts with higher solubility get precipitated first as aridity increases. It implies that the former salts are precipitated first by evaporation and later salts are enriched in the water. The Kandi waters are prominently Ca2+ or Mg2+ type while concentration of Na+ and K+ is more in Sirowal. This is due to the higher degree of the rock weathering and precipitation in the former than in the later. Moreover, in a low concentrated solution system, like this aquifer (Na+ < 169mg/l) sodium has tendency to remain in solution as Na+ without participating any association with mineral surface sites or precipitation reactions and will travel along the hydraulic gradient [14] due to fact that alkali metals show weaker surface adsorption with minerals compared to divalant alkaline earth metals which results concentration of sodium and potassium in solution along the flow path [15].
This observation is evident from the higher concentration of HCO3- as confirmed by the Piper diagram (Figure 4). According to Rogers [16] if the Na+ is derived from the weathering, the ground water should have high HCO3-. This observation has good agreement with present study and the high concentration of HCO3- reflects mineral dissolution [17]. The relatively high ratio of HCO3- / (HCO3- + SO42-) noted in most of the samples (>0.7) signifies that carbonic acid weathering was responsible for the major ion formation in the waters [18,19]. When moving from C1 to C9, the ratio is decreasing due to control of solute acquirement process (Table 1). The next prominent anion, chloride is higher than all other anionic species in C7 to C8 and in some samples nitrate or sulphate exceeds chloride. The nitrate and chloride are resulting from local recharge and contamination from anthropogenic influences. Generally large portion of sulphate in aquatic system is contributed from rock weathering and from fossil fuel burning and with minor amounts from volcanism. The observed high values of suphate in some samples in the study area may be attributed to the oxidative weathering of gypsum.
It may be concluded that changes in the composition of ground water in outer plains of Jammu a semi-arid region are brought about by evaporation, concentration of dissolved solids, solubility and hydraulic gradient. Precipitations of salts depend on the initial concentration of salts, the duration of evaporation, climatic factors and relative retention time. Thus, the distribution of ions and HCA support the spatial variation in the ground water quality that has evolved by the lithological and topographic differences.
Conclusion
The use of the Hierarchical Cluster Analysis (HCA) in conjunction with a multi-sample graphical technique such as the Piper, Gibbs and Schoellers plots offer a robust methodology to efficiently classify large numbers of water samples based on common chemical and physical parameters. From the analysis it is evident that maximum exchange of ions has occurred from Kandi to Sirowal as in the direction of water flow. Lowest concentrations of chemical entities are found in Kandi area while highest concentrations are observed at Sirowal and nearby discharge areas on the basin floors. Kandi formation coalesces into Sirowal formation and is characterized by mixed type. Study area falling under semi-arid regions is oversaturated with respect to CaCO3 due to evaporation. It is observed that alkaline earth metals (Ca and Mg) prominent than alkali metals (Na and K) and HCO3- ion exceeds the other anions.
Ionic dominance pattern in Kandi formation comprises of Ca2+ > Mg2+ > Na+ > K+ > Fe: HCO3- > SO42- > Cl- > NO3- >F- > CO32- Ionic order. Kandi /Sirowal transition area giving rise to variety of ionic arrays mostly Ca2+ > Mg2+ > Na+ > K+ > Fe : HCO32- > SO42- > Cl- > NO3- > F- > CO32-, Na+ > Ca2+ > Mg2+ > K + > Fe : HCO32- > SO42- > Cl- > NO3- > F- > CO32- or Ca2+ > Mg2+ > Na+ > K+ > Fe : HCO3- > NO3- > Cl- >SO42- > F- > CO32-. Sirowal formation comprises Na+ and K+ type or Ca2+ and Na+ type where the exchange is prevalent. Carbonic acid weathering is the major ion formation process in the waters, but along the flow path carbonic acid weathering is slow due to control of solute acquirement process. Chloride is higher than all other anionic species in Sirowal formation and in some samples nitrate or sulphate exceeds chloride. The nitrate and chloride are resulting from local recharge and contamination from anthropogenic influences. The observed high values of suphate in some samples in the study area may be attributed to the oxidative weathering of gypsum.
These ion analyses are in agreement with HCA indicating that exchange has been occurring in the direction of hydraulic gradient. Along the hydraulic gradient, calcium type water will ultimately improve to sodium type and will reach a state of dynamic equilibrium in the discharge area. Ca2+ and HCO3- are lost by precipitation/dissolution and solution is dominated by Na+ and Ca++ (Sirowal formation). This is due to the higher degree of the rock weathering, precipitation and high surface adsorption in the former than in the later. The hydrochemistry of ground water in the study area decided by evaporation, concentration of dissolved solids, solubility and hydraulic gradient. The order Precipitations/ dissolution of salts depend on the initial concentration of salts, the duration of evaporation, climatic factors and relative retention time. In general salts with higher solubility get precipitated first as aridity increases. Combining the above multivariate statistical tools and HCA appears to offer a methodology that includes the advantages to handle bulky environmental data while minimizing the limitations of either approach.
Acknowledgement
Authors are thankful to Chairman, and Members, CGWB for giving facility and according permission to publish the paper. Authors are thankful to Sh. Manoj Shrivastava, former RD, NWHR, Jammu for his valuable suggestion and support while preparation of this paper. Thanks are due to the officers and other staff members of CGWB, NWHR, and Jammu who were of direct and indirect help in preparation of this paper. The views expressed by the authors are not necessarily of those of the department, they represent.
references
- Ward J H (1963) Hierarchical grouping to optimize an objective function. Journal of the American Statistical Association 58: 236-244.
- Michiel de Hoon (1998-1999) Cluster 3.0 Manual for Windows, Mac OS X, Linux, Unix, University of Tokyo, Human Genome Center, Stanford University.
- APHA, AWWA, WEF (1995) Standard methods for the Examination of water and Wastewater. 19th edition Washington. D.C 20005.
- Schoeller H (1967) Geochemistry of ground water. An international guide for research and practice, UNESCO, 15, pp. 1-18.
- McIntosh JC, Walter LM (2006) Paleowater in Silurian-Devonian carbonate aquifers: geochemical evolution of groundwater in the Great Lakes region since Late Pleistocene. GeochimCosmochim Acta 70(10): 2454-2479.
- Steinhorst RK, Williams RE (1985) Discrimination of groundwater sources using cluster analysis, MANOVA, canonical analysis and discriminate analysis. Water Resource Research 21(8): 1149-1156.
- Davis J (1986) Statistics and Data Analysis in Geology. (2ndedn), Wiley, New York, USA.
- Schot PP,JVan der Wal (1992) Human impact on regional ground water composition through intervention in natural flow patterns and changes in land use.Journal of Hydrology 134(1-4): 297-313.
- Guler C, Geoffrey DT, John EM, Turner AK (2002) Evaluation of graphical and multivariate statistical methods for classification of water chemistry data. Hydrogeology Journal10: 455-474.
- Batayneh A, Zumlot T (2012) Research Journal of Environmental and Earth Sciences 4(7): 756-768.
- Seaber PR (1962) Cation hydrochemical facies of groundwater in the Englishtown Formation, New Jersey.USGS Prof., pp. 124-126.
- Back W (1966) Hydrochemical Facies and ground water flow pattern in northern part of Atlantic Coastal Plain. USGS Prof. Paper 498A: 42.
- Subba Rao N, Surya Rao P,Deva VarmaD (2013) Spatial variations of Ground water vulnerability using Cluster analysis. Journal Geological Society of India. 81: 685-697.
- Hem J D (1985) Study and Interpretation of the Chemical Characteristics of Natural Water.(3rd edn), Geological Survey 604 South Pickett St.Alexandria, VA 22304: 100.
- Plummer LN, William B (1980) The mass balance approach: application to interpreting the chemical evolution of hydrologic systems. American Journal of Science280(2): 130-142.
- Rogers R J (1989) Geochemical comparison of ground water in areas of New England, New York and Pennsylvania. Ground Water 27(5): 690-712.
- Stumm W, Morgen JJ (1966) Aquatic Chemistry. Johan Wiley and Sons, New York, USA, p. 1022.
- PandeySK, Singh AK, Hasnain SI (2001) Hydrochemical characteristics of melt water draining from Pindari glacier, Kumon Himalaya. Journel of Geological Society of India 57: 519-527.
- Abhay KS, Mondal GC, Suresh Kumar TB, Singh BK, Tewary A, et al. (2008) Major ion chemistry, weathering processes and water quality assessment in upper catchment of Damodar River basin, India. Environmental Geology54: 745-758.


